Mastering AI Agent Tool Chains: A Visual Guide to Effective Workflow Design
Transform complex AI systems into clear, actionable visualizations
In today's rapidly evolving AI landscape, understanding how to effectively visualize and design AI agent tool chains is becoming a critical skill. This guide will help you master the art of representing complex AI workflows visually, enabling better design, communication, and optimization.
Understanding AI Agent Tool Chains: Foundation Concepts
AI agent tool chains represent interconnected systems where multiple AI tools collaborate to accomplish complex tasks that would be difficult for a single agent to handle. Unlike standalone applications, tool chains create sophisticated workflows that can tackle multifaceted problems through coordinated action.
                    flowchart TB
                        subgraph "AI Agent Tool Chain"
                            direction TB
                            A[Input Mechanism] --> B[Processing Agent 1]
                            B --> C[Processing Agent 2]
                            B --> D[Processing Agent 3]
                            C --> E[Output Formatter]
                            D --> E
                        end
                        style A fill:#FF8000,color:white
                        style B fill:#FFB366,color:black
                        style C fill:#FFB366,color:black
                        style D fill:#FFB366,color:black
                        style E fill:#FF8000,color:white
Core components of an AI agent tool chain showing input, processing, and output stages
Core Components
- Input Mechanisms: Systems that gather, format, and prepare data for processing by agents
- Processing Agents: Specialized AI tools that perform specific tasks within the workflow
- Output Formatting: Components that transform processed data into user-friendly formats
Visualization plays a crucial role in understanding these complex systems. By creating visual representations of AI agent tool chains, developers and stakeholders can more easily identify bottlenecks, optimize workflows, and communicate system architecture to team members with varying levels of technical expertise.
Common Challenges Visualization Solves
- Understanding complex agent interactions and dependencies
- Identifying potential failure points in the workflow
- Communicating system architecture to non-technical stakeholders
- Planning system scaling and modifications
- Tracking data flow throughout the process
As organizations increasingly adopt visual AI tools for complex workflows, the ability to effectively map and visualize these systems becomes a competitive advantage. Proper visualization not only improves understanding but also facilitates better design decisions throughout the development process.
Key Visualization Approaches for AI Tool Chains
Different visualization techniques serve distinct purposes when mapping AI agent tool chains. Choosing the right approach depends on what aspects of the system you need to highlight and communicate.
Flowchart Visualizations
Best for sequential processes with clear steps and decision points
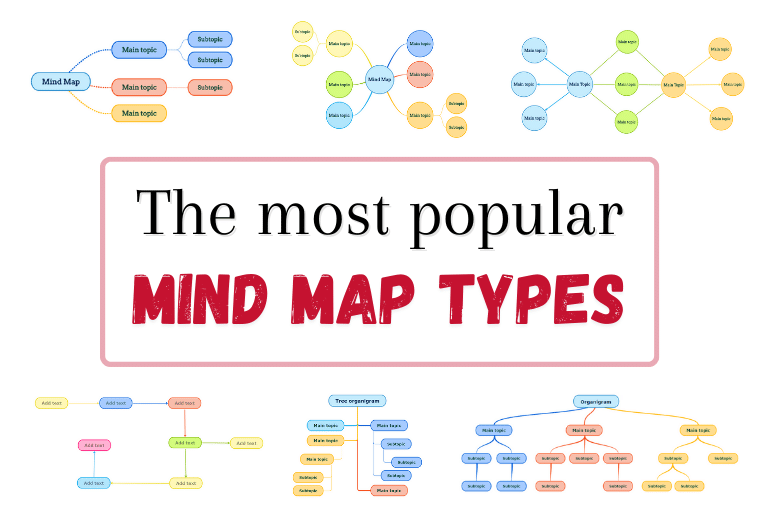
Mind Mapping
Ideal for conceptualizing relationships between agents and capabilities
Data Flow Visualization with Sankey Diagrams
Sankey diagrams are particularly effective for visualizing how data flows between different components of an AI agent tool chain, with the width of connections representing the volume of data being transferred.
Representation of data volume reduction through an AI agent pipeline
Decision Tree Visualizations
Decision trees help illustrate the logical decision-making process within AI agent systems, showing how different conditions lead to various outcomes or agent activations.
                    flowchart TD
                        A[Input Query] --> B{Query Type?}
                        B -->|Factual| C[Research Agent]
                        B -->|Creative| D[Content Generation Agent]
                        B -->|Analytical| E[Data Analysis Agent]
                        C --> F{Source Quality?}
                        F -->|High| G[Direct Answer]
                        F -->|Medium| H[Answer with Caveats]
                        F -->|Low| I[Request More Information]
                        D --> J[Generate Draft]
                        E --> K[Analyze Data]
                        K --> L[Generate Visualization]
                        style A fill:#FF8000,color:white
                        style B fill:#FF9F40,color:black
                        style C fill:#FFB366,color:black
                        style D fill:#FFB366,color:black
                        style E fill:#FFB366,color:black
                        style F fill:#FF9F40,color:black
                        style G fill:#E6E6E6,color:black
                        style H fill:#E6E6E6,color:black
                        style I fill:#E6E6E6,color:black
                        style J fill:#E6E6E6,color:black
                        style K fill:#E6E6E6,color:black
                        style L fill:#E6E6E6,color:black
Decision tree showing query routing in a multi-agent system
Performance Dashboard Visualizations
Dashboards provide real-time insights into how different components of an AI agent tool chain are performing, allowing for quick identification of issues and optimization opportunities.
Radar chart comparing performance metrics between two different AI agents
Choosing the right visualization approach depends on your specific needs. For complex workflows with many decision points, you might want to explore AI-powered flowchart tools that can automatically generate clear visual representations. For conceptualizing agent relationships and capabilities, AI mind mapping tools offer an intuitive way to organize and connect related concepts.
Designing Effective Tool Chain Visualizations with PageOn.ai
PageOn.ai offers powerful tools to transform complex AI agent architectures into clear, comprehensible visual representations through a simple, conversation-based interface.
Modular Visualization with AI Blocks
PageOn.ai's AI Blocks feature enables the creation of modular, adjustable visualizations that can evolve alongside your tool chain. Each block represents a distinct component or agent in your system, making it easy to rearrange, add, or remove elements as your architecture changes.
                    flowchart TB
                        subgraph "Input Layer"
                            A1[Text Input]
                            A2[Image Input]
                            A3[Data Input]
                        end

                        subgraph "Processing Layer"
                            B1[NLP Agent]
                            B2[Vision Agent]
                            B3[Analytics Agent]
                        end

                        subgraph "Integration Layer"
                            C1[Data Fusion]
                            C2[Context Builder]
                        end

                        subgraph "Output Layer"
                            D1[Response Generator]
                            D2[Visualization Engine]
                        end

                        A1 --> B1
                        A2 --> B2
                        A3 --> B3
                        B1 --> C1
                        B2 --> C1
                        B3 --> C1
                        C1 --> C2
                        C2 --> D1
                        C2 --> D2

                        style A1 fill:#FFB366,color:black
                        style A2 fill:#FFB366,color:black
                        style A3 fill:#FFB366,color:black
                        style B1 fill:#FF9F40,color:black
                        style B2 fill:#FF9F40,color:black
                        style B3 fill:#FF9F40,color:black
                        style C1 fill:#FF8000,color:white
                        style C2 fill:#FF8000,color:white
                        style D1 fill:#FF6000,color:white
                        style D2 fill:#FF6000,color:white
Modular AI Blocks visualization of a multi-modal AI agent system
Leveraging Deep Search for Technical Accuracy
PageOn.ai's Deep Search functionality allows you to integrate relevant technical specifications and best practices directly into your visualizations. This ensures that your diagrams are not only visually appealing but also technically accurate and up-to-date with the latest industry standards.
Creating Custom Visualization Templates
Develop reusable templates for different types of AI agent visualizations to maintain consistency across projects and save time when creating new diagrams.
Research Agent Template

Data Processing Template
Multi-Agent Template

Visual Differentiation Techniques
Effective tool chain visualizations require clear visual distinctions between different components. PageOn.ai enables you to create consistent visual language using colors, shapes, and connection styles.
Color-coding system for different types of agents in a tool chain
By using PageOn.ai's visualization capabilities, you can transform complex technical architectures into clear, intuitive diagrams that help both technical and non-technical stakeholders understand your AI agent tool chains. The platform's conversation-based approach makes it easy to iterate on designs and quickly adapt visualizations as your systems evolve.
Case Studies: Visualizing Common AI Agent Architectures
Different types of AI agent systems require specific visualization approaches to effectively communicate their structure and function. Let's examine visualization techniques for some common AI agent architectures.
Research Agents
Research agents typically involve planning, searching, and synthesizing information. Their visualizations need to highlight information flow and evaluation processes.
                    flowchart TB
                        A[User Query] --> B[Query Analyzer]
                        B --> C[Research Planner]
                        C --> D{Information Sufficient?}
                        D -->|No| E[Search Agent]
                        E --> F[Source Evaluator]
                        F --> G[Information Extractor]
                        G --> D
                        D -->|Yes| H[Synthesis Agent]
                        H --> I[Response Formatter]
                        I --> J[User Response]

                        style A fill:#FFB366,color:black
                        style B fill:#FFB366,color:black
                        style C fill:#FF9F40,color:black
                        style D fill:#FF8000,color:white
                        style E fill:#FF9F40,color:black
                        style F fill:#FF9F40,color:black
                        style G fill:#FF9F40,color:black
                        style H fill:#FF9F40,color:black
                        style I fill:#FFB366,color:black
                        style J fill:#FFB366,color:black
Research agent architecture with iterative information gathering and synthesis
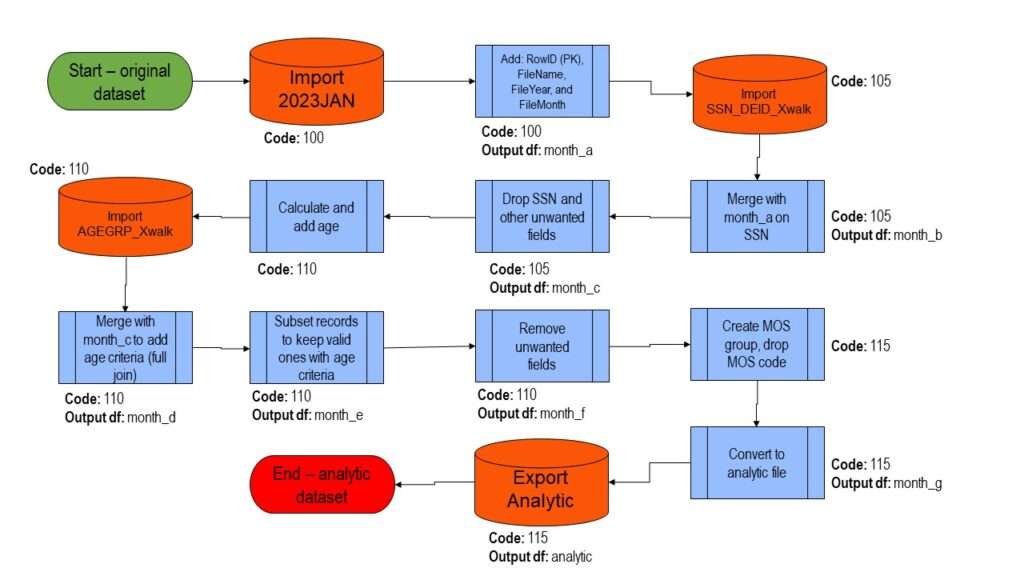
Data Processing Chains
Data processing chains focus on collection, cleaning, analysis, and visualization of data. Their visualizations should emphasize data transformation and quality improvement.
Data quality improvement visualization through a processing pipeline
Customer Service Agent Networks
Customer service agent networks involve routing, responding to, and potentially escalating customer inquiries. Visualizations should clearly show decision paths and escalation workflows.
                    flowchart TD
                        A[Customer Inquiry] --> B[Intent Classifier]
                        B --> C{Query Type?}
                        C -->|FAQ| D[FAQ Agent]
                        C -->|Account| E[Account Agent]
                        C -->|Technical| F[Technical Agent]
                        C -->|Billing| G[Billing Agent]
                        C -->|Complex| H[Human Handoff]

                        D --> I{Resolved?}
                        E --> I
                        F --> I
                        G --> I

                        I -->|Yes| J[Satisfaction Survey]
                        I -->|No| K[Escalation Agent]
                        K --> L[Tier 2 Support]
                        L --> M[Resolution Tracker]
                        J --> M

                        style A fill:#FFB366,color:black
                        style B fill:#FF9F40,color:black
                        style C fill:#FF8000,color:white
                        style D fill:#FF9F40,color:black
                        style E fill:#FF9F40,color:black
                        style F fill:#FF9F40,color:black
                        style G fill:#FF9F40,color:black
                        style H fill:#E6E6E6,color:black
                        style I fill:#FF8000,color:white
                        style J fill:#FFB366,color:black
                        style K fill:#FF9F40,color:black
                        style L fill:#E6E6E6,color:black
                        style M fill:#FFB366,color:black
Customer service agent network with routing and escalation paths
Content Creation Pipelines
Content creation pipelines involve ideation, creation, editing, and publishing stages. Visualizations should highlight the creative process and quality control workflows.
                    flowchart LR
                        A[Topic Research] --> B[Ideation Agent]
                        B --> C[Outline Generator]
                        C --> D[Content Creator]
                        D --> E[Editor Agent]
                        E --> F{Meets Standards?}
                        F -->|No| D
                        F -->|Yes| G[SEO Optimizer]
                        G --> H[Media Generator]
                        H --> I[Publisher]

                        style A fill:#FFB366,color:black
                        style B fill:#FF9F40,color:black
                        style C fill:#FF9F40,color:black
                        style D fill:#FF8000,color:white
                        style E fill:#FF9F40,color:black
                        style F fill:#FF8000,color:white
                        style G fill:#FF9F40,color:black
                        style H fill:#FF9F40,color:black
                        style I fill:#FFB366,color:black
Content creation pipeline with feedback loop for quality control
Multi-Agent Systems
Complex multi-agent systems with intricate communication patterns require specialized visualization approaches that highlight agent interactions and information exchange.
Communication patterns in a multi-agent system showing incoming and outgoing messages
These case studies demonstrate how different AI agent architectures require specialized visualization approaches. When designing ai-powered organizational charts for your agent systems, it's important to choose visualization techniques that best highlight the unique aspects of your specific architecture.
Best Practices for Tool Chain Visualization
Creating effective visualizations for AI agent tool chains requires a thoughtful approach to visual design, information hierarchy, and audience consideration.
Establish Consistent Visual Language
Developing a consistent visual language is crucial for creating comprehensible AI agent tool chain visualizations. This includes standardizing:
- Colors: Use a consistent color scheme where each color represents a specific type of agent or function
- Shapes: Assign distinct shapes to different components (e.g., rectangles for processing agents, diamonds for decision points)
- Connections: Use different line styles to represent various types of relationships or data flows
- Icons: Develop a library of consistent icons for common agent functions

Implement Appropriate Detail Levels
The level of detail in your visualizations should be tailored to your audience's technical expertise and the purpose of the visualization.
Appropriate detail levels for different audience types
Create Interactive Visualizations
Interactive visualizations allow users to explore different aspects of the tool chain at their own pace and focus on the elements most relevant to their needs.
Interactive Visualization Features
Zoom & Pan
Allow users to focus on specific sections of complex diagrams
Drill-Down
Enable exploration of nested details within components
Filtering
Allow toggling visibility of different agent types or connections
Tooltips
Provide additional information on hover without cluttering the diagram
Animation
Show data flow or sequential processing through motion
Search
Find specific components or connections within complex diagrams
Develop Visualization Standards
Establishing organization-wide standards for AI agent tool chain visualization ensures consistency and facilitates understanding across different projects and teams.
                    flowchart TD
                        A[Define Visual Language] --> B[Create Component Library]
                        B --> C[Establish Templates]
                        C --> D[Document Standards]
                        D --> E[Train Team Members]
                        E --> F[Implement Review Process]
                        F --> G[Gather Feedback]
                        G --> H[Iterate & Improve]
                        H --> F

                        style A fill:#FFB366,color:black
                        style B fill:#FFB366,color:black
                        style C fill:#FF9F40,color:black
                        style D fill:#FF9F40,color:black
                        style E fill:#FF8000,color:white
                        style F fill:#FF8000,color:white
                        style G fill:#FF9F40,color:black
                        style H fill:#FF9F40,color:black
Process for developing and maintaining visualization standards
Balance Technical Accuracy with Visual Clarity
The most effective AI agent tool chain visualizations strike a careful balance between technical accuracy and visual clarity. While it's important to accurately represent the system's architecture, overwhelming diagrams with too much detail can reduce comprehensibility.
Technical Accuracy Considerations
- Represent all key components and connections
- Use technically correct terminology
- Maintain accurate relationship representations
- Include critical parameters and configurations
- Document exceptions and edge cases
Visual Clarity Techniques
- Group related components visually
- Use hierarchy to organize information
- Implement consistent spacing and alignment
- Reduce line crossings in diagrams
- Use appropriate text size and contrast
By following these best practices, you can create AI agent tool chain visualizations that effectively communicate complex systems while remaining accessible and useful to your target audience. As AI tool trends 2025 continue to evolve, maintaining high-quality visualization standards will become increasingly important for organizations working with sophisticated AI systems.
Measuring and Optimizing Tool Chain Performance Through Visualization
Visualization plays a crucial role not just in understanding AI agent tool chains but also in measuring, analyzing, and optimizing their performance.
Key Performance Indicators for AI Agent Tool Chains
Identifying and visualizing the right KPIs is essential for effective tool chain optimization. These metrics provide insights into how well your system is performing and where improvements might be needed.
Performance dashboard comparing current metrics against targets
Visual Bottleneck Analysis
Bottleneck analysis helps identify components or connections in your tool chain that limit overall performance. Visualizing these constraints makes them easier to spot and address.
                    flowchart LR
                        A[Input Handler] -->|100 req/s| B[Query Processor]
                        B -->|95 req/s| C[Search Agent]
                        C -->|40 req/s| D[Data Analyzer]
                        D -->|38 req/s| E[Response Generator]
                        E -->|35 req/s| F[Output Formatter]

                        style A fill:#FFB366,color:black
                        style B fill:#FFB366,color:black
                        style C fill:#FF0000,color:white
                        style D fill:#FFB366,color:black
                        style E fill:#FFB366,color:black
                        style F fill:#FFB366,color:black
Bottleneck analysis showing constrained throughput at the Search Agent
Visualizing Agent Dependencies
Understanding and visualizing dependencies between agents helps identify potential failure points and opportunities for increased resilience.
Agent dependency analysis showing relationship between dependency level and failure impact
Visual Comparison of Tool Chain Configurations
Comparing different tool chain configurations visually helps identify the optimal architecture for your specific use case.
Comparison of three different tool chain configurations across multiple performance dimensions
Before/After Visualization for Optimization
Creating visual representations of your tool chain before and after optimization helps demonstrate improvements and justify optimization efforts.
Before Optimization

After Optimization
Quantitative comparison of key metrics before and after optimization
Visualization is a powerful tool for ongoing performance monitoring and optimization of AI agent tool chains. By creating clear visual representations of performance metrics, bottlenecks, dependencies, and configuration comparisons, you can make more informed decisions about how to improve your systems.
Future Trends in AI Agent Tool Chain Visualization
As AI agent systems become more complex and prevalent, visualization techniques will need to evolve to meet new challenges and opportunities.
3D and VR-Based Visualization
The future of AI agent tool chain visualization is likely to include immersive 3D and virtual reality representations that allow users to explore complex systems from multiple perspectives and interact with components in a more intuitive way.
- Spatial arrangement of agents based on functional relationships
- Ability to "walk through" data flows and processing stages
- Interactive manipulation of components in three-dimensional space
- Multi-user collaborative visualization environments

Real-Time Visualization for Dynamic Monitoring
As AI agent systems become more dynamic, real-time visualization will become increasingly important for monitoring and managing these complex systems.
Real-time monitoring of agent utilization over the past minute
Visualizing Autonomous Agent Systems
As AI agents become more autonomous, visualization techniques will need to adapt to represent self-organizing and self-optimizing systems.
                    flowchart TB
                        subgraph "Autonomous Agent System"
                            direction TB
                            A[Monitoring System] --> B{Performance OK?}
                            B -->|No| C[Self-Diagnostic]
                            C --> D[Issue Identification]
                            D --> E{Can Self-Repair?}
                            E -->|Yes| F[Self-Optimization]
                            F --> G[Configuration Update]
                            G --> H[Performance Validation]
                            H --> A
                            E -->|No| I[Alert Human]
                            B -->|Yes| J[Continue Operation]
                            J --> A
                        end

                        style A fill:#FFB366,color:black
                        style B fill:#FF8000,color:white
                        style C fill:#FF9F40,color:black
                        style D fill:#FF9F40,color:black
                        style E fill:#FF8000,color:white
                        style F fill:#FF9F40,color:black
                        style G fill:#FF9F40,color:black
                        style H fill:#FF9F40,color:black
                        style I fill:#E6E6E6,color:black
                        style J fill:#FFB366,color:black
Self-optimizing autonomous agent system with minimal human intervention
Human-in-the-Loop Visualization
Despite increasing autonomy, human oversight remains crucial. Future visualizations will need to clearly show where and how humans interact with AI agent systems.
                    flowchart LR
                        subgraph "AI System"
                            A[Input Processing]
                            B[Analysis Engine]
                            C[Decision Generator]
                            D{Confidence Check}
                            E[Automated Action]
                            F[Human Review Queue]
                        end

                        subgraph "Human Interface"
                            G[Review Dashboard]
                            H[Decision Modification]
                            I[Approval Action]
                            J[Feedback Loop]
                        end

                        A --> B
                        B --> C
                        C --> D
                        D -->|High Confidence| E
                        D -->|Low Confidence| F
                        F --> G
                        G --> H
                        H --> I
                        I --> E
                        I --> J
                        J --> B

                        style A fill:#FFB366,color:black
                        style B fill:#FF9F40,color:black
                        style C fill:#FF9F40,color:black
                        style D fill:#FF8000,color:white
                        style E fill:#FF9F40,color:black
                        style F fill:#FF9F40,color:black
                        style G fill:#E6E6E6,color:black
                        style H fill:#E6E6E6,color:black
                        style I fill:#E6E6E6,color:black
                        style J fill:#E6E6E6,color:black
Human-in-the-loop system showing intervention points and feedback mechanisms
Visualization Trends for 2025
As we look toward 2025, several key trends are likely to shape the future of AI agent tool chain visualization.
Forecast of visualization technology adoption trends through 2027
The future of AI agent tool chain visualization promises to be both exciting and challenging. As systems become more complex, autonomous, and prevalent, visualization techniques will need to evolve to maintain clarity while representing increasingly sophisticated relationships and behaviors. By staying ahead of these trends, organizations can ensure their visualization approaches remain effective and valuable in the rapidly changing AI landscape.
Transform Your AI Tool Chain Visualizations with PageOn.ai
Create stunning, intuitive visualizations that help you design, communicate, and optimize complex AI agent systems. PageOn.ai's conversation-based interface makes it easy to transform technical complexity into visual clarity.
Start Creating with PageOn.ai TodayYou Might Also Like
How to Design Science Lesson Plans That Captivate Students
Create science lesson plans that captivate students with hands-on activities, clear objectives, and real-world applications to foster curiosity and critical thinking.
How to Write a Scientific Review Article Step by Step
Learn how to write a review article in science step by step. Define research questions, synthesize findings, and structure your article for clarity and impact.
How to Write a Self-Performance Review with Practical Examples
Learn how to write a self-performance review with examples and tips. Use an employee performance review work self evaluation sample essay to guide your process.
How to Write a Spec Sheet Like a Pro? [+Templates]
Learn how to create a professional spec sheet with key components, step-by-step guidance, and free templates to ensure clarity and accuracy.