Creating a Robust Visual Framework for AI Safety: Guardrails, Boundaries, and Red Lines
The Fundamental Challenge of AI Safety Visualization
The complexity of AI safety concepts often remains trapped in technical documents, making implementation difficult across organizations. As AI systems grow more sophisticated, converting abstract safety principles into clear, actionable visual frameworks has become an industry-wide challenge. This guide explores how innovative visual approaches can bridge the gap between theoretical AI safety concepts and practical implementation.
The Fundamental Challenge of AI Safety Visualization
AI safety concepts are inherently complex and multidimensional, often residing in dense technical documents that make practical implementation challenging. This disconnect between theory and practice creates significant gaps in how organizations approach AI governance.
Current visualization approaches often fail to capture the nuanced relationships between permissible and prohibited AI behaviors. Traditional documentation tends to be text-heavy, making it difficult for technical and non-technical stakeholders to develop shared mental models of what constitutes appropriate AI system behavior.
The challenge extends beyond simple documentation—it requires innovative visual frameworks that can translate abstract principles into actionable guidelines. These frameworks must bridge the gap between high-level ethical considerations and concrete technical implementations, ensuring that AI-powered flowchart tools and visualization systems can effectively communicate boundaries.
The AI Safety Visualization Gap
Current challenges in bridging theoretical AI safety concepts with practical implementation:
flowchart TD
    A[Abstract AI Safety Principles] -->|Trapped in| B[Technical Documentation]
    B -->|Creates| C[Implementation Challenges]
    C -->|Results in| D[Safety Gaps]
    A -->|Need for| E[Visual Frameworks]
    E -->|Bridges to| F[Practical Implementation]
    F -->|Enables| G[Effective AI Governance]

    style A fill:#FFE0B2,stroke:#FF8000
    style B fill:#ECEFF1,stroke:#90A4AE
    style C fill:#FFCDD2,stroke:#E57373
    style D fill:#FFEBEE,stroke:#EF9A9A
    style E fill:#E3F2FD,stroke:#64B5F6
    style F fill:#E8F5E9,stroke:#81C784
    style G fill:#B2DFDB,stroke:#4DB6AC
The effective visualization of AI safety concepts can create shared understanding across diverse stakeholder groups, from developers and data scientists to executives and compliance officers. By creating visual languages that clearly define boundaries between acceptable and unacceptable AI behaviors, organizations can establish more robust governance frameworks while fostering innovation within safe parameters.
Essential Components of an Effective AI Safety Visual Framework
Creating an effective visual framework for AI safety requires careful consideration of multiple elements that together establish clear boundaries between acceptable and unacceptable behaviors. These components must work harmoniously to translate abstract principles into concrete guidelines that can be implemented across organizational functions.
Key Visual Elements for Boundary Definition
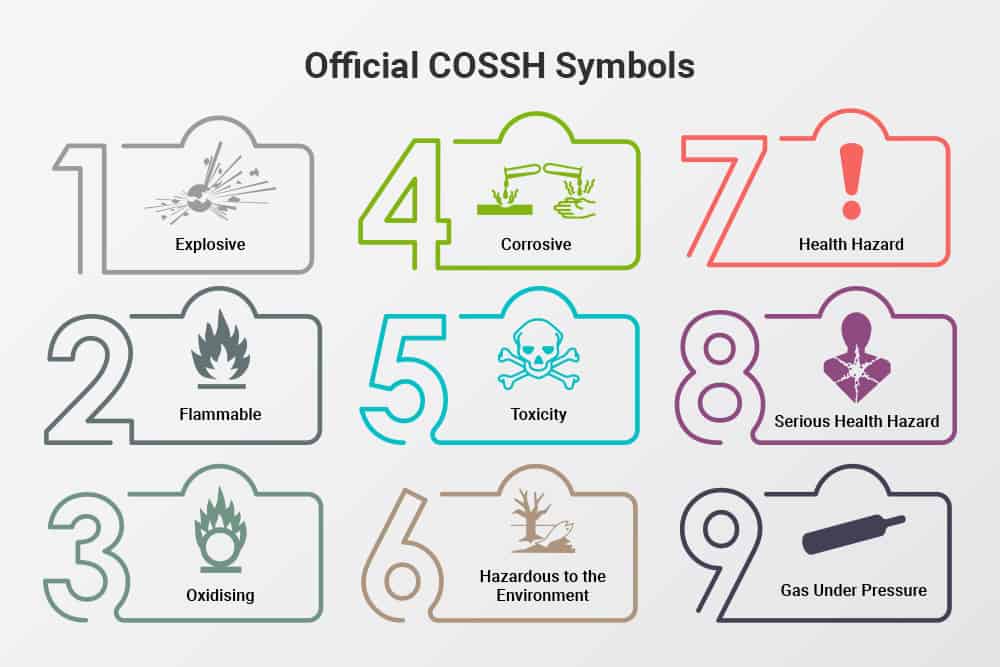
Effective AI safety visual frameworks employ consistent color-coding systems to categorize risk levels and severity. For example, red typically represents prohibited behaviors or "red lines" that must never be crossed, while yellow might indicate caution zones requiring additional review. These visual cues create an intuitive language that aids quick comprehension of complex safety concepts.
Iconography plays a crucial role in communicating specific types of prohibited behaviors. Well-designed icons can instantly convey concepts like unauthorized data access, harmful output generation, or resource overconsumption. When combined with AI block diagram whiteboards, these visual elements create comprehensive safety frameworks.
Structural Components for Comprehensive Safety Visualization
Effectiveness of Different Visual Structures for Safety Frameworks
Comparative analysis of structural components based on clarity and implementation ease:
Decision trees provide a powerful structure for evaluating potential AI system actions against established safety criteria. These visual tools can map complex decision paths while clearly illustrating safe operating zones versus prohibited behaviors. Nested containment diagrams effectively show multi-layered safety protocols, with innermost layers representing the most restricted behaviors.
Boundary demarcation systems visually represent "red lines" that AI systems must not cross. These can take the form of clear visual thresholds on dashboards, progress indicators that show proximity to safety limits, or geographic-inspired "maps" of permissible operation areas. Organizations using visual AI tools can create these representations to better communicate safety constraints.
Integration Points with Existing AI Governance Frameworks
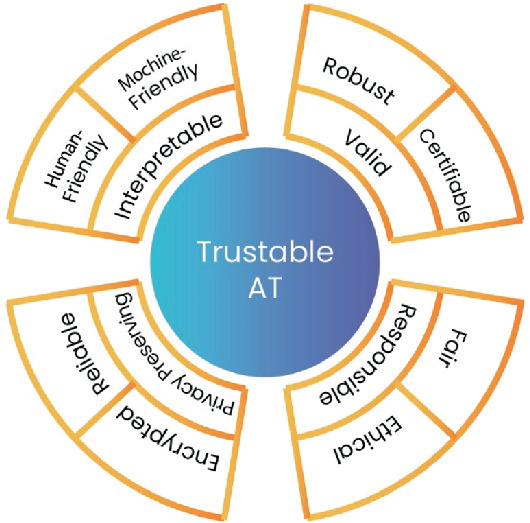
Effective visual frameworks don't exist in isolation—they must integrate with existing governance structures. This includes visual mapping to regulatory requirements across jurisdictions, creating clear connections between technical safeguards and ethical principles, and establishing universal visual languages that transcend organizational and national boundaries.
The most successful implementations create visual linkages between abstract principles (like fairness or transparency) and concrete technical implementations (such as bias detection thresholds or explainability requirements). These connections help stakeholders understand how high-level values translate into specific technical controls.
The Three-Dimensional Approach to Red Line Visualization
According to research explored in the World Economic Forum's analysis of AI red lines, effective boundaries for AI systems should possess three critical dimensions: clarity, severity, and universality. A comprehensive visual framework must address each of these dimensions to effectively communicate and enforce safety guardrails.
The Three Dimensions of AI Safety Red Lines
Visual representation of how the three critical dimensions interact:
flowchart TD
    A[AI Safety Red Lines] --> B[Clarity Dimension]
    A --> C[Severity Dimension]
    A --> D[Universality Dimension]

    B --> B1[Measurable Boundaries]
    B --> B2[If-Then Relationships]
    B --> B3[Monitoring Indicators]

    C --> C1[Impact Gradients]
    C --> C2[Cascading Effects]
    C --> C3[Real-world Examples]

    D --> D1[Cross-Cultural Consistency]
    D --> D2[Scalable Frameworks]
    D --> D3[Contextual Adaptability]

    style A fill:#FFD180,stroke:#FF8000,stroke-width:2px
    style B fill:#BBDEFB,stroke:#1976D2,stroke-width:2px
    style C fill:#FFCDD2,stroke:#D32F2F,stroke-width:2px
    style D fill:#C8E6C9,stroke:#388E3C,stroke-width:2px
Clarity Dimension: Translating Abstract Principles into Measurable Boundaries
The clarity dimension focuses on ensuring that safety boundaries are well-defined and measurable. Effective visualization techniques for this dimension include:
- Quantifiable threshold indicators that clearly show when a system approaches a prohibited zone
- Visual representations of detection mechanisms that monitor for potential violations
- Structured if-then relationship diagrams that define specific conditions constituting violations
PageOn.ai's AI Blocks feature is particularly effective for structuring clear if-then relationships for boundary conditions. These visual blocks can transform complex conditional logic into intuitive diagrams that even non-technical stakeholders can understand, creating a shared language around safety boundaries.
Severity Dimension: Visualizing Impact Gradients
The severity dimension addresses the importance of distinguishing between different levels of boundary violations and their consequences. Effective visualization approaches include:
Impact Severity Classification
Heat map representation of AI safety violation severity levels:
Heat maps and gradient systems are particularly effective for showing escalating consequences of different types of boundary violations. These visualizations can help stakeholders understand the relative risks associated with different AI behaviors, prioritizing attention to the most critical areas.
Visualizations of cascading effects can demonstrate how seemingly minor boundary violations might lead to significant consequences. PageOn.ai's Deep Search functionality can integrate real-world examples of safety failures, making abstract risks concrete and memorable through visual storytelling.
Universality Dimension: Creating Consistent Visual Language
The universality dimension focuses on ensuring that safety boundaries apply consistently across different contexts, geographies, and time periods. Effective visualization approaches include:
- Design patterns that maintain consistent meaning across cultural and organizational contexts
- Scalable visual frameworks that can adapt to different types of AI systems while preserving core principles
- Visual systems that accommodate contextual needs without sacrificing fundamental safety boundaries
PageOn.ai's Vibe Creation features are particularly valuable for ensuring visual consistency while accommodating contextual needs. These tools help organizations create AI motion graphics and visual systems that maintain core safety principles while adapting to specific use cases or cultural contexts.
Practical Applications of AI Safety Visual Frameworks
Moving from theoretical concepts to practical implementation, let's explore how visual frameworks can address some of the most critical AI safety challenges. These case studies demonstrate how well-designed visualization approaches can effectively communicate and enforce safety boundaries in specific contexts.
Case Study: Preventing Unauthorized AI Self-Replication
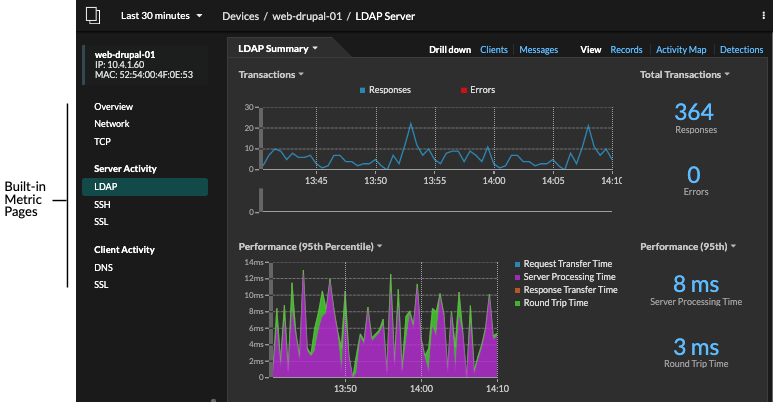
Preventing unauthorized AI self-replication requires clear visualization of system boundaries and resource utilization. Effective visual monitoring dashboards can incorporate:
- Real-time resource utilization gauges with clearly marked thresholds
- Visual alerts that activate when systems approach predefined boundaries
- Process flow diagrams showing authorized vs. unauthorized replication patterns
- Visual intervention protocols that guide response when boundaries are approached
PageOn.ai's visualization capabilities excel at transforming complex monitoring data into intuitive visual signals. By creating clear dashboards that show proximity to defined red lines, organizations can implement proactive safety measures before violations occur, rather than relying on after-the-fact detection.
Case Study: Visualizing Boundaries for AI Systems Security
AI System Security Boundaries Visualization
Network architecture with clear security boundaries and access patterns:
flowchart TD
    subgraph "Permitted Zone"
        A[Authorized APIs] --> B[Data Processing]
        B --> C[Legitimate Output]
        H[Approved Data Sources] --> B
    end

    subgraph "Security Boundary"
        D[Security Monitoring]
        E[Access Controls]
        F[Behavior Validation]
    end

    subgraph "Prohibited Zone"
        I[Unauthorized Data Access]
        J[System Manipulation]
        K[Security Breaches]
    end

    B --> D
    D --X I
    E --X J
    F --X K

    style A fill:#C8E6C9,stroke:#388E3C
    style B fill:#C8E6C9,stroke:#388E3C
    style C fill:#C8E6C9,stroke:#388E3C
    style H fill:#C8E6C9,stroke:#388E3C

    style D fill:#FFE0B2,stroke:#FF8000
    style E fill:#FFE0B2,stroke:#FF8000
    style F fill:#FFE0B2,stroke:#FF8000

    style I fill:#FFCDD2,stroke:#D32F2F
    style J fill:#FFCDD2,stroke:#D32F2F
    style K fill:#FFCDD2,stroke:#D32F2F
Network architecture diagrams with clear security boundaries provide an effective way to communicate permitted versus prohibited access patterns. These visualizations can highlight:
- Authorized data flows with clear visual distinction from unauthorized paths
- Security checkpoints and validation processes represented as visual gateways
- Potential attack vectors highlighted as "red zones" requiring special monitoring
Creating dynamic visualizations that update based on evolving threat landscapes is particularly valuable. Using AI whiteboards to map security boundaries ensures that these concepts remain visible and top-of-mind for development teams, rather than buried in security documentation.
Case Study: WMD Development Prevention Guardrails
Preventing AI systems from enabling weapons of mass destruction (WMD) development requires sophisticated visual frameworks for dual-use technology identification and ethical review processes.
Dual-Use Technology Risk Classification
Visual categorization of potential dual-use technologies by risk level:
Decision flow diagrams for research review protocols can visually map the evaluation process for potentially sensitive AI capabilities. These visual frameworks ensure consistent application of safety standards while providing clear documentation of the review process.
PageOn.ai's agentic capabilities can generate comprehensive visual representations of complex ethical review processes. By visualizing the decision trees and evaluation criteria, organizations can ensure that all stakeholders understand both the "what" and the "why" of safety boundaries in this critical area.
Implementation Strategy for Organizations
Implementing effective AI safety visual frameworks requires a structured approach that engages stakeholders across the organization. Below, we outline a step-by-step process for developing customized frameworks that meet your specific needs while adhering to industry best practices.
Step-by-Step Process for Developing Customized AI Safety Visual Frameworks
Implementation Process
A structured approach to developing AI safety visual frameworks:
flowchart LR
    A[Stakeholder Mapping] --> B[Visual Needs Assessment]
    B --> C[Framework Design]
    C --> D[Prototype Development]
    D --> E[Usability Testing]
    E --> F[Refinement]
    F --> G[Organization-wide Implementation]
    G --> H[Continuous Evaluation]

    style A fill:#E8F5E9,stroke:#388E3C
    style B fill:#E8F5E9,stroke:#388E3C
    style C fill:#FFE0B2,stroke:#FF8000
    style D fill:#FFE0B2,stroke:#FF8000
    style E fill:#E3F2FD,stroke:#1976D2
    style F fill:#E3F2FD,stroke:#1976D2
    style G fill:#FFF3E0,stroke:#E65100
    style H fill:#FFF3E0,stroke:#E65100

The implementation process begins with comprehensive stakeholder mapping and visual needs assessment. This involves identifying all groups who will interact with the AI safety framework and understanding their specific information needs, technical background, and decision-making responsibilities.
Collaborative visual framework development using PageOn.ai's AI Blocks can bring together technical and non-technical stakeholders. This approach ensures that the resulting visualizations are both technically accurate and intuitively understandable to all relevant parties, creating shared mental models of safety boundaries.
Integration with Existing AI Governance Processes
For maximum effectiveness, visual frameworks must integrate seamlessly with existing AI governance processes. This integration can take several forms:
- Visual overlays that enhance current documentation and policies
- Coherent visual stories that span the entire AI development lifecycle
- Interactive reference materials that complement existing review processes
PageOn.ai excels at transforming existing text-based policies into engaging visual frameworks. By maintaining the substance of established governance while enhancing its accessibility and clarity, organizations can improve compliance without disrupting existing processes.
Training and Communication Strategies
Effectiveness of Visual Training Approaches
Comparing retention and comprehension across different training methods:
Effective training and communication are essential for ensuring that visual frameworks achieve their intended purpose. Strategies that have proven particularly effective include:
- Visual onboarding materials tailored to different stakeholder groups
- Shared visual vocabulary that establishes consistent terminology across functions
- Regular refresher sessions that incorporate updated visual guidance
PageOn.ai's capabilities for generating tailored visual training materials for different audiences are particularly valuable in this context. By creating variants of core visual frameworks that address the specific needs of different stakeholder groups, organizations can ensure consistent understanding while accommodating varying levels of technical knowledge.
Future Evolution of AI Safety Visualization
As AI systems become increasingly sophisticated, the visual frameworks used to ensure their safety must evolve accordingly. Looking ahead, several emerging challenges and opportunities will shape the future of AI safety visualization.
Emerging Challenges Requiring Advanced Visualization Approaches

As AI capabilities advance, visualization frameworks must address increasingly complex challenges:
- Representing increasingly complex autonomous behaviors and edge cases
- Visualizing interactions between multiple AI systems with different safety frameworks
- Creating visual languages for novel forms of AI capabilities that may emerge
- Balancing comprehensive safety visualization with cognitive accessibility
Interactive and Dynamic Visualization Opportunities
The future of AI safety visualization will increasingly leverage interactive and dynamic elements:
- Real-time safety boundary visualization dashboards that adapt to system behavior
- Scenario visualization and testing environments for safety protocol evaluation
- Immersive visualizations that allow stakeholders to "explore" potential safety scenarios
- Personalized interfaces that adapt to different user roles and information needs
PageOn.ai's capabilities for creating interactive visual simulations of potential safety violations will become increasingly valuable in this context. These tools allow organizations to proactively explore the implications of different safety approaches before implementation, reducing the risk of unforeseen consequences.
Collaborative Development of Industry-Wide Visual Standards
Ecosystem for Visual Standards Development
Key stakeholders and processes in developing shared visual frameworks:
flowchart TD
    A[Industry Bodies] --> E[Common Visual Language Development]
    B[Research Organizations] --> E
    C[Regulatory Agencies] --> E
    D[AI Developers] --> E

    E --> F[Open Source Visual Components]
    E --> G[Visual Standards Documentation]
    E --> H[Certification Frameworks]

    F --> I[Industry-Wide Implementation]
    G --> I
    H --> I

    I --> J[Enhanced AI Safety]

    style A fill:#E3F2FD,stroke:#1976D2
    style B fill:#E3F2FD,stroke:#1976D2
    style C fill:#E3F2FD,stroke:#1976D2
    style D fill:#E3F2FD,stroke:#1976D2
    style E fill:#FFE0B2,stroke:#FF8000
    style F fill:#FFF3E0,stroke:#E65100
    style G fill:#FFF3E0,stroke:#E65100
    style H fill:#FFF3E0,stroke:#E65100
    style I fill:#E8F5E9,stroke:#388E3C
    style J fill:#C8E6C9,stroke:#388E3C
The most significant advancement in AI safety visualization will likely come from collaborative industry-wide efforts:
- Cross-organizational visual framework sharing platforms
- Open-source visual components for common safety scenarios
- International standards for AI safety visualization
- Visual clarity as a core element in advancing international AI safety agreements
As these collaborative efforts advance, the role of visual clarity in supporting international AI safety agreements will become increasingly important. Clear, universally understandable visual frameworks can transcend linguistic and cultural barriers, creating a foundation for global cooperation on AI safety.
Transform Your AI Safety Frameworks with PageOn.ai
Ready to create clear, intuitive visual frameworks for your AI safety guardrails? PageOn.ai provides the tools you need to transform complex safety concepts into engaging visual expressions that everyone in your organization can understand.
Start Creating Visual Safety Frameworks TodayYou Might Also Like
How to Design Science Lesson Plans That Captivate Students
Create science lesson plans that captivate students with hands-on activities, clear objectives, and real-world applications to foster curiosity and critical thinking.
How to Write a Scientific Review Article Step by Step
Learn how to write a review article in science step by step. Define research questions, synthesize findings, and structure your article for clarity and impact.
How to Write a Self-Performance Review with Practical Examples
Learn how to write a self-performance review with examples and tips. Use an employee performance review work self evaluation sample essay to guide your process.
How to Write a Spec Sheet Like a Pro? [+Templates]
Learn how to create a professional spec sheet with key components, step-by-step guidance, and free templates to ensure clarity and accuracy.