Creating Dynamic MCP Component Diagrams
From Architecture to Interactive Visualization
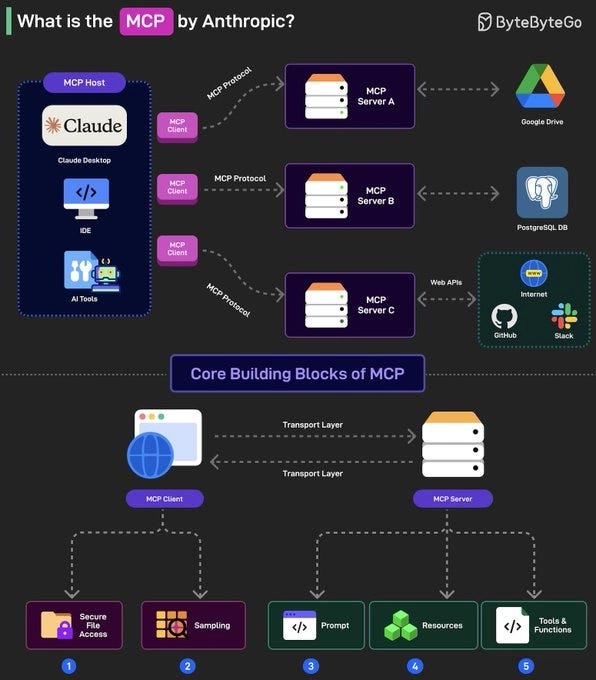
Multi-agent Communication Protocol (MCP) enables sophisticated agent-to-agent interactions in AI systems. Creating clear, interactive component diagrams is essential for understanding, developing, and debugging these complex architectures. This comprehensive guide will walk you through the fundamentals of MCP architecture, design principles for effective diagrams, and techniques to transform static representations into dynamic, interactive visualizations.
Understanding MCP Architecture Fundamentals
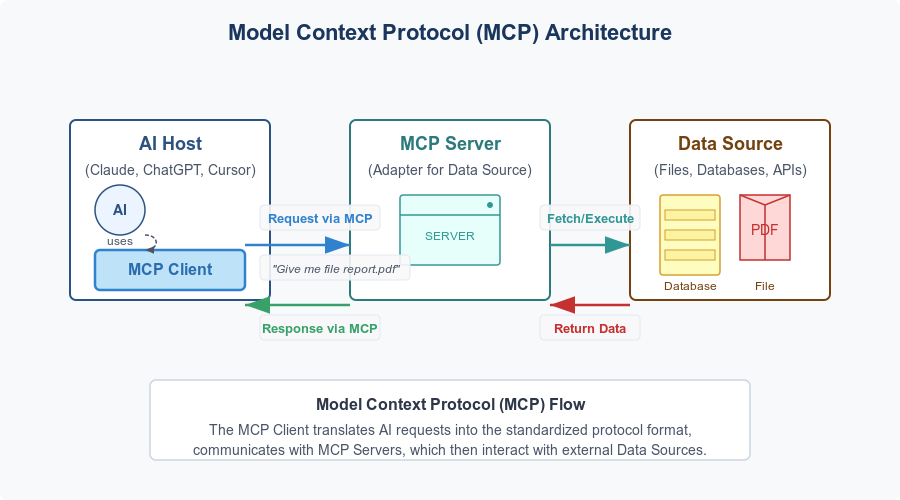
The Multi-agent Communication Protocol (MCP) provides a structured framework for enabling sophisticated interactions between AI agents. Before diving into diagram creation, it's essential to understand the core architectural components that form the foundation of any MCP system.
                    flowchart TB
                        User[User] --> RootAgent[Root Agent]
                        RootAgent --> |"Delegates via MCP"| SpecAgent1[Specialized Agent 1]
                        RootAgent --> |"Delegates via MCP"| SpecAgent2[Specialized Agent 2]
                        RootAgent --> |"Delegates via MCP"| SpecAgent3[Specialized Agent 3]
                        SpecAgent1 --> |"Uses"| Tool1[Tool A]
                        SpecAgent2 --> |"Uses"| Tool2[Tool B]
                        SpecAgent3 --> |"Uses"| Tool3[Tool C]

                        classDef agent fill:#FF8000,stroke:#333,stroke-width:1px,color:white;
                        classDef tool fill:#42A5F5,stroke:#333,stroke-width:1px,color:white;
                        classDef user fill:#66BB6A,stroke:#333,stroke-width:1px,color:white;

                        class RootAgent,SpecAgent1,SpecAgent2,SpecAgent3 agent;
                        class Tool1,Tool2,Tool3 tool;
                        class User user;
Basic MCP architecture showing relationship between agents and tools
Core Architectural Components
At its heart, MCP architecture consists of several key components:
- Root Agent: Acts as the primary interface for users, handling initial requests and coordinating the work of specialized agents.
- Specialized Agents: Purpose-built LLM agents designed to perform specific tasks or reasoning processes.
- Tools: External services or functions that agents can call to retrieve information or perform actions.
- Communication Protocol: The standardized format and methods for passing messages between system components.
The "Agent-as-a-Tool" Pattern
One of the most powerful concepts in MCP architecture is the "Agent-as-a-Tool" pattern, where specialized LLM agents can be invoked by other agents just like traditional tools. This pattern:
- Enables complex delegation chains where agents can leverage specialized capabilities of other agents
- Promotes modularity by allowing agents to focus on specific tasks or domains
- Facilitates hierarchical problem-solving approaches with root agents coordinating specialized sub-agents
Agent-as-a-Tool pattern illustrated in a comprehensive MCP system
Prerequisites for Working with MCP
Before starting work with MCP component diagrams, ensure you have these foundational requirements:
- Python 3.10 or higher
- Understanding of basic UML component diagrams
- Familiarity with agent architectures and communication patterns
- Required Python packages for MCP implementation
With these foundational concepts in mind, you can begin to represent complex MCP architectures visually through component diagrams that accurately reflect both structure and interaction patterns between agents and tools.
Designing Effective MCP Component Diagrams
Creating clear and informative MCP component diagrams requires thoughtful design choices that balance detail with readability. An effective diagram conveys the essential relationships and interactions without overwhelming the viewer with unnecessary complexity.
Key Elements for MCP Diagrams
                    classDiagram
                        class RootAgent {
                            +processUserRequest()
                            +delegateToSpecialists()
                            +synthesizeResults()
                        }

                        class SpecializedAgent {
                            +executeTask()
                            +useTools()
                            +reportResults()
                        }

                        class Tool {
                            +performAction()
                            +returnResults()
                        }

                        class MCPProtocol {
                            +formatMessage()
                            +routeMessage()
                            +validateMessage()
                        }

                        RootAgent --> SpecializedAgent : delegates via
                        SpecializedAgent --> Tool : uses
                        RootAgent ..> MCPProtocol : communicates using
                        SpecializedAgent ..> MCPProtocol : communicates using
Class diagram showing key MCP components and their relationships
When designing MCP component diagrams, be sure to incorporate these essential elements:
- Agents: Clearly distinguish between root agents and specialized agents with consistent visual styling
- Tools: Represent external tools and services that agents interact with
- Communication Flows: Show message passing between components with directional arrows
- System Boundaries: Delineate the scope of the MCP system versus external interfaces
- Component Types: Use consistent visual conventions for different component types
Visual Representation Conventions
Agent Representation
- Use rectangles with rounded corners
- Root agents typically positioned at the top
- Color-code by agent type or function
- Include core capabilities in the agent box
Connection Representation
- Solid lines for direct method calls
- Dashed lines for event-based communication
- Labeled arrows indicating the API or method called
- Arrowhead direction showing information flow
Data Flow Visualization
Representing data flow between components is crucial for understanding how information moves through an MCP system. Interactive data visualization tools can help illustrate:

Data flow visualization showing message passing between MCP components
Maintaining Diagram Clarity
As MCP architectures grow in complexity, maintaining diagram clarity becomes increasingly important. Consider these strategies:
- Use hierarchical grouping to organize related components
- Implement collapsible sections for detailed subsystems
- Create multiple diagram views at different levels of abstraction
- Establish consistent color coding and iconography
- Limit the number of crossing lines by thoughtful component arrangement
- Consider using different types of diagrams for various aspects of the system
By following these design principles, you can create MCP component diagrams that effectively communicate complex architectures while remaining accessible and intuitive for all stakeholders.
Tools and Technologies for MCP Diagram Creation
Selecting the right tools for creating MCP component diagrams can significantly impact both the development process and the final result. From specialized UML tools to AI-assisted diagramming platforms, various options offer different advantages.
UML-MCP Server Capabilities
UML-MCP server provides a specialized environment for generating MCP component diagrams programmatically. Its key features include:
UML-MCP Server Setup
PageOn.ai's AI Blocks for MCP Components
PageOn.ai offers an innovative approach to MCP diagram creation through its AI Blocks feature. This enables:
- Rapid prototyping of MCP component structures
- Drag-and-drop arrangement of architectural elements
- Automatic generation of connection points and relationship lines
- Smart formatting that maintains diagram clarity as complexity grows
- Seamless transition between high-level and detailed views

PageOn.ai's AI Blocks interface for creating MCP component diagrams
Comparative Analysis of Diagramming Tools
Comparison of key features across different MCP diagramming tools
Code-Driven vs. Visual Editing Approaches
Code-Driven Diagrams
Benefits:
- Version control friendly
- Programmatic generation from existing code
- Consistency across large system documentation
- Automation possibilities
Visual Editing Tools
Benefits:
- Intuitive drag-and-drop interfaces
- Immediate visual feedback
- Easier for non-technical stakeholders
- Often better for presentation quality
Developer Environment Integration
Modern MCP diagramming tools offer integration with popular development environments:
Cursor Integration
Cursor IDE provides direct integration with UML-MCP server, allowing developers to generate diagrams directly from their code:
- Highlight MCP component code and generate diagrams with keyboard shortcuts
- Live updates as code changes
- Diagram export directly from the IDE
For teams looking to discover existing MCP component patterns and examples, PageOn.ai's Deep Search functionality can locate relevant examples from a vast library of architectural patterns, saving significant design time and providing proven solutions.
With the right combination of tools tailored to your team's workflow, MCP component diagrams can be created efficiently while maintaining high quality and accuracy. AI-powered flowchart tools continue to evolve, making sophisticated diagram creation increasingly accessible.
Adding Interactivity to MCP Component Diagrams
Transforming static MCP diagrams into interactive visualizations dramatically enhances understanding, exploration, and engagement. Interactive elements allow users to navigate complex architectures, reveal additional details on demand, and visualize dynamic processes.
Levels of Diagram Interactivity
Progressive levels of interactivity in MCP component diagrams
Basic Interactivity
- Tooltips on hover
- Clickable links to documentation
- Simple zoom and pan
Intermediate Interactivity
- Collapsible/expandable sections
- Filtered views by component type
- Detail panels on click
Advanced Interactivity
- Animated data flows
- Live state visualization
- Interactive editing capabilities
Creating Clickable Component Details
One of the most valuable interactive features is the ability to click on diagram components to reveal additional details:
Interactive component with expanded details panel
Implementing clickable components typically involves:
- Defining click event handlers for diagram elements
- Creating a detail view component or panel
- Loading relevant component details on demand
- Animating the transition for a smooth user experience
Visualizing State Changes and Data Flow
Dynamic MCP diagrams can illustrate how data and control flow through the system. Interactive visualizations for data exploration techniques can be applied to show:
                    sequenceDiagram
                        participant User
                        participant RootAgent
                        participant SpecAgent1
                        participant SpecAgent2
                        participant Tool1

                        User->>RootAgent: Request information
                        Note over RootAgent: Process request
                        RootAgent->>SpecAgent1: Delegate task A
                        RootAgent->>SpecAgent2: Delegate task B
                        SpecAgent1->>Tool1: Call external API
                        Tool1-->>SpecAgent1: Return results
                        SpecAgent1-->>RootAgent: Report task A results
                        SpecAgent2-->>RootAgent: Report task B results
                        RootAgent-->>User: Synthesized response
Sequence diagram showing dynamic message flow between MCP components
Implementing Zoom and Focus Features
For complex MCP architectures, navigation capabilities are essential:
Zoom Controls
- Mouse wheel/pinch zoom gesture support
- Zoom in/out buttons
- Zoom to fit option
- Zoom percentage indicator
Focus Features
- "Focus mode" on selected components
- Temporarily hide unrelated components
- Breadcrumb navigation for nested views
- Quick return to overview
PageOn.ai's Vibe Creation for Interactive Experiences
PageOn.ai's Vibe Creation feature takes interactive MCP diagrams to the next level by:
- Automatically transforming static diagrams into interactive experiences
- Providing intuitive navigation controls for complex architectures
- Enabling custom animation sequences to illustrate processes
- Supporting multi-level drill-down for hierarchical MCP components
- Offering presentation mode for stakeholder demonstrations

PageOn.ai's Vibe Creation interface for building interactive MCP experiences
By implementing these interactive features, static MCP component diagrams transform into dynamic tools for exploration and understanding, significantly enhancing their value for both technical and non-technical stakeholders.
Practical Implementation Guide
Moving from theory to practice, this section provides a step-by-step guide for implementing interactive MCP component diagrams, from environment setup to creating sophisticated visualizations.
Setting Up Your Development Environment
Before creating MCP diagrams, establish a proper development environment:
Environment Setup Steps
Defining MCP Components Programmatically
Start by defining the core components of your MCP architecture:
Python Component Definition
Creating a Basic MCP Component Diagram
With components defined, you can generate a basic diagram:
Generating a Diagram
Basic MCP component diagram generated from Python code
Adding Interactive Elements
Transform the basic diagram into an interactive visualization:
Interactive Web Visualization
Debugging Visualizations
Create specialized views for debugging MCP communication:
Debug visualization for MCP communication flow with timing analysis
Leveraging PageOn.ai for Diagram Creation
PageOn.ai provides powerful tools to transform specifications into visual diagrams through its agentic capabilities:
- Upload your MCP architecture description document
- Use PageOn.ai's natural language interface to specify diagram requirements
- Review and refine the automatically generated component diagram
- Add interactive elements through PageOn.ai's visual editor
- Export the final diagram in multiple formats (SVG, HTML, PNG)
By following this implementation guide, you can create sophisticated MCP component diagrams that effectively communicate your architecture while providing interactive features for exploration and understanding. Whether you prefer a code-driven approach or visual editing tools like PageOn.ai, these techniques will help you build diagrams that enhance system comprehension for all stakeholders.
Real-World Applications and Case Studies
Interactive MCP component diagrams have proven invaluable in numerous real-world scenarios. This section explores practical applications and case studies that demonstrate their impact on development, debugging, and stakeholder communication.
Database Interaction Agent Visualization
A prominent use case for MCP component diagrams involves database interaction agents, where specialized LLM agents are tasked with generating SQL queries based on natural language input:
                    graph TB
                        User[User] --> |"Natural language query"| RootAgent[Root Agent]
                        RootAgent --> |"Delegates SQL generation"| SQLAgent[SQL Agent]
                        SQLAgent --> |"Generates"| SQLQuery[SQL Query]
                        SQLQuery --> |"Executes on"| Database[(Database)]
                        Database --> |"Results"| SQLAgent
                        SQLAgent --> |"Processed results"| RootAgent
                        RootAgent --> |"Natural language response"| User

                        subgraph MCP Framework
                        RootAgent
                        SQLAgent
                        end

                        classDef user fill:#66BB6A,stroke:#333,stroke-width:1px;
                        classDef agent fill:#FF8000,stroke:#333,stroke-width:1px;
                        classDef data fill:#42A5F5,stroke:#333,stroke-width:1px;
                        classDef storage fill:#AB47BC,stroke:#333,stroke-width:1px;

                        class User user;
                        class RootAgent,SQLAgent agent;
                        class SQLQuery data;
                        class Database storage;
MCP component diagram for a database interaction system using Agent-as-a-Tool pattern
In this implementation, the interactive diagram enables:
- Visualization of the complete query processing flow
- Inspection of actual message content at each step
- Performance analysis through timing annotations
- Identification of bottlenecks or error sources
Improving Architecture Understanding
Teams implementing complex MCP architectures have reported significant benefits from interactive diagrams:
Before Interactive Diagrams
- New team members took 3-4 weeks to understand system architecture
- Architecture decisions were difficult to communicate to stakeholders
- Documentation quickly became outdated or inconsistent
- Debugging required extensive code review to trace interactions
After Interactive Diagrams
- Onboarding time reduced to 1-2 weeks with interactive exploration
- Stakeholders could navigate and understand system at their preferred level of detail
- Diagrams generated from code maintained accuracy with implementation
- Visual debugging tools reduced troubleshooting time by 40%
Enhancing Agent Communication Debugging
For developers working with complex agent-to-agent interactions, visual data presentation through interactive MCP diagrams has transformed the debugging process:
Interactive debugging visualization for MCP message passing
Key debugging benefits include:
- Real-time visualization of message passing between agents
- Ability to inspect message content at any point in the flow
- Identification of stalled or failed interactions
- Performance profiling through timing visualizations
- Comparison of expected vs. actual communication patterns
PageOn.ai's Impact on MCP Visualization Workflows
Several development teams have reported significant workflow improvements after adopting PageOn.ai for MCP component visualization:
Development workflow improvements after PageOn.ai adoption
A leading AI research team reported: "PageOn.ai has transformed how we document and communicate our MCP architectures. What previously took days of manual diagramming now happens in hours, with interactive elements that make complex agent interactions comprehensible to everyone from engineers to executive stakeholders."
Before/After Case Study: Enterprise AI Team
A Fortune 500 enterprise AI team implementing a complex multi-agent system for customer service automation provides a compelling before/after case study:
Before Interactive MCP Diagrams
The team struggled with system complexity, resulting in:
- Multiple inconsistent architecture documents
- Difficult cross-team collaboration due to misunderstandings
- Extended debugging sessions to trace interaction issues
- Challenges explaining system behavior to business stakeholders
After Interactive MCP Diagrams
After implementing interactive MCP component diagrams using PageOn.ai:
- Single source of truth for architecture visualization
- 50% reduction in cross-team misunderstandings
- Debugging time reduced by 40% through visual tracing
- Business stakeholders able to understand and provide meaningful feedback
- New feature planning accelerated through visual prototyping
These real-world applications demonstrate that interactive MCP component diagrams deliver substantial value across the entire development lifecycle, from initial architecture design to ongoing maintenance and debugging. By leveraging tools like PageOn.ai, teams can create rich, interactive visualizations that enhance understanding, accelerate development, and improve communication across diverse stakeholder groups.
Best Practices and Future Trends
As MCP architectures continue to evolve, establishing best practices for component visualization becomes increasingly important. This section outlines key guidelines for creating effective diagrams and explores emerging trends in interactive system representation.
Guidelines for Diagram Clarity and Usability
Visual Design Principles
- Consistency: Use uniform visual language throughout diagrams
- Hierarchy: Clearly communicate importance through size and placement
- Proximity: Group related components visually
- Contrast: Make different component types easily distinguishable
- Simplicity: Include only necessary information at each level
Interactive Feature Guidelines
- Discoverability: Make interactive elements obvious
- Responsiveness: Provide immediate feedback on interaction
- Progressive Disclosure: Reveal details only when needed
- Navigation: Allow easy movement between detail levels
- History: Support back/forward navigation
Standardized Approaches to MCP Visualization
Industry standardization is emerging around these key practices:
Component Representation
- Root agents as hexagons
- Specialized agents as rounded rectangles
- Tools as circles or squares
- User interfaces as pentagons
- Consistent color coding by component type
Connection Semantics
- Solid lines for synchronous calls
- Dashed lines for asynchronous messages
- Dotted lines for event subscriptions
- Arrow direction indicating initiator
- Line thickness for frequency or importance
Interactivity Standards
- Click to expand/see details
- Hover for basic information
- Drag to rearrange (where appropriate)
- Double-click to focus
- Consistent zoom controls
Emerging Trends in Interactive Architecture Representation
Emerging trends in 3D and AR/VR for MCP architecture visualization
Several innovative approaches are reshaping how we visualize MCP architectures:
- 3D Visualization: Moving beyond 2D diagrams to allow exploration of complex architectures in three dimensions
- VR/AR Integration: Immersive environments for collaborative architecture exploration and design
- Real-time System Monitoring: Live diagrams that reflect the current state of deployed systems
- AI-driven Layout Optimization: Automatic arrangement of components for maximum clarity
- Natural Language Interfaces: Creating and modifying diagrams through conversational commands
The Impact of AI-driven Diagramming Tools
AI-driven tools like PageOn.ai are fundamentally changing how MCP diagrams are created and used:
Impact of AI-driven tools on MCP diagram creation processes
PageOn.ai's Continuous Innovation
PageOn.ai continues to shape the future of MCP component visualization through ongoing innovation:
- Natural Language Diagram Generation: Creating complex diagrams from simple text descriptions
- Intelligent Layout Algorithms: Optimizing component placement for maximum clarity
- Adaptive Detail Levels: Automatically adjusting information density based on viewing context
- Cross-platform Collaboration: Real-time multi-user editing and viewing of diagrams
- Integration Capabilities: Connecting with development environments and code repositories
As MCP architectures become increasingly sophisticated, the tools and techniques for visualizing them will continue to evolve. By embracing these best practices and staying attuned to emerging trends, developers and architects can create interactive diagrams that effectively communicate system structure and behavior, enhancing understanding across technical and non-technical audiences alike.
Transform Your MCP Visualizations with PageOn.ai
Ready to create stunning, interactive MCP component diagrams that instantly communicate complex architectures? PageOn.ai combines powerful visualization tools with AI assistance to help you build diagrams that enhance understanding and accelerate development.
Start Creating with PageOn.ai TodayYou Might Also Like
How to Design Science Lesson Plans That Captivate Students
Create science lesson plans that captivate students with hands-on activities, clear objectives, and real-world applications to foster curiosity and critical thinking.
How to Write a Scientific Review Article Step by Step
Learn how to write a review article in science step by step. Define research questions, synthesize findings, and structure your article for clarity and impact.
How to Write a Self-Performance Review with Practical Examples
Learn how to write a self-performance review with examples and tips. Use an employee performance review work self evaluation sample essay to guide your process.
How to Write a Spec Sheet Like a Pro? [+Templates]
Learn how to create a professional spec sheet with key components, step-by-step guidance, and free templates to ensure clarity and accuracy.