Creating Effective Visual AI Risk Assessment Frameworks
A Comprehensive Guide for Modern Organizations
Transform your organization's approach to AI governance with powerful visual frameworks that make risk assessment intuitive, actionable, and effective.
Understanding the Foundation of AI Risk Frameworks
Before diving into visualization techniques, it's crucial to establish a solid understanding of what constitutes an effective AI risk management framework. Organizations implementing AI solutions need a structured approach that aligns with established standards while addressing their unique needs.
Core Components of AI Risk Management
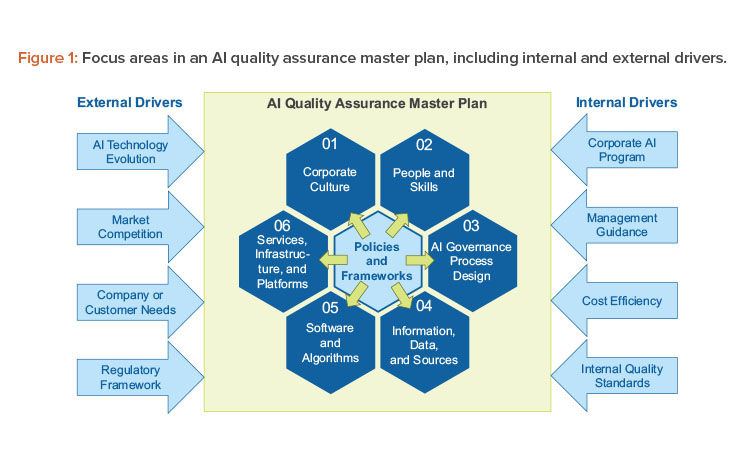
Industry standards like the NIST AI Risk Management Framework provide valuable starting points that can be customized to your organization's context. According to cybersecurity experts, the most effective frameworks incorporate these essential elements:
Core Components of an AI Risk Framework
Key Stakeholders in AI Risk Assessment
Successful AI risk management requires engagement across organizational levels. Each stakeholder group brings different perspectives that contribute to comprehensive risk identification and mitigation:
flowchart TD
    A[Board & Executive Leadership] --- B[Risk & Compliance Teams]
    A --- C[Data Science & AI Teams]
    A --- D[Business Unit Owners]

    B --- E[Policy Development]
    B --- F[Compliance Monitoring]

    C --- G[Technical Implementation]
    C --- H[Model Monitoring]

    D --- I[User Feedback]
    D --- J[Business Impact]

    style A fill:#FF8000,color:white
    style B fill:#42A5F5,color:white
    style C fill:#42A5F5,color:white
    style D fill:#42A5F5,color:white
The Power of Visual Representation
Transforming abstract risk concepts into visual formats makes complex information more accessible and actionable. Visual AI tools can help organizations create intuitive dashboards, flowcharts, and matrices that communicate critical AI risk information effectively.
Framework Objectives: Before designing your visual framework, clearly define what it needs to accomplish. Is it primarily for regulatory compliance, technical team guidance, executive decision-making, or all of these? The visualization approach should align with these specific objectives.
Conducting a Comprehensive AI Risk Identification Process
Effective AI risk management begins with thorough identification of potential risks across multiple dimensions. Creating structured visual approaches to categorizing these risks helps ensure nothing critical is overlooked.
Categorized Risk Identification Framework
Technical Risks
- Performance degradation over time
- Model drift and data quality issues
- Scalability constraints
- Integration failures with existing systems
- Reliability under varying conditions
Ethical Considerations
- Algorithmic bias and fairness issues
- Lack of transparency in decision-making
- Privacy concerns and data consent
- Social impact of automated decisions
- Accessibility and inclusivity problems
Compliance & Regulatory
- Data protection regulations (GDPR, CCPA)
- Industry-specific compliance requirements
- Documentation and auditing obligations
- Cross-border data transfer issues
- Emerging AI-specific regulations
Security Vulnerabilities
- Adversarial attacks targeting models
- Data poisoning during training phases
- Model extraction or theft attempts
- API vulnerabilities in AI services
- Unauthorized access to sensitive models
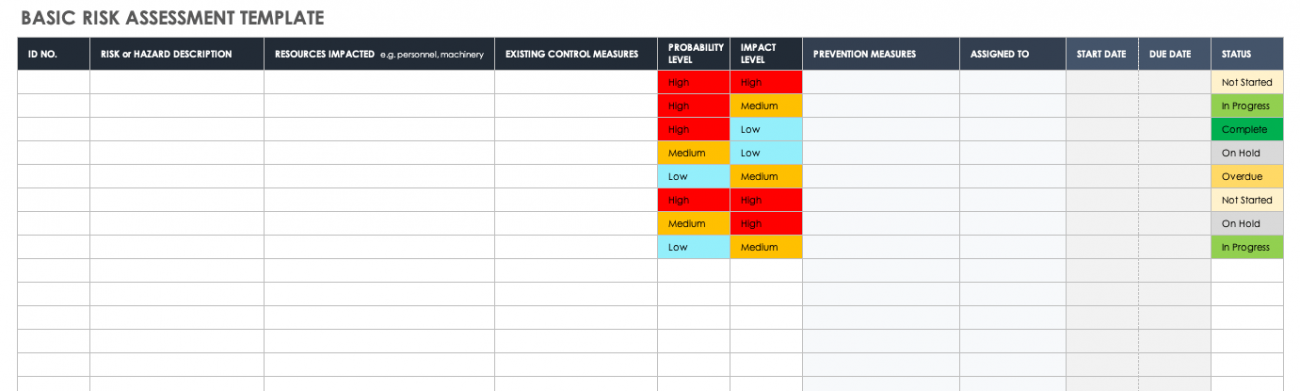
Visual Risk Heat Maps
After identifying potential risks, visualizing their relative likelihood and impact helps prioritize mitigation efforts. Heat maps provide an intuitive way to understand risk severity and focus resources appropriately.
AI Risk Heat Map Example
Customizing Your Risk Assessment Approach
Standard frameworks provide an excellent foundation, but customization is essential to reflect your organization's unique context and risk appetite. AI mind mapping tools can help visualize relationships between different risk elements in your customized framework.
flowchart LR
    A[Standard Framework] --> B[Organizational Context]
    A --> C[Industry Factors]
    A --> D[Technical Environment]

    B --> E[Customized Framework]
    C --> E
    D --> E

    E --> F[Tailored Risk Controls]
    E --> G[Custom Documentation]
    E --> H[Adapted Metrics]

    style A fill:#FF8000,color:white
    style E fill:#FF8000,color:white
Risk Taxonomy Tip: Develop consistent visual codes for risk categories across your organization. Using consistent colors, icons, and labels ensures that risk visuals are immediately understood by all stakeholders regardless of their department or technical background.
Building Visual Components for Your AI Risk Framework
Converting risk information into compelling visuals makes complex data more accessible and actionable. The right visual components transform abstract risks into tangible concepts that stakeholders can readily understand and address.
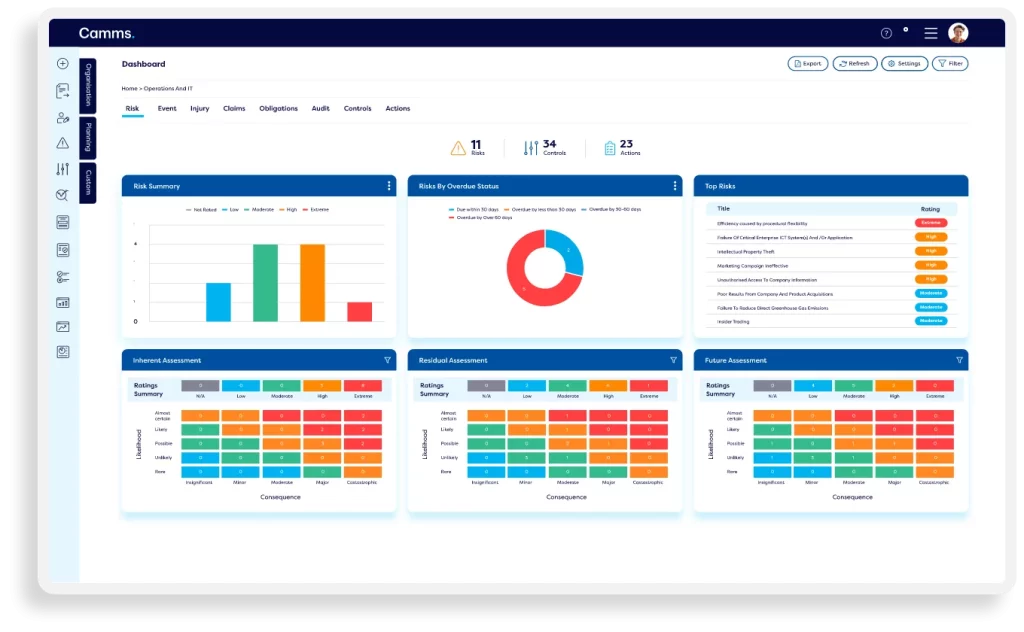
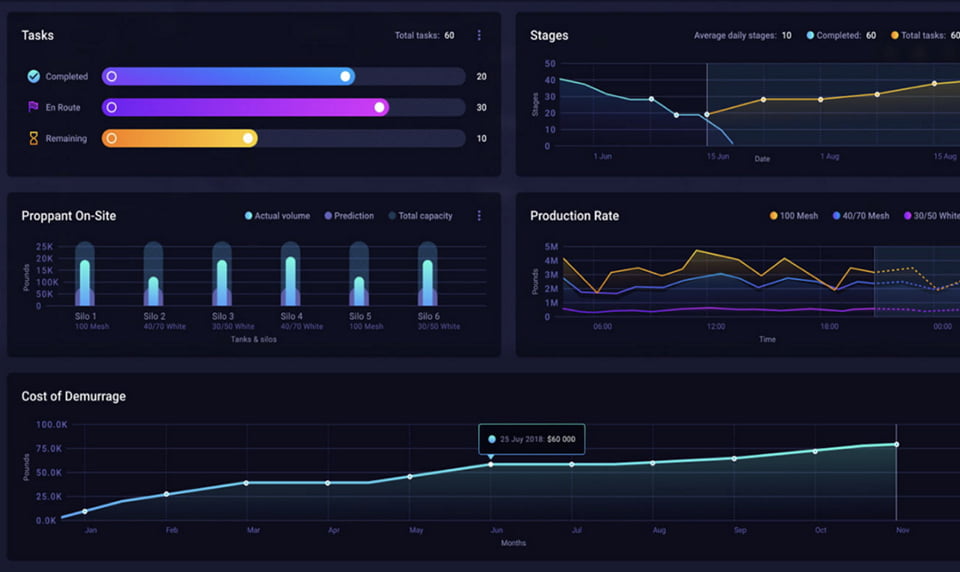
Essential Dashboard Elements
Effective AI risk dashboards combine multiple visual elements to provide a comprehensive view of your risk landscape. AI block diagram whiteboards can help you design intuitive layouts that communicate critical information at a glance.
Risk Trend Indicators
Visual indicators showing risk metric changes over time, with thresholds and trend lines to highlight emerging issues before they become critical.
Risk Register Status
Visual representation of your risk register showing status, ownership, and progress of mitigation actions across all identified AI risks.
Alert Visualizations
Real-time visual alerts showing when risk indicators exceed acceptable thresholds, with color-coding for severity and prioritization.
Effective Visual Risk Communication Tools
Different stakeholders need different visual representations. Creating audience-specific views ensures everyone gets the information they need in the most digestible format.
| Stakeholder Group | Visual Format | Key Content Focus | Update Frequency |
|---|---|---|---|
| Executive Leadership | High-level dashboards with KPI summaries | Organizational risk profile, strategic impacts, compliance status | Monthly + on-demand |
| Risk & Compliance Teams | Detailed risk registers with filtering capabilities | Comprehensive risk documentation, control effectiveness, audit trails | Weekly + real-time alerts |
| AI Development Teams | Technical risk metrics with threshold indicators | Model performance, data quality issues, technical vulnerabilities | Daily + automated alerts |
| Business Unit Owners | Impact-focused visuals aligned to business objectives | Business impact of risks, customer-facing issues, operational concerns | Bi-weekly + incident-based |
flowchart TD
A[Risk Identification] --> B[Risk Analysis]
B --> C[Risk Evaluation]
C --> D[Risk Treatment]
D --> E[Monitoring & Review]
E --> A
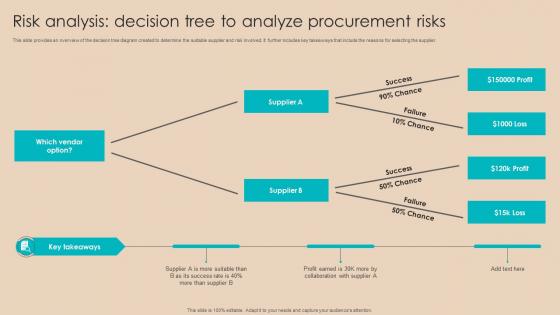
B --- F[Visual Heat Maps]
C --- G[Decision Trees]
D --- H[Action Dashboards]
E --- I[Trend Visualizations]
style A fill:#FF8000,color:white
style B fill:#FF8000,color:white
style C fill:#FF8000,color:white
style D fill:#FF8000,color:white
style E fill:#FF8000,color:white
PageOn.ai Insight: Using PageOn.ai's AI Blocks feature, teams can rapidly create modular risk visualizations that can be combined into comprehensive dashboards. This allows for consistent visual elements across different presentations while enabling customization for different audiences.
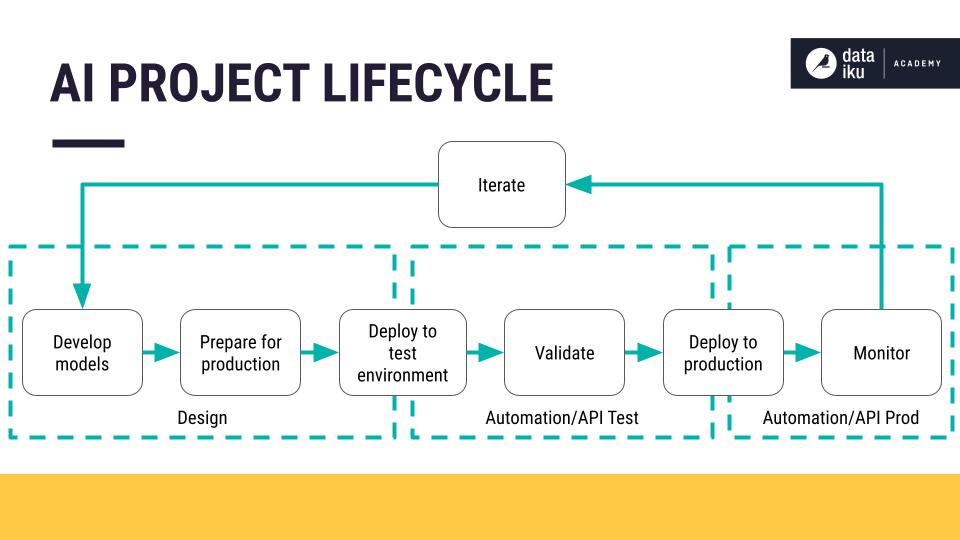
Integrating Risk Assessment with AI Development Lifecycle
For maximum effectiveness, visual risk assessment must be integrated throughout the AI development lifecycle rather than treated as a separate compliance exercise. This integration ensures risks are addressed proactively at every stage.
AI Development Lifecycle with Risk Checkpoints
flowchart LR
    A[Problem Definition] --> B[Data Collection]
    B --> C[Model Development]
    C --> D[Testing & Validation]
    D --> E[Deployment]
    E --> F[Monitoring]
    F --> |Feedback Loop| A

    A --- A1[Risk Checkpoint]
    B --- B1[Risk Checkpoint]
    C --- C1[Risk Checkpoint]
    D --- D1[Risk Checkpoint]
    E --- E1[Risk Checkpoint]
    F --- F1[Risk Checkpoint]

    subgraph Risk Assessment Activities
        A1
        B1
        C1
        D1
        E1
        F1
    end

    style A fill:#42A5F5,color:white
    style B fill:#42A5F5,color:white
    style C fill:#42A5F5,color:white
    style D fill:#42A5F5,color:white
    style E fill:#42A5F5,color:white
    style F fill:#42A5F5,color:white

    style A1 fill:#FF8000,color:white
    style B1 fill:#FF8000,color:white
    style C1 fill:#FF8000,color:white
    style D1 fill:#FF8000,color:white
    style E1 fill:#FF8000,color:white
    style F1 fill:#FF8000,color:white
Creating clear visual documentation of risk assessment activities at each development phase helps ensure nothing is overlooked. AI-powered organizational charts can help visualize responsibility assignments and workflows for risk-related activities.
Problem Definition Phase Checkpoint
- Visual Tool: Problem statement risk radar diagram
- Key Questions: Does the AI use case involve high-risk decisions? Are stakeholder impacts visualized?
- Documentation: Initial risk assessment diagram with category identification
- Approval Process: Visual decision tree for determining appropriate governance level
Data Collection Phase Checkpoint
- Visual Tool: Data lineage and quality dashboard
- Key Questions: Are data biases visualized and quantified? Is data provenance tracked?
- Documentation: Visual data quality metrics with risk thresholds
- Approval Process: Data risk assessment matrix with mitigation status
Visual Maturity Model for AI Risk Management
Tracking your organization's progress in AI risk management capabilities helps identify improvement areas and measure advancement over time.
AI Risk Management Maturity Model
Integration Tip: Create visual "gates" at each development phase that clearly show what risk assessment activities must be completed before proceeding. This visual approach helps development teams incorporate risk thinking naturally into their workflow rather than seeing it as a separate compliance burden.
Implementing Continuous Monitoring Through Visual Indicators
AI systems evolve over time, and so do associated risks. Effective visual monitoring frameworks help organizations track risk metrics continuously and respond proactively to emerging issues.
Key Monitoring Components
1 Visual KPIs and Metrics
Design clear, visual key performance indicators that track critical risk factors across your AI systems. These should include:
- Model performance drift indicators
- Data quality visual metrics
- Fairness and bias monitoring dashboards
- Security vulnerability tracking visuals
- Compliance status indicators
2 Trend Analysis Visualizations
Create visual dashboards that track risk metrics over time, enabling the detection of emerging patterns:
- Time-series visualizations of key risk indicators
- Anomaly detection with visual highlighting
- Comparative analysis against baseline metrics
- Correlation visualizations between different risk factors
- Seasonal pattern identification in risk metrics
Risk Metric Trend Visualization
3 Visual Alert Systems
Implement visual alerting mechanisms that trigger when risk thresholds are exceeded:
- Color-coded status indicators (green/yellow/red)
- Visual notifications for stakeholders
- Threshold violation trackers with visual history
- Impact visualization of threshold exceedances
- Automated risk escalation workflow visualizations
4 Audience-Specific Reporting
Design visual reporting frameworks tailored to different stakeholder needs:
- Executive-level dashboard with high-level risk summaries
- Technical team visualizations with detailed metrics
- Compliance reporting with regulation-specific visuals
- Business impact visualizations for operational teams
- Customizable views with relevant risk categories for each group
PageOn.ai Integration: PageOn.ai's dashboard creation tools allow organizations to design interactive, real-time monitoring visualizations that automatically update as new risk data becomes available. These dynamic visuals ensure stakeholders always have the most current risk information available for decision-making.
From Assessment to Action: Visualizing Mitigation Strategies
Effective risk management doesn't stop at assessment—it requires clear, actionable mitigation plans. Visual frameworks for mitigation strategies help organizations prioritize resources and track progress toward risk reduction.
Visual Action Plans
Creating visual action plans helps teams understand the direct connection between identified risks and their mitigation strategies. AI background for presentations can enhance the visual impact of these mitigation plans when communicating with stakeholders.
flowchart TB
    A[Identified Risk] --> B{Risk Assessment}
    B --> C[High Priority]
    B --> D[Medium Priority]
    B --> E[Low Priority]

    C --> F[Immediate Action]
    D --> G[Planned Action]
    E --> H[Monitoring Only]

    F --> I[Assigned Owner]
    F --> J[Resource Allocation]
    F --> K[Timeline]
    F --> L[Success Criteria]

    style A fill:#FF8000,color:white
    style B fill:#FF8000,color:white
    style C fill:#FF8000,color:white
Resource Allocation Visualization
Optimizing resource allocation for risk mitigation requires clear visualization of how efforts are distributed across different risk categories and priorities:
Timeline-based Roadmap
Visual roadmaps help teams understand the sequence and timing of risk mitigation initiatives, showing dependencies and critical path activities:
gantt
    title Risk Mitigation Timeline
    dateFormat  YYYY-MM-DD

    section Technical
    Model Documentation      :a1, 2023-06-01, 30d
    Performance Monitoring   :a2, after a1, 45d
    Drift Detection          :a3, after a2, 30d

    section Ethical
    Bias Assessment          :b1, 2023-06-15, 45d
    Fairness Controls        :b2, after b1, 30d

    section Compliance
    Policy Development       :c1, 2023-06-01, 60d
    Audit Preparation        :c2, after c1, 30d

    section Security
    Penetration Testing      :d1, 2023-07-01, 30d
    Remediation              :d2, after d1, 45d
Decision-Support Visualizations
Visual decision-support tools help teams evaluate the effectiveness of different control options and select the most appropriate mitigation approaches:
Control Effectiveness Comparison
Scenario Planning Tip: Create visual scenario analyses that show how different mitigation strategies would impact overall risk levels. This approach helps stakeholders understand trade-offs between different options and supports more informed decision-making.

Case Studies: Successful Visual AI Risk Frameworks in Action
Examining real-world implementations helps understand what makes visual risk frameworks successful in practice. These case studies highlight different approaches across industries.
Financial Services: Visualizing ML Model Risk
A major financial institution implemented a comprehensive visual risk framework for their AI-powered credit decision systems. The visual approach transformed how they managed model risk:
Challenge
The organization struggled with communicating complex model risks across technical teams, compliance officers, and business executives. Each stakeholder needed different information but lacked a unified risk picture.
Solution
They developed a multi-layered visual dashboard with audience-specific views that allowed stakeholders to:
- Track model performance drift with clear visual indicators
- Visualize fairness metrics across different demographic groups
- Monitor compliance status with regulatory requirements
- View risk trends over time with threshold alerts
Results
After implementing the visual framework, the organization saw:
- 85% reduction in time spent explaining risk status to executives
- 47% increase in early risk factor identification
- Successful regulatory examinations with positive feedback on transparency
- Improved cross-functional collaboration on risk mitigation
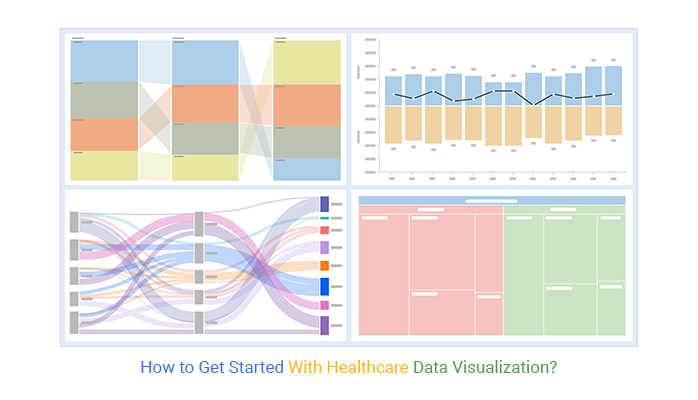
Healthcare: Visualizing Patient Impact Risk
A healthcare provider implementing AI for diagnostic assistance created a visual risk framework focused on patient safety and clinical outcomes:
Before Implementation
- Text-heavy risk reports
- Siloed risk information
- Delayed issue identification
- Low stakeholder engagement
Transformation Process
- Data structure standardization
- Stakeholder need analysis
- Visual prototype development
- Clinical validation process
After Implementation

- Real-time risk visualization
- Clinical context integration
- Automated threshold alerts
- Role-specific risk views
Key Learnings
- Clinical Context is Critical: Visual risk frameworks in healthcare must incorporate relevant clinical context to be meaningful to medical professionals.
- Real-Time is Essential: Patient safety demands immediate risk visibility, making real-time visual dashboards particularly valuable.
- Explainability Through Visualization: Complex model decisions were made more transparent through visual explanation tools.
- Regulatory Documentation: Visual documentation of risk controls significantly streamlined regulatory compliance.
Implementation Insight: Organizations that successfully implemented visual AI risk frameworks typically started with a limited pilot focused on their highest-priority risks. This allowed them to refine their visualization approach before scaling to a comprehensive framework.
Future-Proofing Your Visual Risk Assessment Framework
AI technology and related regulations are evolving rapidly. Building adaptability into your visual risk framework ensures it remains effective as the landscape changes.
Designing for Adaptability
flowchart TD
    A[Core Framework] --> B[Modular Components]
    A --> C[Extensible Categories]
    A --> D[Scalable Metrics]

    B --> E[Technical Module]
    B --> F[Ethical Module]
    B --> G[Compliance Module]
    B --> H[Security Module]
    B --> I[Future Modules...]

    C --> J[New Risk Categories]
    D --> K[Emerging Metrics]

    style A fill:#FF8000,color:white
    style B fill:#42A5F5,color:white
    style C fill:#42A5F5,color:white
    style D fill:#42A5F5,color:white
    style I fill:#66BB6A,color:white
    style J fill:#66BB6A,color:white
    style K fill:#66BB6A,color:white
Creating modular visual components allows your framework to adapt to new requirements without complete redesign. PageOn.ai's visualization tools support this modular approach, making it easier to incorporate new elements as needs evolve.
Anticipating Regulatory Changes
As AI regulations mature globally, your visual framework needs built-in flexibility:
- Create regulation-specific visual overlays that can be activated as needed
- Design compliance mapping visualizations that link controls to specific regulatory requirements
- Build visual policy trackers that monitor regulatory developments
- Develop visual impact assessments for proposed regulations
- Create scenario visualizations for different regulatory outcomes
Monitoring Technological Shifts
Visual indicators can help track emerging technologies that may introduce new risks:
- Technology radar visualizations for AI innovation monitoring
- Risk exposure heat maps for new algorithmic approaches
- Capability-gap visualizations for emerging threats
- Comparative risk visualizations between existing and new technologies
- Timeline-based visuals for technology adaptation planning
Scenario Planning for Future Risk Landscapes
Visualizing potential future scenarios helps organizations prepare for emerging risks before they materialize:
Future AI Risk Scenario Planning
Framework Evolution Planning: Schedule regular reviews of your visual risk framework to assess its continued effectiveness. Create a visual roadmap for framework evolution that aligns with both your organization's AI strategy and the broader industry risk landscape.
Ensuring Visual Relevance and Effectiveness
As frameworks evolve, it's essential to maintain the effectiveness of your visualizations:
- User Feedback Loops: Implement mechanisms to collect stakeholder input on visualization effectiveness
- Usability Testing: Regularly test visualizations with actual users to ensure they remain intuitive
- Data-to-Visualization Ratio: Monitor the information density of visualizations to prevent overloading
- Visual Consistency: Maintain design standards even as new elements are added
- Accessibility Review: Ensure visualizations remain accessible to all users, including those with visual impairments
Transform Your AI Risk Management with PageOn.ai
Take your organization's approach to AI governance to the next level with intuitive, powerful visualization tools that make complex risk concepts clear and actionable for all stakeholders.
Conclusion: The Power of Visual AI Risk Frameworks
Effective AI governance requires more than just robust policies—it demands clear communication and shared understanding across diverse stakeholders. Visual risk frameworks transform abstract concepts into tangible, actionable insights that drive better decision-making and more responsible AI implementation.
By following the approaches outlined in this guide, your organization can create visual frameworks that:
- Make complex AI risks comprehensible to all stakeholders
- Enable faster, more informed decision-making about risk mitigation
- Create consistent understanding across technical and non-technical teams
- Support regulatory compliance with clear documentation
- Adapt to evolving AI technologies and regulatory requirements
With tools like PageOn.ai, organizations can rapidly create professional, interactive visualizations that bring their AI risk frameworks to life—transforming risk management from a compliance burden into a strategic advantage for responsible AI innovation.
You Might Also Like
How to Design Science Lesson Plans That Captivate Students
Create science lesson plans that captivate students with hands-on activities, clear objectives, and real-world applications to foster curiosity and critical thinking.
How to Write a Scientific Review Article Step by Step
Learn how to write a review article in science step by step. Define research questions, synthesize findings, and structure your article for clarity and impact.
How to Write a Self-Performance Review with Practical Examples
Learn how to write a self-performance review with examples and tips. Use an employee performance review work self evaluation sample essay to guide your process.
How to Write a Spec Sheet Like a Pro? [+Templates]
Learn how to create a professional spec sheet with key components, step-by-step guidance, and free templates to ensure clarity and accuracy.