Demystifying Data Flow Visualization in Model Context Protocol Systems
A Practical Guide to Creating Clear and Effective MCP Visualizations
The Model Context Protocol (MCP) offers a standardized way for AI systems to interact with external data sources and tools. This guide explores practical techniques for visualizing these complex relationships, making technical protocols more accessible through effective visual representation.
Understanding Model Context Protocol Fundamentals
The Model Context Protocol (MCP) has emerged as what Anthropic describes as the "USB-C for AI applications" – a universal connector that standardizes how AI models interact with external resources. This elegant metaphor captures the essence of MCP's purpose: providing a consistent interface through which AI systems can access a variety of data sources and tools.
                        flowchart TB
                            User[User Query] --> MCP[Model Context Protocol]
                            subgraph Protocol
                                MCP --> Interface[Standardized Interface]
                                Interface --- Auth[Authentication]
                                Interface --- Format[Data Formatting]
                                Interface --- Context[Context Management]
                            end
                            Interface --> DB[(Databases)]
                            Interface --> API[External APIs]
                            Interface --> Tools[Custom Tools]
                            Interface --> Files[File Systems]
                            DB & API & Tools & Files --> Response[Response Generation]
                            Response --> User

                            classDef primary fill:#FF8000,stroke:#FF8000,color:white
                            classDef secondary fill:#FFF3E0,stroke:#FF8000,color:#333
                            classDef tertiary fill:#FFFFFF,stroke:#A0A0A0,color:#333

                            class MCP,Interface primary
                            class Auth,Format,Context secondary
                            class DB,API,Tools,Files,Response,User tertiary
Figure 1: A comprehensive overview of MCP's function as a universal connector for AI system interactions
Key Components of MCP Architecture
MCP's architecture consists of several interrelated components that work together to enable seamless AI interactions. These components include standardized request/response formats, context management mechanisms, and integration interfaces that allow AI models to maintain consistent interaction patterns across diverse data sources.
Figure 2: Core components that make up the MCP architecture and their relative importance
Evolution from Traditional AI Pipelines
Before MCP, AI systems relied on custom integrations for each data source or tool they needed to access. This approach created brittle, hard-to-maintain architectures that required significant engineering resources to expand or modify. With MCP, AI developers can adopt a consistent pattern for external resource access, dramatically simplifying system design and maintenance.
                        flowchart LR
                            subgraph "Traditional Approach"
                            A1[AI Model 1] --> C1[Custom Integration 1]
                            A1 --> C2[Custom Integration 2]
                            A2[AI Model 2] --> C3[Custom Integration 3]
                            A2 --> C4[Custom Integration 4]
                            end

                            subgraph "MCP Approach"
                            B1[AI Model 1] --> MCP[Model Context Protocol]
                            B2[AI Model 2] --> MCP
                            MCP --> T1[Tool 1]
                            MCP --> T2[Tool 2]
                            MCP --> T3[Tool 3]
                            MCP --> T4[Tool 4]
                            end

                            classDef traditional fill:#FFC9C9,stroke:#FF6B6B,color:#333
                            classDef mcp fill:#C9E5FF,stroke:#3B82F6,color:#333
                            classDef mcpCore fill:#FF8000,stroke:#FF8000,color:white

                            class A1,A2,C1,C2,C3,C4 traditional
                            class B1,B2,T1,T2,T3,T4 mcp
                            class MCP mcpCore
Figure 3: Comparison between traditional AI integration approach and MCP standardization
Benefits of Standardization
The standardization that MCP provides offers numerous advantages including:
- Reduced integration complexity - developers only need to learn one protocol
- Improved maintainability - consistent patterns across all integrations
- Enhanced portability - AI systems can easily switch between different underlying models
- Accelerated development - teams can reuse integration components
- Simplified debugging - standardized error handling and logging
Looking at flowchart symbols can help in understanding how to properly document these MCP relationships. By standardizing both the protocol itself and its visual representation, teams can communicate more effectively about system architecture and data flow.
The Anatomy of Data Flow in MCP Systems
Understanding how data actually flows through an MCP system is essential for effective visualization. The protocol creates standardized pathways for information to travel between AI models and various external resources, maintaining context and ensuring secure, efficient data exchange.
                        flowchart TD
                            U[User] -->|1. Query| I[Input Processing]
                            I -->|2. Request| MCPI[MCP Interface]

                            subgraph "MCP Core Processing"
                            MCPI -->|3. Authentication| Auth[Authentication]
                            Auth -->|4. Validated Request| CTX[Context Management]
                            CTX -->|5. Contextualized Request| RT[Request Transformation]
                            RT -->|6. Formatted Request| RP[Routing Processor]
                            end

                            RP -->|7a. Database Query| DB[(Database)]
                            RP -->|7b. API Call| API[External API]
                            RP -->|7c. Tool Execution| Tool[Internal Tool]

                            DB -->|8a. Data Results| DT[Data Transformation]
                            API -->|8b. API Response| DT
                            Tool -->|8c. Tool Output| DT

                            DT -->|9. Processed Results| CTX2[Context Update]
                            CTX2 -->|10. Enriched Context| RG[Response Generation]
                            RG -->|11. Formatted Response| U

                            classDef user fill:#FFEBCC,stroke:#FF8000,color:#333
                            classDef core fill:#FF8000,stroke:#FF8000,color:white
                            classDef processing fill:#FFF3E0,stroke:#FF8000,color:#333
                            classDef external fill:#E0F7FA,stroke:#00ACC1,color:#333

                            class U user
                            class MCPI,CTX,CTX2 core
                            class I,Auth,RT,RP,DT,RG processing
                            class DB,API,Tool external
Figure 4: Detailed data flow through an MCP system showing request and response pathways
Input/Output Mechanisms
MCP standardizes the input and output formats across different AI models and tools. This creates a consistent interface that makes it easier to swap components or add new capabilities without disrupting existing workflows.
Key Insight: The standardized IO mechanisms in MCP are analogous to how USB-C provides a universal hardware interface. Just as USB-C eliminates the need for different cable types, MCP eliminates the need for custom data exchange formats between AI components.
Key Interface Points
Several critical interface points exist within MCP systems where data undergoes transformation:
Model-Protocol Interface
Where AI models package requests in MCP format and interpret responses
Protocol-Tool Interface
Where MCP translates standardized requests into tool-specific formats
Context Management Interface
Where conversation history and session state are maintained
Authentication Interface
Where security credentials are validated before data access
Security Considerations
MCP includes robust security mechanisms to ensure that data flows securely between systems. These include:
- Authentication protocols - Verifying the identity of requesting systems
- Authorization controls - Determining what data each system can access
- Encryption standards - Protecting data in transit between components
- Audit logging - Recording access patterns for security analysis
Data Type Handling
One of MCP's strengths is its ability to handle diverse data types while maintaining contextual relevance. The protocol includes specification for:
Figure 5: Common data types processed through MCP systems and their relative complexity
Creating interactive visualizations for data exploration can greatly enhance understanding of how these different data types flow through MCP systems, helping developers and stakeholders better grasp the complex interactions.
Visualization Techniques for MCP Data Flow
The complex nature of MCP systems requires thoughtful visualization approaches to make their operation comprehensible. By selecting appropriate visualization methods, you can create clear representations of data flow that highlight the essential aspects of these systems.
Selecting Visualization Methods
Different aspects of MCP systems benefit from different visualization techniques. The complexity level of what you're trying to represent should guide your choice of visualization method.
| Complexity Level | Recommended Visualization | Best For |
|---|---|---|
| Low | Simple flowcharts | Basic linear processes, high-level overviews |
| Medium | Swim lane diagrams | Processes involving multiple components or actors |
| High | UML sequence diagrams | Detailed interactions between system components |
| Very High | Interactive visualizations | Complex systems with multiple layers or states |

Figure 6: Comparison of different visualization techniques for MCP data flow
Creating Intuitive Flowcharts
Flowcharts remain one of the most effective ways to visualize MCP data flow. PageOn.ai's AI Blocks feature provides a powerful tool for creating these visualizations, allowing you to represent complex protocol interactions in an intuitive way.
                        flowchart TB
                            Start([Start Request]) --> Parse[Parse User Intent]
                            Parse --> Decision{Need External Data?}
                            Decision -->|Yes| MCP[Apply MCP Protocol]
                            Decision -->|No| Direct[Direct Response]

                            MCP --> Auth[Authentication]
                            MCP --> Format[Format Request]

                            subgraph "MCP Operations"
                                Auth --> Validate[Validate Credentials]
                                Validate --> Connect[Establish Connection]
                                Format --> Transform[Transform to Target Format]
                                Transform --> Query[Execute Query/Call]
                                Connect --> Query
                                Query --> Result[Process Results]
                                Result --> Reformat[Reformat for LLM]
                            end

                            Reformat --> Integrate[Integrate with Context]
                            Direct --> Integrate
                            Integrate --> Generate[Generate Response]
                            Generate --> End([End Request])

                            classDef orange fill:#FF8000,stroke:#FF8000,color:white
                            classDef blue fill:#E0F7FA,stroke:#00ACC1,color:#333
                            classDef green fill:#E8F5E9,stroke:#4CAF50,color:#333

                            class Start,End blue
                            class MCP,Auth,Format orange
                            class Validate,Connect,Transform,Query,Result,Reformat green
Figure 7: Intuitive flowchart of MCP request processing created using PageOn.ai's AI Blocks functionality
When creating flowcharts for MCP systems, consider these best practices:
- Use consistent shapes for similar components (e.g., rectangles for processes, diamonds for decisions)
- Apply color coding to distinguish between different categories of operations
- Group related operations using subgraphs or containers
- Label flows clearly to indicate what data or control is being passed
- Include start and end points to provide clear boundaries
Exploring flowchart examples can provide inspiration for effectively visualizing your own MCP implementations.
Visualizing Concurrent Processes
MCP systems often involve multiple concurrent processes. These parallel data streams can be challenging to represent clearly, but several techniques can help:
                        sequenceDiagram
                            participant U as User
                            participant A as AI Model
                            participant M as MCP Layer
                            participant D as Database
                            participant P as PDF Tool
                            participant I as Image Generator

                            U->>A: Ask complex question
                            A->>M: Request contextual data

                            par Database Query
                                M->>D: Query relevant records
                                D-->>M: Return structured data
                            and Document Processing
                                M->>P: Request document analysis
                                P-->>M: Return document insights
                            and Image Creation
                                M->>I: Request visualization
                                I-->>M: Return generated image
                            end

                            M-->>A: Provide integrated results
                            A->>U: Deliver comprehensive answer
Figure 8: Sequence diagram showing concurrent MCP operations for a complex user query
Color-Coding and Visual Hierarchy
Effective use of color and visual hierarchy can dramatically improve the clarity of MCP flow visualizations:
Figure 9: Effectiveness of different color-coding strategies for MCP visualization
Displaying Temporal Aspects
MCP data flow often has important temporal dimensions that need to be visualized:
Figure 10: Timeline visualization showing the temporal aspects of MCP data flow
Using PageOn.ai's Deep Search functionality can help you integrate the right flowchart symbols and standards into your MCP visualizations, ensuring they follow industry best practices while communicating your specific implementation details effectively.
Practical Applications and Use Cases
The Model Context Protocol is finding applications across diverse domains, with business intelligence and data exploration being particularly notable areas where MCP's standardized approach offers significant advantages.
Business Intelligence Applications
As highlighted in Gradient Flow's analysis, business intelligence applications are leveraging MCP to create seamless data exploration experiences. This allows users to:
- Ask natural language questions about business data
- Have AI systems dynamically query relevant databases
- Generate appropriate visualizations based on the query context
- Receive explanations of insights discovered in the data
- Maintain context across multiple analytical steps
                        flowchart TD
                            User[Business Analyst] -->|"Ask: How did our Q2 sales compare to targets?"| NLQ[Natural Language Query]

                            subgraph "MCP-Powered BI System"
                                NLQ --> Intent[Intent Analysis]
                                Intent --> Planning[Query Planning]
                                Planning --> Execution[Query Execution]

                                Execution -->|MCP Request| DB[(Sales Database)]
                                Execution -->|MCP Request| DB2[(Targets Database)]

                                DB --> Results[Raw Results]
                                DB2 --> Results

                                Results --> Analysis[Comparative Analysis]
                                Analysis --> Viz[Visualization Selection]
                                Viz --> Explanation[Insight Generation]

                                Explanation --> UI[User Interface]
                            end

                            UI -->|Visual Dashboard| User
                            UI -->|"Natural language summary: Sales exceeded targets by 12% in Q2, with strongest performance in West Region..."| User

                            classDef user fill:#FFEBCC,stroke:#FF8000,color:#333
                            classDef core fill:#FF8000,stroke:#FF8000,color:white
                            classDef processing fill:#FFF3E0,stroke:#FF8000,color:#333
                            classDef external fill:#E0F7FA,stroke:#00ACC1,color:#333

                            class User user
                            class NLQ,Intent,Planning,Results,Viz core
                            class Execution,Analysis,Explanation,UI processing
                            class DB,DB2 external
Figure 11: MCP data flow in a business intelligence application using natural language queries
Dynamic Visualizations with PageOn.ai
PageOn.ai provides powerful capabilities for creating dynamic visualizations of natural language query processes in MCP systems. Using PageOn's tools, you can:
Interactive Data Flow Maps
Create zoomable, interactive visualizations that show how data moves through MCP systems
Real-Time Process Animations
Animate the execution of MCP queries to illustrate how data transforms at each step
Annotated Tooltips
Add contextual explanations to each component in your MCP visualizations

Figure 12: PageOn.ai interface for creating dynamic MCP visualizations
Data Exploration Scenarios
MCP frameworks are particularly valuable in data exploration scenarios, where they enable:
Figure 13: Comparative effectiveness of MCP in different data exploration scenarios
Case Studies and Implementation Examples
Financial Analysis Platform
A leading financial services company implemented MCP to create an analyst workbench that allows investment professionals to ask natural language questions about market data, company performance, and economic indicators. The MCP implementation connects to over 20 different data sources, maintaining context as users explore complex financial relationships.
                            flowchart LR
                                Query[Analyst Query] --> NLP[NLP Processing]
                                NLP --> MCP[MCP Interface]
                                MCP --> Finance[Financial Data]
                                MCP --> Market[Market Data]
                                MCP --> News[News Analysis]
                                Finance & Market & News --> Integration[Data Integration]
                                Integration --> Visual[Visualization]
                                Integration --> Insight[Insight Generation]
Figure 14: Simplified MCP data flow in financial analysis platform
Key outcomes included a 64% reduction in time to insight and 78% higher user satisfaction compared to traditional data exploration tools.
The visualization capabilities of AI-powered flowchart tools like PageOn.ai make it significantly easier to document and explain these complex implementations, helping more organizations successfully adopt MCP-based approaches.
Tools and Technologies for MCP Data Flow Visualization
As MCP adoption grows, a range of specialized tools has emerged to help visualize MCP data flow. These tools vary in capabilities, learning curve, and integration options.
Specialized Visualization Tools
| Tool Category | Strengths | Limitations |
|---|---|---|
| General Flowchart Tools | Easy to use, widely available | Lack MCP-specific templates, limited interactive features |
| UML/Sequence Diagram Tools | Good for technical documentation, strong standards support | Often complex UI, steep learning curve |
| Data Flow Visualization Tools | Optimized for showing data movement, good for complex flows | May not capture all MCP-specific aspects |
| AI-Assisted Tools (like PageOn.ai) | Intuitive creation process, adaptive to specific needs, conversational interface | Newer technology, may require guidance for optimal results |
| Real-Time Monitoring Tools | Live visualization of active systems, operational intelligence | Complex setup, typically requires instrumentation of code |
How PageOn.ai Transforms MCP Visualization
PageOn.ai offers unique advantages for MCP visualization through its combination of AI-assisted design and specialized features:
Figure 15: PageOn.ai's AI-assisted MCP visualization interface
AI Blocks Feature
PageOn.ai's AI Blocks provide pre-configured components specifically designed for MCP visualization. These blocks encapsulate common MCP patterns and can be quickly assembled into comprehensive visualizations, even by users without deep technical knowledge of the protocol.
Vibe Creation
The Vibe Creation feature allows you to generate MCP flow diagrams through natural conversation. Simply describe the MCP components and relationships in plain language, and PageOn.ai will transform your description into a professionally styled visualization.
Integration Capabilities
Effective MCP visualization tools need to integrate with existing systems and workflows:
Figure 16: Integration capabilities of different MCP visualization approaches
Collaborative Features
MCP implementation is typically a team effort, requiring collaboration across different roles:
                        flowchart TD
                            subgraph "PageOn.ai Collaboration"
                                PM[Product Manager] -->|Define Requirements| PC[PageOn.ai Canvas]
                                Arch[System Architect] -->|Design Flow Structure| PC
                                Dev[Developer] -->|Add Technical Details| PC
                                UX[UX Designer] -->|Enhance Clarity| PC
                                DA[Data Analyst] -->|Validate Data Paths| PC
                            end

                            PC --> Output1[Interactive Presentation]
                            PC --> Output2[Technical Documentation]
                            PC --> Output3[Implementation Guide]
                            PC --> Output4[Stakeholder Reports]

                            classDef role fill:#FFE0B2,stroke:#FF8000,color:#333
                            classDef platform fill:#FF8000,stroke:#FF8000,color:white
                            classDef output fill:#E0F7FA,stroke:#00ACC1,color:#333

                            class PM,Arch,Dev,UX,DA role
                            class PC platform
                            class Output1,Output2,Output3,Output4 output
Figure 17: Collaborative MCP visualization workflow using PageOn.ai
Real-Time Visualization
For operational MCP systems, real-time visualization capabilities can provide valuable insights:

Figure 18: Real-time MCP system monitoring dashboard
Creating effective data visuals in presentation formats is essential when communicating MCP concepts to stakeholders. PageOn.ai's Vibe Creation feature excels at generating these presentation-ready visuals through simple conversation, making complex protocols accessible to non-technical audiences.
Best Practices and Common Challenges
Visualizing MCP data flow effectively requires careful attention to best practices and awareness of common pitfalls. By following established guidelines, you can create representations that enhance understanding while avoiding confusion.
Avoiding Common Pitfalls
Overcomplication
Attempting to show every technical detail rather than focusing on the most important aspects of data flow. This results in cluttered, confusing diagrams.
Solution: Use hierarchical visualization with the ability to expand sections for detail.
Inconsistent Notation
Using different symbols or colors for the same component types across different parts of the visualization, confusing viewers.
Solution: Create and adhere to a consistent visual language throughout all representations.
Missing Context
Creating visualizations that show data movement but fail to explain why it's happening or what business value it provides.
Solution: Include purpose statements and outcome expectations in your visualizations.
Static Representation of Dynamic Processes
Using only static diagrams for processes that have important temporal or conditional aspects.
Solution: Incorporate animation or multiple states to show how flows change under different conditions.

Figure 19: Comparison of ineffective and effective MCP visualizations
Maintaining Accuracy While Simplifying
One of the greatest challenges in MCP visualization is finding the right balance between technical accuracy and conceptual clarity. Consider these approaches:
Progressive Disclosure Approach
Create visualizations that reveal information in layers:
- Level 1: High-level conceptual flow (for executives and stakeholders)
- Level 2: System component interaction (for product managers and designers)
- Level 3: Detailed technical implementation (for developers and engineers)
This approach allows different audiences to access the level of detail that's most relevant to them while ensuring that all representations are accurate at their respective levels of abstraction.
Figure 20: Finding the optimal balance between simplicity and technical accuracy for different audiences
Visualizing Scale and Evolution
MCP systems often grow in complexity over time. Effective visualization needs to account for:
                        flowchart TB
                            subgraph "Initial Implementation"
                            A[User] --> B[AI Model]
                            B --> C[MCP Core]
                            C --> D[Database]
                            C --> E[External API]
                            end

                            subgraph "Scaled Implementation"
                            A2[User] --> B2[AI Model]
                            B2 --> C2[MCP Core]
                            C2 --> D2[Database Cluster]
                            C2 --> E2[API Gateway]
                            C2 --> F[Search Engine]
                            C2 --> G[ML Services]
                            C2 --> H[Document Store]
                            end

                            subgraph "Future Evolution"
                            A3[User] --> M[UI Layer]
                            M --> B3[Model Federation]
                            B3 --> C3[MCP Mesh]
                            C3 --> D3[Database Cluster]
                            C3 --> E3[API Gateway]
                            C3 --> F2[Search Engine]
                            C3 --> G2[ML Services]
                            C3 --> H2[Document Store]
                            C3 --> I[Knowledge Graph]
                            C3 --> J[Real-time Analytics]
                            C3 --> K[Multimodal Processing]
                            end

                            classDef initial fill:#E3F2FD,stroke:#2196F3,color:#333
                            classDef scaled fill:#FFF3E0,stroke:#FF9800,color:#333
                            classDef future fill:#E8F5E9,stroke:#4CAF50,color:#333

                            class A,B,C,D,E initial
                            class A2,B2,C2,D2,E2,F,G,H scaled
                            class A3,M,B3,C3,D3,E3,F2,G2,H2,I,J,K future
Figure 21: Visualizing MCP system evolution from initial implementation to scaled future state
Validation Techniques
Ensuring visualization accuracy against actual system behavior requires systematic validation approaches:
- Developer reviews - Have technical team members verify that diagrams match implementation
- Tracing exercises - Follow an actual request through the system and compare to the visualization
- Stakeholder walkthroughs - Ask non-technical stakeholders to explain what they understand from the visualization
- Error scenario mapping - Verify that failure modes are accurately represented
- Change impact analysis - When system changes occur, update visualizations and validate the changes
Maintaining Visualizations as Protocols Evolve
MCP and other protocols will evolve over time. To maintain accurate visualizations:
PageOn.ai's Agentic Capabilities
PageOn.ai's agentic capabilities can help teams maintain up-to-date MCP visualizations by:
- Monitoring protocol documentation repositories for changes
- Suggesting visualization updates when new MCP features are released
- Automating the revision of diagrams based on implementation code changes
- Maintaining a version history of visualizations that corresponds to protocol evolution
- Highlighting differences between protocol versions to make transitions clearer
Future Directions in MCP Visualization
As the Model Context Protocol ecosystem continues to evolve, visualization techniques are also advancing to meet new challenges and leverage emerging opportunities.
Emerging Visualization Trends
3D Protocol Visualization
Moving beyond 2D diagrams to create explorable 3D representations of complex protocol interactions
AR/VR Protocol Experiences
Immersive experiences that allow teams to "walk through" MCP implementations in virtual environments
Natural Language Visualization
Creating protocol visualizations directly from verbal descriptions using advanced AI translation
Figure 22: Adoption trajectory of emerging MCP visualization trends
Impact of Interactive Visualizations
Interactive and real-time visualizations are transforming how teams engage with MCP systems:
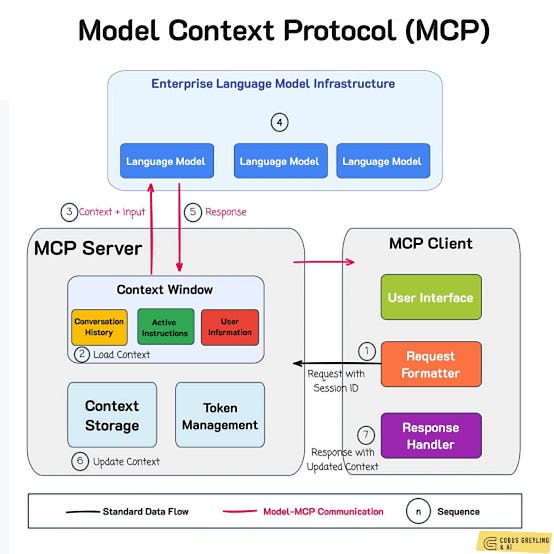
Figure 23: Interactive MCP visualization interface showing real-time data flows
Benefits of Interactive Visualizations
The shift toward interactive MCP visualizations is driving several key benefits:
- Improved comprehension - Users can explore complex relationships at their own pace
- Faster troubleshooting - Problems can be identified visually in real-time
- Better collaboration - Teams can interact with the same visualization simultaneously
- More adaptable documentation - Visualizations can evolve with the system
- Enhanced training - New team members can learn through exploration
AI Assistance in Visualization
AI is playing an increasingly important role in making technical protocols more accessible through visualization:
                        flowchart LR
                            subgraph "Traditional Approach"
                            D[Developer] -->|1. Creates| Code[Protocol Code]
                            Code -->|2. Referenced by| Doc[Technical Documentation]
                            Doc -->|3. Manually creates| VD[Visualization Designer]
                            VD -->|4. Produces| V1[Static Visualization]
                            end

                            subgraph "AI-Assisted Approach"
                            D2[Developer] -->|1. Creates| Code2[Protocol Code]
                            Code2 -->|2. Analyzed by| AI[AI Assistant]
                            D2 -->|3. Provides guidance to| AI
                            AI -->|4. Generates| V2[Dynamic Visualization]
                            AI -->|5. Updates| V2
                            Code2 -->|6. Changes trigger| AI
                            end

                            classDef traditional fill:#E0F7FA,stroke:#00ACC1,color:#333
                            classDef aiAssisted fill:#FFF3E0,stroke:#FF8000,color:#333
                            classDef ai fill:#FF8000,stroke:#FF8000,color:white

                            class D,Code,Doc,VD,V1 traditional
                            class D2,Code2,V2 aiAssisted
                            class AI ai
Figure 24: Comparison of traditional versus AI-assisted protocol visualization workflows
PageOn.ai's approach to AI-assisted visualization demonstrates how technology can transform complex system documentation:
PageOn.ai's Adaptive Visualization Approach
PageOn.ai creates forward-thinking, adaptive visualizations that evolve with protocol standards by:
- Automatically detecting protocol changes from implementation code
- Suggesting visualization updates based on usage patterns and best practices
- Learning from user feedback to improve visualization clarity
- Maintaining consistent representation styles across protocol versions
- Generating different views for different audiences while maintaining data integrity
Standardization of Visualization Methods
As MCP adoption grows, there's an increasing push for standardized visualization methodologies:
Figure 25: Evolution toward standardized MCP visualization methods
Innovations in Accessibility
Making technical protocols more accessible through visual means continues to be an area of innovation:
Figure 26: Multimodal MCP visualization with accessibility features
As we look toward the future, PageOn.ai's integration of advanced visualization techniques with AI assistance positions it as a powerful tool for creating forward-thinking, adaptive visualizations that evolve with protocol standards and make complex technical concepts accessible to wider audiences.
Transform Your MCP Visualizations with PageOn.ai
Ready to create stunning, intuitive visualizations of your Model Context Protocol systems? PageOn.ai's powerful AI-assisted design tools make it easy to transform complex technical concepts into clear, engaging visuals that everyone can understand.
Start Creating with PageOn.ai TodayYou Might Also Like
How to Design Science Lesson Plans That Captivate Students
Create science lesson plans that captivate students with hands-on activities, clear objectives, and real-world applications to foster curiosity and critical thinking.
How to Write a Scientific Review Article Step by Step
Learn how to write a review article in science step by step. Define research questions, synthesize findings, and structure your article for clarity and impact.
How to Write a Self-Performance Review with Practical Examples
Learn how to write a self-performance review with examples and tips. Use an employee performance review work self evaluation sample essay to guide your process.
How to Write a Spec Sheet Like a Pro? [+Templates]
Learn how to create a professional spec sheet with key components, step-by-step guidance, and free templates to ensure clarity and accuracy.