Visualizing the Data Maturity Journey: From Isolated Silos to AI-Powered Enterprise Architecture
I've found that organizations often struggle to understand where they stand in their data evolution. Let me guide you through the transformative path from disconnected data silos to an integrated, AI-enhanced architecture.
The Data Maturity Spectrum: Understanding the Foundation
I've observed that data maturity isn't a binary state but rather a continuous spectrum that organizations traverse over time. At its core, data maturity represents an organization's ability to effectively leverage data assets to drive decision-making and create business value.

Key Stages of Organizational Data Evolution
                    flowchart LR
                        A[Data Silos] -->|Integration| B[Connected Data]
                        B -->|Analytics Adoption| C[Insight-Driven]
                        C -->|AI Implementation| D[AI-Enhanced]
                        D -->|Continuous Evolution| E[Future-Ready]
                        classDef orange fill:#FF8000,stroke:#333,stroke-width:1px,color:white;
                        classDef blue fill:#42A5F5,stroke:#333,stroke-width:1px,color:white;
                        classDef green fill:#66BB6A,stroke:#333,stroke-width:1px,color:white;
                        classDef purple fill:#AB47BC,stroke:#333,stroke-width:1px,color:white;
                        classDef yellow fill:#FFCA28,stroke:#333,stroke-width:1px,color:white;
                        class A orange
                        class B blue
                        class C green
                        class D purple
                        class E yellow
The cost of remaining in data immaturity is substantial. In my work with organizations across industries, I've seen companies miss critical market opportunities because they couldn't access or trust their data quickly enough. The competitive disadvantage grows exponentially as more agile competitors leverage advanced analytics and AI to optimize operations and customer experiences.
One common misconception I frequently encounter is viewing data maturity as a destination rather than a continuous journey. Organizations often believe that implementing a specific technology or completing a particular project will suddenly make them "data mature." In reality, data maturity requires ongoing commitment, cultural change, and technological evolution.
When helping clients understand their current position, I use ai powered growth charts to visualize where they stand in the data maturity spectrum. PageOn.ai's visualization capabilities make this assessment process intuitive and actionable, helping leadership teams grasp both their current state and the path forward.
Breaking Down the Silos: First Steps Toward Data Integration
In my experience, data silos manifest through several warning signs: departments using inconsistent metrics for the same KPIs, excessive time spent reconciling reports from different systems, and the inability to trace data lineage across the organization. These symptoms indicate fundamental barriers to effective data utilization.
Impact of Data Silos on Business Performance
My research shows these are the most significant business impacts of siloed data environments:
The barriers preventing effective data sharing are rarely just technical. In my consulting work, I've found that organizational politics, departmental territorialism, and fear of transparency often pose greater challenges than technical integration difficulties. Success requires addressing both dimensions simultaneously.
I've worked with several organizations that successfully transitioned from siloed approaches. A mid-sized healthcare provider initially struggled with patient data fragmented across clinical, billing, and administrative systems. By implementing a phased integration approach that prioritized critical patient touchpoints, they reduced report generation time by 68% and improved care coordination measurably.
When helping organizations identify integration points, I leverage company ai transformation roadmap techniques. PageOn.ai's AI Blocks feature allows me to create visual representations of interdepartmental data flows, making it easier to identify high-value integration opportunities and prioritize them based on business impact.
Building the Connected Data Foundation
From my experience implementing data transformations across industries, I've identified several essential components that form the backbone of a truly unified data architecture:
                    flowchart TB
                        subgraph "Connected Data Foundation"
                            A[Data Governance]
                            B[Unified Data Model]
                            C[Integration Layer]
                            D[Metadata Management]
                            E[Data Quality Framework]
                            F[Security & Compliance]
                            A --- B
                            B --- C
                            C --- D
                            D --- E
                            E --- F
                            A --- F
                        end
                        subgraph "Data Sources"
                            DS1[Operational Systems]
                            DS2[External Data]
                            DS3[Unstructured Data]
                        end
                        subgraph "Data Consumers"
                            DC1[Analytics]
                            DC2[AI/ML]
                            DC3[Applications]
                        end
                        DS1 --> C
                        DS2 --> C
                        DS3 --> C
                        C --> DC1
                        C --> DC2
                        C --> DC3
One of the most challenging balances I help organizations strike is between centralized governance and departmental data ownership. The most successful approach I've implemented establishes enterprise-wide standards and policies while allowing business units to maintain ownership of domain-specific data. This federated model provides consistency where needed while preserving domain expertise.
Data Quality Framework Components
| Component | Purpose | Maturity Indicators |
|---|---|---|
| Data Profiling | Understand data characteristics and identify anomalies | Automated profiling with anomaly detection |
| Data Validation | Enforce business rules and constraints | Rule-based validation with real-time feedback |
| Data Cleansing | Correct errors and standardize formats | Automated cleansing with human review for exceptions |
| Data Enrichment | Enhance data with additional context | Contextual enrichment from multiple sources |
| Quality Monitoring | Track quality metrics over time | Dashboards with trending and alerting |
In my work implementing metadata management systems, I've found they serve as the connective tissue of a cohesive data ecosystem. Effective metadata catalogs not only technical attributes but also business context, data lineage, and usage patterns. This comprehensive view enables data discovery, governance, and impact analysis.
When helping organizations map their existing data assets, I use PageOn.ai's Deep Search capabilities to create visual representations that highlight connection opportunities. This approach makes the abstract concept of metadata management tangible to business stakeholders, accelerating buy-in and adoption.
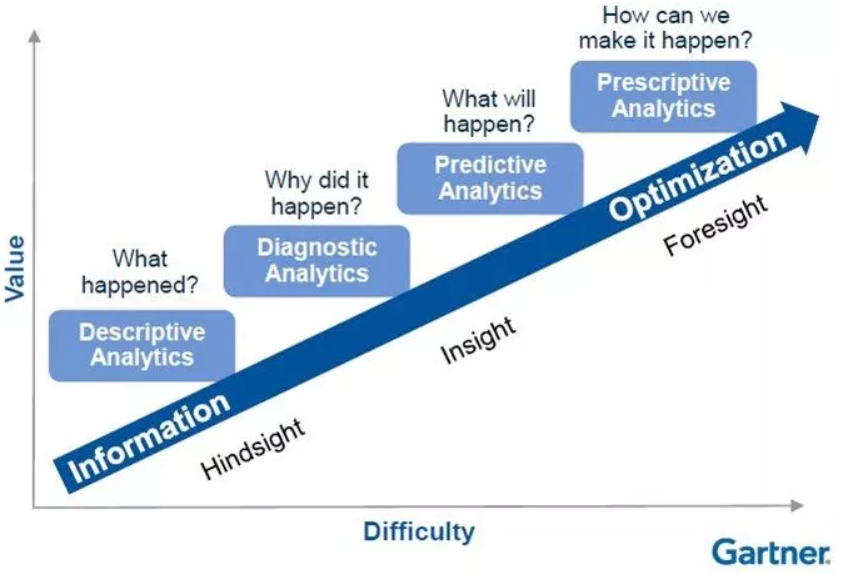
Analytics Maturity: From Descriptive to Predictive Insights
Throughout my career guiding analytics transformations, I've observed that organizations typically evolve through distinct stages of analytical capability. This progression isn't purely technological—it reflects growing organizational sophistication in how data is leveraged for decision-making.
Analytics Maturity Evolution
I've found that many organizations struggle to differentiate between reporting, analytics, and intelligence functions. Reporting answers "what happened," analytics explains "why it happened," and intelligence predicts "what will happen next" and prescribes "what should we do about it." Each function requires different tools, skills, and organizational approaches.
In my experience implementing analytics democratization, balancing access with security is critical. The most successful approach establishes role-based access controls aligned with business functions, coupled with clear data literacy training and ethical guidelines. This framework enables broader data utilization while maintaining appropriate governance.
One challenge I consistently help organizations overcome is the gap between technical analysis and business understanding. PageOn.ai's visual storytelling capabilities have proven invaluable in this context, allowing technical teams to transform complex analyses into compelling narratives that drive action. This bridge between insight and action is often what determines whether analytics investments deliver business value.
As organizations advance in their ai revolution visual milestones, the analytics function evolves from a specialized technical capability to an enterprise-wide approach to decision-making. This maturation process requires intentional development of both technical infrastructure and organizational capabilities.
The AI-Enhanced Data Architecture
In my work guiding AI implementations, I've identified several critical prerequisites within the data maturity framework that must be established before organizations can successfully deploy AI solutions:
                    flowchart TD
                        A[Data Foundation] --> B[AI Readiness]
                        B --> C[AI Implementation]
                        C --> D[AI Scale & Optimize]
                        subgraph "Data Foundation"
                            A1[Unified Data Architecture]
                            A2[Data Quality Framework]
                            A3[Governance Structure]
                        end
                        subgraph "AI Readiness"
                            B1[Use Case Identification]
                            B2[Skills Development]
                            B3[Ethical Framework]
                            B4[Technical Infrastructure]
                        end
                        subgraph "AI Implementation"
                            C1[Pilot Projects]
                            C2[Model Development]
                            C3[Integration Points]
                            C4[Feedback Mechanisms]
                        end
                        subgraph "AI Scale & Optimize"
                            D1[MLOps Implementation]
                            D2[Expanded Use Cases]
                            D3[Continuous Learning]
                            D4[Value Measurement]
                        end
                        A --> A1
                        A --> A2
                        A --> A3
                        B --> B1
                        B --> B2
                        B --> B3
                        B --> B4
                        C --> C1
                        C --> C2
                        C --> C3
                        C --> C4
                        D --> D1
                        D --> D2
                        D --> D3
                        D --> D4
When helping organizations identify high-value AI use cases, I focus on aligning potential applications with core business objectives. The most successful implementations I've guided started with clearly defined business problems rather than technology-first approaches. This business-centric methodology ensures AI delivers measurable value rather than becoming a costly experiment.
Ethical Considerations in AI Implementation
Transparency
Ensuring stakeholders understand how AI systems make decisions and what data influences those decisions.
Fairness
Identifying and mitigating bias in training data and algorithms to ensure equitable outcomes across different groups.
Privacy
Implementing data protection measures and ensuring compliance with relevant regulations while enabling AI functionality.
Accountability
Establishing clear ownership and responsibility for AI systems and their outcomes within the organization.
One of the most powerful aspects of AI-enhanced data architectures I've implemented is the positive feedback loop they create. AI systems not only consume data but also generate insights about data quality, completeness, and relevance. This feedback mechanism, when properly integrated into data management processes, drives continuous improvement in the underlying data assets.
When working with complex AI workflows, I've found that visualization is essential for stakeholder understanding and alignment. PageOn.ai's intuitive interface allows me to create clear visual representations of AI dependencies, data flows, and decision points. These visualizations bridge the gap between technical implementation and business understanding, accelerating adoption and value realization.
As organizations look toward the future, understanding AI tool trends 2025 becomes increasingly important for strategic planning and architecture decisions. The landscape is evolving rapidly, with emerging capabilities that will fundamentally transform how organizations leverage data and AI.
Measuring Progress: KPIs for Data Maturity Evolution
Based on my experience guiding dozens of data transformation initiatives, I've developed a comprehensive framework of quantifiable metrics to assess movement along the data maturity journey. These metrics span both technical capabilities and business outcomes.
Data Maturity KPI Framework
I've observed that organizations often overemphasize technical metrics at the expense of business value indicators. The most effective measurement approaches I've implemented balance both dimensions, with metrics such as data quality scores and system integration rates complemented by business outcomes like decision cycle time reduction and revenue impact of data-driven initiatives.
Setting Realistic Timeframes
| Maturity Stage | Typical Timeframe | Key Dependencies |
|---|---|---|
| Foundation Building | 6-12 months | Executive sponsorship, initial funding |
| Integration & Standardization | 12-18 months | Technical architecture, governance framework |
| Analytics Adoption | 18-24 months | Data quality, skills development |
| AI Implementation | 24-36 months | Analytics maturity, use case clarity |
| Continuous Evolution | Ongoing | Cultural adoption, innovation processes |
When helping organizations benchmark their progress, I typically leverage industry-specific maturity models while acknowledging that each organization's journey is unique. Effective benchmarking considers industry context, organizational size, and strategic priorities rather than applying one-size-fits-all comparisons.
For executive stakeholders, I've found that visual tracking of maturity progress is far more effective than text-heavy reports. PageOn.ai enables me to create executive dashboards that visually represent maturity advancement across multiple dimensions, making complex progress patterns immediately apparent to decision-makers.
The Human Element: Culture and Skills for Data Transformation
In my years of implementing data transformations, I've learned that technical excellence alone doesn't guarantee success. The human element—culture, skills, and organizational dynamics—often determines whether initiatives deliver sustainable value or become expensive disappointments.

Building data literacy requires a multi-tiered approach tailored to different organizational roles. I typically implement programs that provide executives with strategic understanding, managers with analytical interpretation skills, and frontline employees with practical data application capabilities. This layered approach ensures everyone contributes appropriately to the data-driven culture.
Evolving Roles Across the Maturity Journey
                    flowchart LR
                        subgraph "Early Stage"
                            E1[Data Engineers]
                            E2[Data Analysts]
                            E3[IT Support]
                        end
                        subgraph "Intermediate Stage"
                            I1[Data Architects]
                            I2[Data Scientists]
                            I3[Data Stewards]
                            I4[BI Developers]
                        end
                        subgraph "Advanced Stage"
                            A1[ML Engineers]
                            A2[AI Ethicists]
                            A3[Data Product Managers]
                            A4[Analytics Translators]
                        end
                        E1 --> I1
                        E1 --> I2
                        E2 --> I2
                        E2 --> I4
                        E3 --> I3
                        I1 --> A1
                        I2 --> A1
                        I2 --> A2
                        I3 --> A2
                        I4 --> A3
                        I4 --> A4
Change management is often the most underestimated aspect of data transformation. In my experience, successful initiatives allocate at least 30% of their resources to change management activities. This includes stakeholder engagement, communication planning, training, and addressing resistance through targeted interventions.
The most common sources of resistance I encounter include fear of transparency, concerns about job security, and skepticism about the value of new approaches. Addressing these concerns requires both empathy and evidence—acknowledging legitimate concerns while demonstrating tangible benefits through early wins and pilot projects.
When training teams on complex data concepts, I leverage PageOn.ai to create engaging visual materials that simplify difficult ideas. These visualizations transform abstract concepts into intuitive models that accelerate learning and adoption across different learning styles and technical backgrounds.
In organizations exploring AI tool trends 2025, the human element becomes even more critical. As technology capabilities advance, the differentiating factor increasingly becomes how effectively people can leverage these tools to create business value.
Strategic Roadmap: Plotting Your Organization's Unique Journey
When I help organizations develop their data transformation roadmaps, the first step is always an honest assessment of the current state. This requires looking beyond surface-level metrics to understand fundamental capabilities, cultural readiness, and existing pain points.
Initiative Prioritization Matrix
When prioritizing initiatives, I advise organizations to balance quick wins with foundational capabilities. The most effective roadmaps I've developed include a mix of high-visibility projects that demonstrate value quickly and longer-term investments in core capabilities that enable sustainable advancement.
Resource allocation across multi-year transformations requires both strategic commitment and tactical flexibility. I typically recommend establishing a dedicated transformation team with stable funding while maintaining flexibility to adjust specific initiatives as organizational learning accumulates and business conditions evolve.

Managing stakeholder expectations is critical to sustained support. I've found that transparent communication about timelines, dependencies, and potential challenges builds credibility and maintains momentum through inevitable setbacks. Setting realistic expectations from the outset prevents disappointment and creates space for celebrating meaningful progress.
When designing transformation roadmaps, I leverage PageOn.ai's visualization capabilities to create compelling visual representations that communicate both strategic vision and tactical execution plans. These visual roadmaps align stakeholders around a common understanding and serve as an ongoing reference point throughout the transformation journey.
Future-Proofing: Maintaining Momentum in the Data Maturity Journey
Throughout my career guiding data transformations, I've observed that technological shifts can dramatically impact data architecture decisions. Organizations that build adaptability into their core design principles are better positioned to incorporate emerging capabilities without disruptive rebuilding.
Emerging Technologies Impact Assessment
                    flowchart TD
                        A[Data Architecture] --> B{Impact Assessment}
                        B --> C[Low Impact]
                        B --> D[Medium Impact]
                        B --> E[High Impact]
                        C --> F[Monitor]
                        D --> G[Pilot & Evaluate]
                        E --> H[Strategic Integration]
                        subgraph "Emerging Technologies"
                            ET1[Edge Computing]
                            ET2[Federated Learning]
                            ET3[Synthetic Data]
                            ET4[Quantum Computing]
                            ET5[Autonomous Data Systems]
                        end
                        ET1 --> D
                        ET2 --> D
                        ET3 --> C
                        ET4 --> E
                        ET5 --> E
Building adaptability into data ecosystems requires specific architectural approaches. In my practice, I advocate for modular designs with well-defined interfaces, containerized services that can be independently updated, and metadata-driven processing that separates logic from implementation. These patterns create flexibility without sacrificing stability.
Continuous Improvement Framework
Measure
- • Defined KPIs across maturity dimensions
- • Regular assessment cadence
- • Automated metrics collection
- • Comparative benchmarking
Learn
- • Root cause analysis
- • Cross-functional reviews
- • External perspective integration
- • Knowledge management systems
Adapt
- • Prioritized improvement backlog
- • Agile implementation cycles
- • Feedback collection mechanisms
- • Innovation incubation process
Based on my research and implementation experience, several emerging trends will shape the next frontier of data maturity. These include the convergence of operational and analytical data processing, embedded AI throughout the data lifecycle, and increasingly automated governance and quality management. Organizations that anticipate these shifts can position themselves advantageously.

When helping organizations model potential future states, I leverage PageOn.ai's agentic capabilities to create dynamic visualizations that illustrate different scenarios and their implications. These models allow leadership teams to explore strategic options and make more informed decisions about technology investments and capability development.
Transform Your Data Maturity Journey with PageOn.ai
Ready to accelerate your organization's evolution from data silos to an AI-powered architecture? PageOn.ai's powerful visualization tools can help you map your current state, design your ideal future, and create a compelling roadmap to get there.
Continuing Your Data Maturity Journey
Throughout this exploration of the data maturity journey, I've shared insights from my experience guiding organizations from siloed data environments to integrated, AI-enhanced architectures. The path is rarely linear, and each organization faces unique challenges and opportunities along the way.
What remains consistent is that organizations that approach data maturity as a continuous journey rather than a destination are better positioned to adapt to changing business conditions and technological capabilities. By focusing on both technical foundations and human elements, these organizations create sustainable competitive advantages through their data capabilities.
As you continue your own organization's journey, remember that visualization is a powerful tool for aligning stakeholders, clarifying complex concepts, and tracking progress. PageOn.ai provides the capabilities you need to transform abstract data concepts into compelling visual narratives that drive understanding and action.
The future belongs to organizations that can continuously evolve their data capabilities while maintaining a clear focus on delivering business value. By embracing both the technical and human dimensions of data maturity, you can position your organization for sustained success in an increasingly data-driven world.
You Might Also Like
How AI Amplifies Marketing Team Capabilities While Preserving Human Jobs | Strategic Marketing Enhancement
Discover how AI transforms marketing teams into powerhouses without reducing workforce size. Learn proven strategies for capability multiplication and strategic enhancement.
Transforming Marketing Teams: From AI Hesitation to Strategic Implementation Success
Discover proven strategies to overcome the four critical barriers blocking marketing AI adoption. Transform your team from hesitant observers to strategic AI implementers with actionable roadmaps and success metrics.
Google's 9-Hour Prompt Engineering Path to AI Mastery | Complete Visual Guide
Master AI communication through Google's comprehensive 9-hour prompt engineering framework. Learn visual strategies for effective AI interaction and professional success.
The AI Superpower Timeline: Visualizing US-China AI Race & Tech Developments
Explore the narrowing US-China AI performance gap, historical milestones, technical battlegrounds, and future projections in the global artificial intelligence race through interactive visualizations.