Entrepreneurial Decision Mapping: Visualizing Risk & Reward Pathways for Business Success
Navigate the Complex Terrain of Business Risk with Strategic Visualization
For entrepreneurs, risk is inevitable—but with powerful visual decision mapping techniques, you can transform uncertainty into strategic advantage. Discover how to create, analyze, and implement visual frameworks that clarify complex decisions and drive confident business growth.
The Entrepreneur's Risk Landscape: Understanding the Terrain
Entrepreneurship and risk-taking are inseparable companions on the journey to business success. Understanding this landscape is the first step toward making informed decisions that can propel your venture forward while protecting it from potential pitfalls.

The entrepreneurial journey involves navigating multiple risk pathways, each with unique challenges and potential rewards.
Key Categories of Entrepreneurial Risks
Entrepreneurs face various categories of risk that must be evaluated and managed:
Market Risk: Uncertainty about customer demand, market saturation, and competitive landscape. This includes launching products in emerging or untested markets.
Operational Risk: Challenges related to internal processes, production efficiency, supply chain disruptions, and infrastructure failures.
Reputational Risk: Potential damage to brand perception based on actions, communications, or market presence. As noted by entrepreneurship experts, "What you do, how you do it and what you don't do can influence how people perceive your brand."
Financial Risk: Concerns related to cash flow, investment returns, debt management, and capital allocation decisions.
Transforming Abstract Risks into Visual Decision Points
Visual decision maps serve as powerful tools for entrepreneurs by transforming abstract concepts of risk into tangible, actionable decision points. This transformation process offers several key benefits:
Risk Perception to Visual Decision Point Transformation
flowchart TB
    A[Abstract Risk] --> B[Quantification]
    B --> C[Visual Mapping]
    C --> D[Decision Point]

    style A fill:#FFF4E6,stroke:#FF8000
    style B fill:#FFF4E6,stroke:#FF8000
    style C fill:#FFF4E6,stroke:#FF8000
    style D fill:#FFF4E6,stroke:#FF8000
The psychology behind risk perception significantly impacts entrepreneurial decision-making. Our brains tend to process visual information 60,000 times faster than text, making visualization a potent tool for understanding complex risk scenarios. Creating map data visualizations helps entrepreneurs overcome cognitive biases like:
- Confirmation Bias: Tendency to favor information that confirms existing beliefs
- Loss Aversion: Stronger preference to avoid losses than to acquire gains
- Recency Bias: Overweighting recent events and experiences
- Overconfidence: Excessive confidence in one's abilities or predictions
By structuring information visually, entrepreneurs can better grasp the full spectrum of possibilities and consequences, leading to more balanced and objective decision-making.
Decision Tree Architecture: Building Your Risk Navigation System
Decision trees are powerful visual tools that help entrepreneurs map out complex decision scenarios and their potential outcomes. By creating a structured framework for evaluating options, decision trees transform abstract possibilities into concrete pathways with quantifiable risks and rewards.

Fundamental Components of Entrepreneurial Decision Trees
Every effective decision tree for entrepreneurial risk assessment contains these key elements:
flowchart TD
    A[Decision Node] -->|Option A| B[Chance Node]
    A -->|Option B| C[Chance Node]
    B -->|Outcome 1 - 30%| D[+$50,000]
    B -->|Outcome 2 - 70%| E[-$20,000]
    C -->|Outcome 1 - 60%| F[+$30,000]
    C -->|Outcome 2 - 40%| G[-$10,000]

    style A fill:#FFF4E6,stroke:#FF8000
    style B fill:#E6F7FF,stroke:#1890FF
    style C fill:#E6F7FF,stroke:#1890FF
    style D fill:#F6FFED,stroke:#52C41A
    style E fill:#FFF1F0,stroke:#F5222D
    style F fill:#F6FFED,stroke:#52C41A
    style G fill:#FFF1F0,stroke:#F5222D
The core components of an effective decision tree include:
-
1
Decision Nodes: Points where an entrepreneur must choose between multiple options (represented by squares)
-
2
Chance Nodes: Points where outcomes depend on external factors or probabilities (represented by circles)
-
3
Branches: Lines connecting nodes that represent available options or possible outcomes
-
4
Probabilities: Numerical values assigned to chance outcomes (must sum to 100% at each chance node)
-
5
Payoffs: End values that represent the outcomes (financial gains/losses, strategic advantages, etc.)
Constructing Your Decision Tree: Step-by-Step Approach
-
1
Define the decision question
Start with a clear, specific decision that needs to be made (e.g., "Should we launch this new product line?")
-
2
Identify all possible options
Map out all available choices and any subsequent decisions that might follow each choice
-
3
Add chance nodes and probabilities
For each option, identify uncertain outcomes and assign probability values based on market research, historical data, and expert opinions
-
4
Calculate expected values
For each chance node, multiply each outcome value by its probability and sum the results to find the expected value of that node
-
5
Compare options and make decision
Select the option with the highest expected value, adjusting for risk tolerance and strategic considerations
PageOn.ai transforms these complex risk calculations into intuitive visual structures, allowing entrepreneurs to easily create professional decision trees without specialized technical knowledge. The platform enables seamless integration of market data and industry benchmarks, providing a solid foundation for decision-making based on reliable information rather than guesswork. When constructing decision maps for important business decisions, consider using tools like business overview frameworks to ensure comprehensive risk evaluation.
From Analysis Paralysis to Decisive Action
Analysis paralysis—the inability to make decisions due to overthinking or excessive information—is a common challenge for entrepreneurs facing complex risk scenarios. Visual decision mapping offers powerful solutions to overcome this obstacle and move confidently from analysis to action.

Common Decision-Making Bottlenecks and Visual Solutions
| Decision Bottleneck | Visual Solution | Key Benefit |
|---|---|---|
| Information Overload | Hierarchical Decision Trees | Organizes complex data into manageable branches |
| Conflicting Priorities | Multi-criteria Decision Matrices | Visualizes trade-offs between competing objectives |
| Risk Aversion | Risk-Reward Quadrant Maps | Contextualizes risks within potential reward frameworks |
| Uncertain Outcomes | Probability-Weighted Scenario Maps | Quantifies likelihood of various outcomes |
| Decision Timeline Pressure | Staged Decision Flowcharts | Breaks complex decisions into sequential stages |
Breaking Down High-Stakes Decisions with Visual Components
The most challenging entrepreneurial decisions can be deconstructed into manageable components through effective visualization techniques:
Breaking down a product launch decision:
flowchart TD
    A[Product Launch Decision] --> B[Market Readiness Assessment]
    A --> C[Financial Viability Analysis]
    A --> D[Operational Capability Check]
    A --> E[Competitive Positioning Review]

    B --> B1[Target Market Size]
    B --> B2[Customer Feedback Scores]
    B --> B3[Market Timing Factors]

    C --> C1[Development Cost Recovery]
    C --> C2[Projected Profit Margins]
    C --> C3[Cash Flow Impact]

    style A fill:#FFF4E6,stroke:#FF8000,stroke-width:2px
    style B fill:#F0F5FF,stroke:#85A5FF
    style C fill:#F0F5FF,stroke:#85A5FF
    style D fill:#F0F5FF,stroke:#85A5FF
    style E fill:#F0F5FF,stroke:#85A5FF
Case Study: Decision Mapping in Action
When faced with a critical decision about whether to pivot their business model, the founders of a SaaS startup utilized decision mapping to navigate through uncertainty.
- They created a detailed decision tree showing potential outcomes of staying the course versus pivoting
- For each branch, they quantified the probabilities of success based on market research and competitor analysis
- They calculated expected values for each option, factoring in both financial and strategic considerations
- The visualization revealed hidden opportunities in a hybrid approach that wasn't initially considered
- The company successfully implemented the hybrid model and achieved 127% year-over-year growth
Converting Gut Feelings into Structured Frameworks
Entrepreneurs often rely on intuition, but the most successful decisions combine instinct with structured analysis. Here's how to transform intuitive "gut feelings" into visual decision frameworks:
Intuition vs. Structured Decision-Making
PageOn.ai's AI Blocks feature empowers entrepreneurs to rapidly prototype different decision scenarios, transforming intuitive thought processes into structured visual models. This approach allows for:
- Translating vague concerns into specific, quantifiable risk factors
- Testing intuitive judgments against historical data and market trends
- Creating shareable decision models that facilitate team alignment
- Documenting decision rationale for future reference and learning
By leveraging tools designed for AI-powered organizational clarity, entrepreneurs can transform subjective intuition into objective criteria that still honors the value of experience-based judgment.
Data-Driven Decision Mapping Methods
The most powerful entrepreneurial decision maps combine compelling visualization with solid data foundations. By integrating analytical frameworks and real-world data into your visual decision maps, you create tools that are both intuitive and substantively robust.
Integrating SWOT Analysis into Visual Decision Maps
SWOT analysis (Strengths, Weaknesses, Opportunities, Threats) provides a structured way to evaluate internal capabilities and external factors. When integrated into decision maps, SWOT elements can contextualize decision points and enhance risk assessment.
SWOT-Enhanced Decision Tree
flowchart TD
    A[Market Expansion Decision] --> B{Expand to Market A}
    A --> C{Expand to Market B}

    B -->|"STRENGTHS: Brand recognition\nResourceful team"| B1[Rapid Expansion]
    B -->|"WEAKNESSES: Limited capital\nSupply chain constraints"| B2[Phased Expansion]

    C -->|"OPPORTUNITIES: Growing demand\nWeak competition"| C1[Aggressive Entry]
    C -->|"THREATS: Regulatory hurdles\nUnstable economy"| C2[Conservative Entry]

    style A fill:#FFF4E6,stroke:#FF8000,stroke-width:2px
    style B fill:#F0F5FF,stroke:#85A5FF,stroke-width:2px
    style C fill:#F0F5FF,stroke:#85A5FF,stroke-width:2px
This integrated approach ensures that decisions are made with full awareness of your organization's internal strengths and weaknesses, as well as external opportunities and threats. As recommended by risk management experts, conducting a thorough SWOT analysis before making any risky decision provides a more comprehensive understanding of the potential outcomes.
Visualizing Probabilities and Expected Value Calculations
Effective entrepreneurial decision-making requires not just identifying options but quantifying their potential outcomes. By visualizing numerical probabilities and expected values, decision maps transform abstract possibilities into concrete, comparable choices.
Expected Value Comparison for Product Launch Strategies
Expected Value Formula for Decision Trees
For any decision branch with uncertain outcomes, calculate the Expected Value (EV) using:
EV = (Probability of Outcome 1 × Value of Outcome 1) + (Probability of Outcome 2 × Value of Outcome 2) + ...
Example: If launching a new product has a 70% chance of generating $100,000 profit and a 30% chance of losing $40,000, the Expected Value would be: (0.7 × 100,000) + (0.3 × -40,000) = $70,000 - $12,000 = $58,000
Representing Competing Objectives and Trade-offs
Many entrepreneurial decisions involve balancing multiple, sometimes competing objectives. Visual decision maps can help clarify these trade-offs and guide optimal choices based on your specific priorities.
Multi-Criteria Decision Analysis
PageOn.ai's Deep Search functionality allows entrepreneurs to pull relevant market statistics directly into decision frameworks, creating data-rich visualizations that combine market intelligence with intuitive decision mapping. This integration ensures that entrepreneurs can make decisions based on current market conditions and trends rather than outdated or incomplete information.
When preparing presentations for investors or stakeholders, consider leveraging these data-driven visualizations within a comprehensive startup pitch deck to effectively communicate your strategic decision-making process.
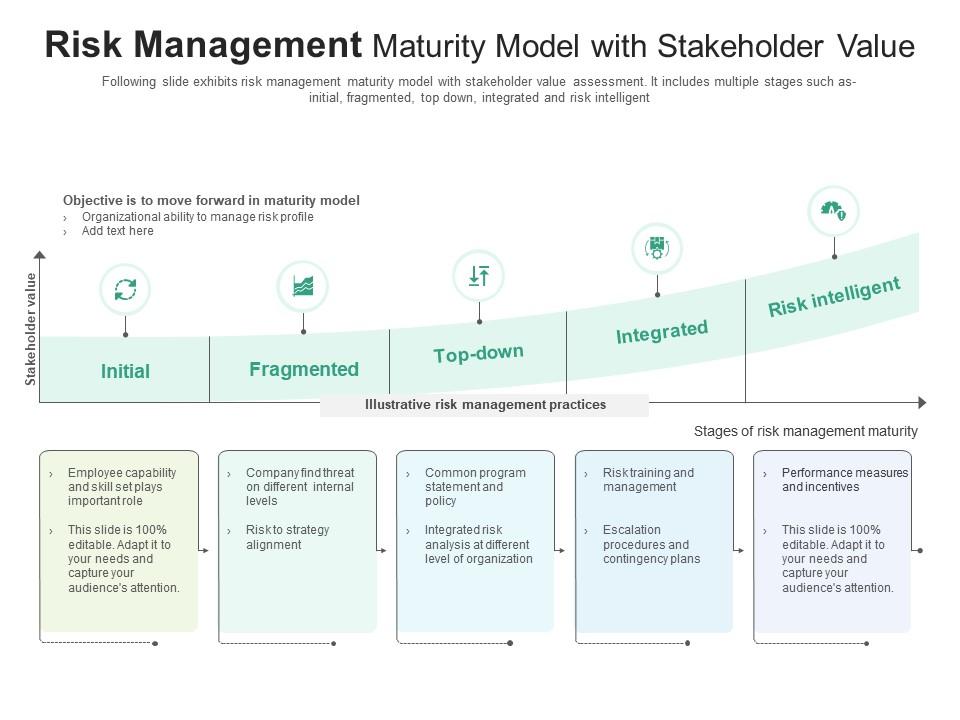
Strategic Risk Visualization for Business Growth
Strategic growth decisions require a careful balance of risk and opportunity. Effective visualization of this relationship helps entrepreneurs identify the optimal path forward that aligns with both their growth ambitions and risk tolerance.
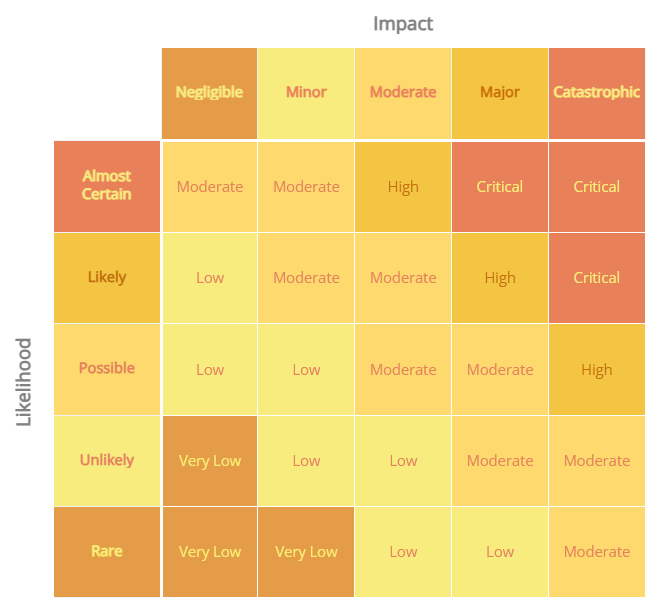
Mapping Risk Appetite and Growth Potential
Every entrepreneur and organization has a unique risk profile that influences their strategic decisions. Visualizing the relationship between risk appetite and growth potential provides valuable context for making aligned choices.
Risk-Growth Matrix
The risk-growth matrix helps entrepreneurs:
- Identify initiatives that offer optimal risk-reward balance based on organizational risk tolerance
- Visualize the potential trade-offs between safer, incremental growth and higher-risk transformational opportunities
- Create a balanced portfolio of initiatives across different risk categories
- Communicate strategic rationale to stakeholders, investors, and team members
Visualizing Opportunity Costs in Decision Scenarios
One of the most challenging aspects of entrepreneurial decision-making is evaluating opportunity costs—what you give up by choosing one option over another. Visual decision maps can make these hidden costs explicit.
Opportunity Cost Decision Tree
flowchart TD
    A[Investment Decision: $500K Available] --> B[Product Development]
    A --> C[Market Expansion]

    B -->|"Year 1-2: +$300K\nYear 3-5: +$800K"| B1[Direct Returns]
    B -->|"Market Share: +5%\nBrand Value: +$1.2M"| B2[Indirect Benefits]
    B -->|"Lost Market Entry Timing\nDeferred International Growth"| B3[Opportunity Costs]

    C -->|"Year 1-2: +$450K\nYear 3-5: +$600K"| C1[Direct Returns]
    C -->|"Brand Reach: +20%\nNew Customer Base"| C2[Indirect Benefits]
    C -->|"Delayed Innovation\nCompetitor Product Advantage"| C3[Opportunity Costs]

    style A fill:#FFF4E6,stroke:#FF8000,stroke-width:2px
    style B fill:#F0F5FF,stroke:#85A5FF
    style C fill:#F0F5FF,stroke:#85A5FF
    style B3 fill:#FFF1F0,stroke:#FF7875
    style C3 fill:#FFF1F0,stroke:#FF7875
This approach offers a more complete picture of decision consequences by explicitly including what might be lost or delayed by each choice. For entrepreneurs seeking investment, communicating this level of strategic thinking can be particularly powerful when incorporated into investment banking pitch decks.
Techniques for Scenario Planning and Visual Stress-Testing
Scenario planning allows entrepreneurs to prepare for multiple possible futures rather than betting on a single outcome. Visual stress-testing helps identify potential weaknesses in strategies before they become problematic.
Four-Quadrant Scenario Planning Process
- Identify Key Uncertainties: Determine the two most impactful and uncertain factors affecting your decision
- Create Scenario Matrix: Place these factors on X and Y axes, creating four distinct future scenarios
- Develop Scenario Narratives: For each quadrant, create a detailed description of that possible future
- Test Strategy Resilience: Evaluate how your current strategy would perform in each scenario
- Identify Early Indicators: Determine signals that would indicate which scenario is emerging
- Create Contingency Plans: Develop specific responses for each scenario
PageOn.ai's visualization tools enable entrepreneurs to craft compelling risk-reward narratives for stakeholders and investors. By transforming complex decision frameworks into clear, visually appealing presentations, entrepreneurs can more effectively communicate their strategic thinking and build confidence in their approach to balancing growth ambitions with prudent risk management.
Implementation: Turning Decision Maps into Action Plans
The ultimate value of decision mapping lies not in the visualization itself but in how it translates into concrete action. This section explores how entrepreneurs can bridge the gap between decision theory and practical execution.
Transforming Decision Trees into Execution Roadmaps
Once a decision path has been selected through your mapping process, the next critical step is translating that theoretical path into a concrete action plan with clear responsibilities, timelines, and success metrics.
Decision Path to Implementation Roadmap
gantt
    title Implementation Timeline for Market Expansion Decision
    dateFormat  YYYY-MM-DD
    axisFormat %b %d

    section Research Phase
    Market Analysis           :done, a1, 2023-10-01, 30d
    Competitor Benchmarking   :done, a2, 2023-10-15, 20d
    Customer Surveys          :active, a3, 2023-11-01, 25d

    section Planning Phase
    Resource Allocation       :b1, after a3, 15d
    Go-to-Market Strategy     :b2, after a3, 20d
    Financial Projections     :b3, after b1, 10d

    section Execution Phase
    Initial Market Presence   :c1, after b2, 30d
    Product Localization      :c2, after b2, 25d
    Channel Development       :c3, after c1, 35d

    section Evaluation Phase
    Performance Analysis      :d1, after c3, 15d
    Strategy Refinement       :d2, after d1, 20d
Key elements to include when transforming decision maps into implementation plans:
-
1
Milestone identification - Define clear checkpoints that mark progress along the chosen path
-
2
Resource allocation - Specify the human, financial, and technological resources needed at each stage
-
3
Dependency mapping - Clarify which activities must be completed before others can begin
-
4
Decision points - Build in specific evaluation points where progress is assessed and course corrections can be made
-
5
Success metrics - Define quantifiable measures to evaluate outcomes against expectations
Creating Visual Timelines for Staged Risk-Taking
A staged approach to implementation can help manage risk by creating natural checkpoints for evaluation and potential course correction. Visual timelines help entrepreneurs and teams understand both the sequence of activities and the graduated nature of risk exposure.
Methods for Tracking Decision Outcomes and Recalibration
The entrepreneurial journey doesn't end when a decision is implemented—it evolves based on real-world feedback and outcomes. Establishing systems to track results against projections enables continuous learning and adaptation.
Decision Outcome Tracking Dashboard
Decision Recalibration Framework
- Establish tracking metrics that directly link to assumptions in your decision map
- Create measurement schedules with specific review points
- Define variance thresholds that trigger deeper analysis or recalibration
- Document learnings from each decision outcome (positive or negative)
- Update probability estimates in your decision trees based on actual outcomes
- Reassess the path forward at each major decision point
Building a Visual Decision-Making Culture
For entrepreneurs leading teams, the most powerful implementation approach involves building a culture where visual decision mapping becomes a shared practice rather than an individual tool.
Strategies for fostering a visual decision-making culture:
- Train team members in basic decision mapping techniques and visualization tools
- Create collaborative decision maps for cross-functional challenges
- Display decision trees and implementation roadmaps in shared workspaces
- Celebrate instances where visual decision frameworks led to improved outcomes
- Use decision mapping in strategic planning sessions and team retrospectives
- Develop a repository of decision maps that document organizational learning
By integrating visual decision mapping into your organization's routine processes and culture, you create a sustainable framework for more consistent, transparent, and effective strategic decision-making at all levels.
Case Studies: Decision Maps in Entrepreneurial Success Stories
Examining how successful entrepreneurs have utilized decision mapping provides valuable insights and practical lessons. These case studies reveal how structured visual decision-making can lead to breakthrough outcomes in various business contexts.

Balancing Intuition with Structured Decision-Making
Case Study: Steve Jobs and the iPhone Launch Decision
While Steve Jobs is often portrayed as a purely intuitive decision-maker, his most consequential decisions actually balanced intuition with structured analysis. The decision to develop the iPhone illustrates this approach:
flowchart TD
    A[Strategic Decision: Future of Apple] --> B{Enhance iPod Line}
    A --> C{Enter Phone Market}
    A --> D{Focus on Computers}

    B -->|"Low Risk\nIncremental Growth"| B1[Limited Innovation]
    C -->|"High Risk\nHigh Reward"| C1[Revolutionary Product]
    C -->|"Market Analysis"| C2[Disruption Potential]
    C -->|"Technical Assessment"| C3[Technical Feasibility]
    D -->|"Core Business"| D1[Stable but Limited]

    style A fill:#FFF4E6,stroke:#FF8000,stroke-width:2px
    style C fill:#F6FFED,stroke:#52C41A,stroke-width:2px
    style C1 fill:#F6FFED,stroke:#52C41A
Jobs famously said, "Innovation is not about saying yes to everything. It's about saying no to all but the most crucial features." This philosophy reflects a disciplined decision process that:
- Started with intuitive recognition of market opportunity
- Used structured evaluation of technical feasibility
- Applied systematic risk assessment of different strategic options
- Incorporated data-driven market analysis
- Included deliberate consideration of opportunity costs
The result was a calculated risk that transformed not just Apple but an entire industry—a decision that might have appeared purely intuitive but was backed by thorough structured analysis.
Visual Breakdown of Pivotal Risk Decisions
Comparison of Pivotal Business Decisions
These pivotal business decisions share common characteristics in how their decision maps were structured:
- They isolated the most critical uncertainties and focused analysis there
- They incorporated both short-term impacts and long-term strategic positioning
- They explicitly acknowledged and quantified opportunity costs
- They included contingency branches for various outcome scenarios
- They balanced financial metrics with strategic positioning considerations
Industry-Specific Approaches to Decision Mapping
Different industries face unique decision-making challenges that require specialized approaches to visual decision mapping. Understanding these industry-specific variations can help entrepreneurs adapt decision frameworks to their particular context.
| Industry | Key Decision Challenges | Specialized Mapping Approach |
|---|---|---|
| Technology Startups | Rapid market changes, technical uncertainty | Agile decision loops with frequent reassessment points |
| E-commerce | Thin margins, logistics complexity | Detailed operational decision trees with quantified cost impacts |
| Healthcare | Regulatory complexity, long development cycles | Staged-gate decision maps with compliance checkpoints |
| Financial Services | Risk management, regulatory requirements | Probabilistic risk modeling with multiple contingency paths |
| Consumer Products | Brand perception, market positioning | Customer-centric decision trees with brand impact visualization |
Learning from Entrepreneurial Failures
Failure cases can be equally instructive as success stories when properly analyzed and visualized. By mapping the decision points that led to business failures, entrepreneurs can recognize warning signs and avoid similar pitfalls.
Failure Analysis: Warning Signs Decision Tree
flowchart TD
    A[Strategic Direction] --> B{Market Validation}
    B -->|"Inadequate" red| C[Assumption-Based Development]
    B -->|"Thorough" green| D[Evidence-Based Development]

    C --> E{Cash Runway Assessment}
    E -->|"Optimistic" red| F[Accelerating Burn Rate]
    E -->|"Conservative" yellow| G[Controlled Development]

    D --> H{Competitor Response}
    H -->|"Underestimated" yellow| I[Strategic Adjustment]
    H -->|"Accurately Assessed" green| J[Sustainable Growth]

    F --> K([Business Failure])
    G --> L{Pivot Decision}
    I --> L
    J --> M([Business Success])

    L -->|"Too Late" red| K
    L -->|"Timely" green| M

    style A fill:#FFF4E6,stroke:#FF8000,stroke-width:2px
    style K fill:#FFF1F0,stroke:#FF7875,stroke-width:2px
    style M fill:#F6FFED,stroke:#52C41A,stroke-width:2px
Common decision mapping lessons from failure cases include:
- The danger of confirmation bias in early market validation
- The importance of explicit go/no-go decision criteria
- The critical nature of timing for pivot decisions
- The value of stress-testing optimistic assumptions
- The necessity of building financial runway considerations into strategic decisions
PageOn.ai's visualization tools allow entrepreneurs to recreate and analyze historical business decisions, creating powerful learning experiences that improve future decision-making. By converting complex business cases into clear visual structures, entrepreneurs can extract actionable insights and pattern recognition that might otherwise remain abstract.
Transform Your Decision-Making with PageOn.ai
Ready to elevate your entrepreneurial decision processes with powerful visual mapping tools? PageOn.ai combines intuitive visualization capabilities with advanced data integration to help you create clear, compelling decision maps that drive confident action.
Visualizing Your Path to Entrepreneurial Success
In the journey of entrepreneurship, decisions are the building blocks of success. By mastering the art and science of visual decision mapping, you equip yourself with a powerful framework for navigating uncertainty with confidence and clarity.
The methods and approaches outlined in this guide offer a comprehensive toolkit for transforming complex decision scenarios into structured visual maps that reveal insights, quantify risks, and illuminate opportunities. Whether you're evaluating market entry strategies, product development investments, or operational changes, visual decision mapping provides the structure needed to make informed choices aligned with your business goals.
PageOn.ai's visualization platform makes this process accessible and efficient, allowing entrepreneurs at any stage to create professional-quality decision maps without specialized technical knowledge. By leveraging these tools to visualize risk and reward pathways, you can communicate more effectively with stakeholders, align your team around strategic priorities, and move from analysis to confident action with greater speed and precision.
You Might Also Like
How to Design Science Lesson Plans That Captivate Students
Create science lesson plans that captivate students with hands-on activities, clear objectives, and real-world applications to foster curiosity and critical thinking.
How to Write a Scientific Review Article Step by Step
Learn how to write a review article in science step by step. Define research questions, synthesize findings, and structure your article for clarity and impact.
How to Write a Self-Performance Review with Practical Examples
Learn how to write a self-performance review with examples and tips. Use an employee performance review work self evaluation sample essay to guide your process.
How to Write a Spec Sheet Like a Pro? [+Templates]
Learn how to create a professional spec sheet with key components, step-by-step guidance, and free templates to ensure clarity and accuracy.