Global AI Competition Mapped: Visualizing Innovation Landscapes with Modern Tools
Transform complex AI competitive intelligence into clear, actionable visual insights using modern visualization tools and techniques.
The Evolution of AI Competition Intelligence
The landscape of competitive intelligence has transformed dramatically with the rise of artificial intelligence. What was once a labor-intensive process of manual data collection and analysis has evolved into sophisticated, AI-powered visualization systems that provide real-time insights.

In today's rapidly evolving technological landscape, tracking global AI innovation has become critical for strategic decision-making. Organizations without robust AI competition tracking capabilities find themselves at a significant disadvantage, unable to anticipate market shifts or identify emerging competitors.
The convergence of data visualization and competitive intelligence has created powerful new capabilities. Modern tools enable analysts to transform complex datasets into intuitive visual representations that reveal patterns, relationships, and opportunities that would remain hidden in traditional spreadsheets and reports.
Traditional vs. AI-Powered Competitor Analysis
The following chart highlights the key differences between traditional and AI-powered approaches to competitor analysis:
Traditional competitor tracking methods often fail to capture the dynamic AI landscape for several key reasons:
- They lack the speed necessary to keep pace with rapidly evolving AI capabilities
- They cannot efficiently process the massive volumes of data generated across global research, patents, and product developments
- They struggle to identify non-obvious connections between seemingly disparate developments
- They often miss emerging competitors who enter from adjacent industries
Key metrics that define meaningful AI competition visualization include comprehensive coverage across markets, technologies, and investments; real-time updating capabilities; intuitive interactive interfaces; and the ability to generate actionable insights rather than merely displaying data. The most effective visual AI tools combine these elements to create a complete competitive intelligence ecosystem.
Comprehensive Visualization Frameworks for AI Innovation
Effective AI competition tracking requires multidimensional visualization frameworks that capture the complex interplay of geographic, technological, and investment factors. These frameworks must be dynamic, interactive, and capable of integrating diverse data sources.
Three Dimensions of AI Competition
Successful visualization frameworks must address these three core dimensions:
graph TD
    AI[AI Competition Landscape] --> G[Geographic Spread]
    AI --> T[Technological Domains]
    AI --> I[Investment Patterns]

    G --> G1[Regional AI Hubs]
    G --> G2[Country-level Leaders]
    G --> G3[Institutional Clusters]

    T --> T1[Foundation Models]
    T --> T2[Computer Vision]
    T --> T3[NLP/Generative AI]
    T --> T4[Specialized Applications]

    I --> I1[Venture Capital]
    I --> I2[Corporate Investment]
    I --> I3[Government Funding]
    I --> I4[Research Grants]

    style AI fill:#FF8000,stroke:#FF8000,color:white
    style G fill:#66BB6A,stroke:#66BB6A,color:white
    style T fill:#42A5F5,stroke:#42A5F5,color:white
    style I fill:#EC407A,stroke:#EC407A,color:white
Creating interactive dashboards that track real-time shifts in global AI development enables stakeholders to identify emerging trends as they happen. These dashboards typically combine multiple visualization types—maps for geographic data, network graphs for relationships, timelines for developments, and comparative charts for benchmarking.

The most effective visualization techniques transform complex AI benchmarking data into actionable insights through:
- Comparative radar charts showing relative strengths across different AI capabilities
- Heat maps that highlight geographic concentrations of AI innovation
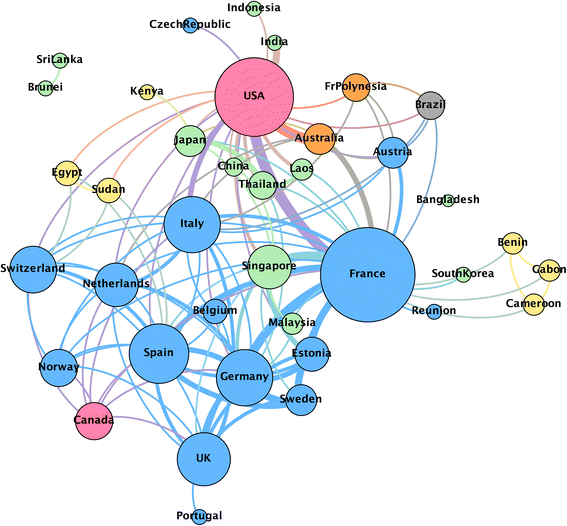
- Network graphs revealing collaboration patterns between organizations
- Temporal visualizations tracking the evolution of specific AI domains over time
Building integrated views that connect patents, research papers, product launches, and market adoption provides a comprehensive picture of the competitive landscape. By visualizing these connections, organizations can identify which academic breakthroughs are translating into commercial applications and which companies are most effectively converting research into market advantage.
PageOn.ai's AI Blocks enable fluid combination of disparate data sources into coherent visual narratives. This modular approach allows users to rapidly assemble customized visualization dashboards that precisely match their specific competitive intelligence needs, without requiring specialized data science or design skills.
Key Visualization Tools for Different AI Competitive Dimensions
Different aspects of AI competition require specialized visualization tools. We'll explore the most effective solutions for marketx intelligence, technical innovation, and investment flow visualization.
Market Intelligence Visualization Tools
Tools like Panoramata, Kompyte, and Crayon AI offer powerful solutions for visualizing competitor digital footprints. These platforms track competitive activity across multiple digital channels and transform this data into intuitive visualizations that highlight strategic patterns and opportunities.
Market Intelligence Visualization Capabilities Comparison
Approaches for visualizing market share, growth trajectories, and competitive positioning include:
- Bubble charts that represent market share, growth rate, and investment level simultaneously
- Motion charts that track positional shifts over time in two-dimensional competitive spaces
- Perceptual maps that visualize brand positioning based on key attributes
- Market penetration heat maps showing regional adoption patterns
PageOn.ai's Deep Search can integrate real-time market intelligence into visual frameworks by continuously monitoring news, social media, and industry publications. This capability ensures that competitive visualizations remain current without requiring manual updates, a critical feature in the fast-moving AI landscape.
Technical Innovation Visualization Systems
Patent landscape visualization tools and techniques provide critical insights into the formal innovation ecosystem. These tools create visual representations of patent filings across companies, technologies, and geographies, revealing concentration areas, white spaces, and emerging trends.

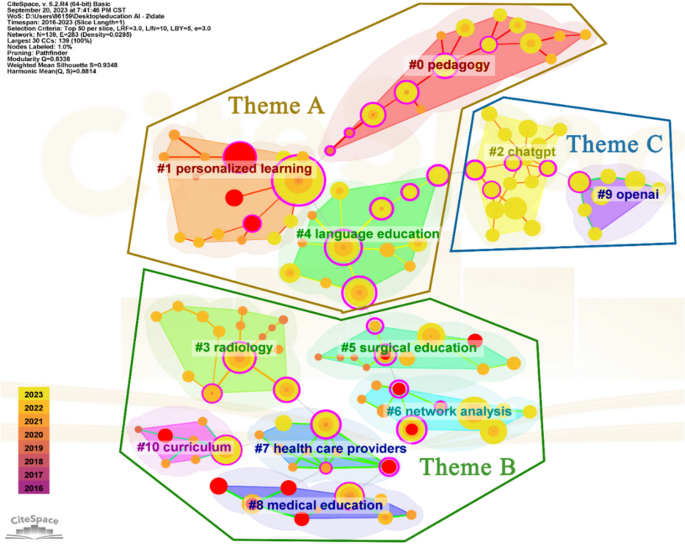
Research output mapping across institutions and countries provides complementary insights into the academic foundations of AI innovation. Citation network visualizations, institutional collaboration maps, and research topic clusters reveal the knowledge foundations being built for future commercial applications. Advanced AI mind mapping tools can automatically generate these visualizations from literature databases.
Creating visual taxonomies of emerging AI capabilities and breakthroughs helps organizations track the evolutionary paths of different technologies. These hierarchical visualizations show how foundation models branch into specialized applications, how different approaches compete to solve similar problems, and where technical convergence is occurring.
Investment Flow Visualization
AI Investment Distribution by Category (2023)
Tools for mapping venture capital and corporate investment patterns in AI reveal where financial resources are flowing and which technologies are attracting the most interest. Sankey diagrams effectively show how investment moves from sources (venture firms, corporations, governments) to recipients (startups, research institutions) across different AI domains.
Visualizing public vs. private funding across different AI domains highlights the varying roles that government and commercial entities play in different technological areas. Some domains, like foundational research, rely heavily on public funding, while others, like consumer applications, are primarily driven by private investment.
PageOn.ai enables users to generate dynamic funding flow diagrams from complex datasets. By simply uploading investment data and specifying the desired visualization type, users can create sophisticated Sankey diagrams, bubble charts, or network graphs that make investment patterns immediately apparent without requiring specialized data visualization expertise. The platform's ai powered growth charts make complex financial data immediately accessible.
From Data to Insight: Building Actionable AI Competition Visualizations
Transforming raw competitive data into strategic visual narratives requires a methodical approach that combines technical visualization skills with domain expertise and strategic thinking.
The Data-to-Insight Transformation Process
Effective visualization follows this progression:
flowchart LR
    A[Raw Data Collection] --> B[Data Cleaning & Integration]
    B --> C[Pattern Identification]
    C --> D[Visual Representation]
    D --> E[Narrative Construction]
    E --> F[Actionable Insights]

    style A fill:#f0f0f0,stroke:#d0d0d0
    style B fill:#f0f0f0,stroke:#d0d0d0
    style C fill:#FFF0E0,stroke:#FF8000
    style D fill:#FFF0E0,stroke:#FF8000
    style E fill:#FF9D45,stroke:#FF8000
    style F fill:#FF8000,stroke:#FF8000,color:white
Techniques for highlighting patterns, anomalies, and emerging threats in AI competition landscapes include:
- Color coding to draw attention to significant deviations from expected patterns
- Size variations to emphasize relative importance
- Animation to show temporal changes and acceleration
- Annotations that provide context and interpretation for key data points
- Interactive filtering that allows users to focus on specific dimensions of interest
Creating customized dashboards that align with specific organizational priorities ensures that visualization efforts directly support strategic decision-making. Different stakeholders within an organization may require different views of the competitive landscape—executives may need high-level summaries, while R&D teams may require detailed technical comparisons, and business development might focus on market opportunity visualizations.

PageOn.ai enables conversation-driven creation of complex competitive visualizations. Rather than requiring users to master specialized visualization tools, PageOn.ai allows them to describe in natural language the insights they want to highlight, and the system automatically generates appropriate visualizations. For example, a user might say "Show me which companies are gaining market share in computer vision most rapidly over the past year" and receive an instant visualization of this competitive dynamic.
Best practices for visualizing different time horizons in AI competitive intelligence include:
- Short-term views (0-6 months): Focus on tactical movements, product launches, and immediate competitive responses
- Medium-term views (6-18 months): Highlight developing trends, patent applications, and early-stage research becoming commercialized
- Long-term views (18+ months): Emphasize fundamental research directions, talent concentration, and nascent technologies that may disrupt current paradigms
The most effective AI competition visualizations don't just present data—they tell a coherent story that helps stakeholders understand the competitive landscape and identify clear paths for action. This narrative approach transforms visualization from a passive reporting tool into an active strategic asset that drives decision-making.
Case Studies in AI Competition Visualization
Examining how different types of organizations visualize AI competition provides valuable insights into effective approaches and best practices.
Tech Company Approaches
Leading tech companies visualize competitive AI landscapes for executive decision-making through integrated dashboards that combine external competitive intelligence with internal capability assessments. These visualizations typically focus on identifying capability gaps, tracking the speed of competitive advancements, and highlighting areas where strategic partnerships could accelerate development.
Companies in this space often employ specialized visualization approaches including:
- Capability radar charts that show relative strengths across AI domains
- Timeline visualizations that forecast competitor product launches
- Talent flow sankey diagrams showing movement of AI expertise between organizations
- Patent citation network graphs revealing technology influence patterns
Government Approaches
National AI Capability Comparison
Government approaches to mapping national AI capabilities and competitive positioning tend to focus on broader systemic factors. These visualizations often emphasize research output, talent development, infrastructure investments, and cross-sector impacts.
Key visualization approaches used by government entities include:
- Geographic heat maps showing regional concentrations of AI activity
- Network graphs connecting research institutions, companies, and government agencies
- Comparative radar charts benchmarking national capabilities against global competitors
- Resource allocation treemaps showing funding distribution across AI domains
Research Institution Methods
Research institutions visualize collaborative and competitive AI innovation networks to identify productive partnerships, track the evolution of research domains, and demonstrate impact to funding agencies. These visualizations often focus on publication patterns, citation networks, and conference participation.

Venture Capital Visualization Techniques
Venture capital firms employ specialized visualization techniques for identifying emerging AI investment opportunities. These visualizations typically focus on startup ecosystems, technology adoption curves, funding patterns, and potential exit opportunities.
Common visualization approaches include:
- Market maturity S-curves showing technology adoption phases
- Startup ecosystem maps connecting founders, companies, investors, and acquirers
- Valuation trend charts tracking valuations across funding rounds
- Comparative cohort analysis visualizations showing performance metrics across startup groups
PageOn.ai enables users to rapidly transform these complex case studies into clear visual stories. The platform's library of visualization templates for competitive intelligence allows users to select appropriate visualization types and customize them for their specific needs without requiring specialized design skills. With the latest AI tool trends 2025 incorporated into its capabilities, PageOn.ai stays ahead of the curve in visualization techniques.
Implementation Guide: Building Your AI Competition Visualization System
Creating an effective AI competition visualization framework requires careful planning, appropriate tools, and ongoing maintenance. This implementation guide outlines the essential components and strategies for success.
Core Components of an AI Competition Visualization System
flowchart TD
    A[Data Collection Layer] --> B[Data Integration Layer]
    B --> C[Analysis Layer]
    C --> D[Visualization Layer]
    D --> E[Insight Distribution Layer]

    A1[Automated Web Scraping] --> A
    A2[API Connections] --> A
    A3[Subscription Services] --> A
    A4[Internal Data] --> A

    B1[Data Cleaning] --> B
    B2[Entity Resolution] --> B
    B3[Temporal Alignment] --> B

    C1[Pattern Detection] --> C
    C2[Anomaly Identification] --> C
    C3[Trend Analysis] --> C

    D1[Interactive Dashboards] --> D
    D2[Custom Reports] --> D
    D3[Alert Visualizations] --> D

    E1[Executive Briefings] --> E
    E2[Department-Specific Views] --> E
    E3[Automated Alerts] --> E

    style A fill:#FF8000,stroke:#FF8000,color:white
    style B fill:#FF9D45,stroke:#FF8000,color:white
    style C fill:#FFA726,stroke:#FF8000,color:white
    style D fill:#FFB74D,stroke:#FF8000,color:white
    style E fill:#FFCC80,stroke:#FF8000,color:white
Essential components of an effective AI competition visualization framework include:
- Data Collection System: Automated tools for gathering competitive intelligence from multiple sources
- Data Integration Platform: Solutions for normalizing and combining data from disparate sources
- Analysis Tools: Capabilities for identifying patterns, trends, and anomalies
- Visualization Interfaces: Interactive dashboards and reporting tools
- Insight Distribution Mechanisms: Methods for delivering the right insights to the right stakeholders
Integration strategies for combining multiple data sources into unified visual interfaces include:
- API-First Approach: Prioritizing tools with robust APIs for programmatic data access
- Common Data Model: Developing a standardized representation for competitive entities and relationships
- Identity Resolution: Employing techniques to recognize the same entities across different data sources
- Temporal Alignment: Ensuring data from different sources can be accurately compared across time periods
Automation plays a critical role in maintaining up-to-date competitive visualizations. Key automation opportunities include:
- Scheduled data collection from websites, databases, and subscription services
- Automated data cleaning and normalization
- Programmatic updating of visualization dashboards
- Alert generation for significant competitive changes
- Periodic report generation and distribution

Balancing depth versus accessibility in competitive intelligence visualizations represents a key challenge. Approaches for addressing this balance include:
- Layered visualizations that allow users to "drill down" for additional detail
- Role-based views that provide appropriate levels of complexity for different users
- Progressive disclosure of information as users engage with visualizations
- Supplemental documentation and context accessible through interactive elements
PageOn.ai's agentic capabilities can transform vague competitive questions into precise visual answers. The platform understands natural language queries about competitive landscapes and automatically generates appropriate visualizations to address these questions. These AI tool trends 2025 will become increasingly important as organizations seek to democratize access to competitive intelligence.
Future Trends in AI Competition Visualization
The field of AI competition visualization continues to evolve rapidly, with several emerging trends poised to transform how organizations understand and respond to competitive dynamics.
The role of generative AI in creating dynamic competitive intelligence visuals represents one of the most significant developments. Generative AI capabilities enable:
- Automatic generation of visualizations from natural language descriptions
- Dynamic adaptation of visuals based on user feedback and preferences
- Creation of synthetic datasets to fill gaps in competitive intelligence
- Generation of multiple visualization alternatives for the same data
Emerging Trends in AI Competition Visualization
Emerging techniques for visualizing ethical and regulatory dimensions of AI competition reflect growing awareness of these factors as competitive differentiators. These visualizations track:
- Compliance with emerging AI regulations across jurisdictions
- Ethical frameworks employed in AI development
- Transparency practices and documentation standards
- Environmental impacts of AI computation resources
- Fairness and bias metrics across competitive offerings
Predictive visualization approaches for anticipating competitive moves leverage historical patterns and strategic analysis to forecast likely competitor actions. These tools combine game theory, strategic positioning analysis, and pattern recognition to generate visualizations of potential competitive futures, enabling organizations to prepare proactive responses.

Real-time data integration is transforming competitive intelligence visualization by eliminating the lag between competitive events and their visualization. Organizations can now maintain continuously updated competitive dashboards that reflect the latest developments, rather than relying on periodic manual updates. This capability is particularly valuable in the fast-moving AI landscape, where significant developments can occur daily.
PageOn.ai helps users stay ahead of visualization trends through continuously updated templates. The platform regularly incorporates new visualization techniques as they emerge, enabling users to benefit from the latest approaches without requiring specialized knowledge. Additionally, PageOn.ai's generative capabilities allow users to describe the visualization they want in natural language, and the system will create it using the most appropriate current techniques.
Transform Your AI Competition Visualization with PageOn.ai
Turn complex competitive intelligence into clear, actionable visual insights. PageOn.ai's intuitive platform helps you create stunning visualizations that reveal strategic opportunities and competitive threats without requiring specialized design skills.
Start Creating with PageOn.ai TodayConclusion
The ability to effectively visualize global AI competition and innovation has become a critical strategic capability. Organizations that excel in this area gain a significant advantage in anticipating market shifts, identifying emerging competitors, and aligning their innovation investments with the most promising opportunities.
As the AI landscape continues to evolve at an accelerating pace, visualization tools and techniques must likewise advance to capture increasingly complex competitive dynamics. The trends discussed in this guide—from generative AI visualizations to ethical dimension mapping and real-time data integration—point toward a future of increasingly sophisticated and accessible competitive intelligence visualization.
PageOn.ai is at the forefront of this evolution, providing an intuitive platform that enables organizations of all sizes to create powerful visualizations of AI competitive landscapes without requiring specialized technical expertise. By combining natural language interfaces, automated data integration, and advanced visualization capabilities, PageOn.ai democratizes access to competitive visualization tools that were previously available only to organizations with dedicated data science teams.
As you develop your approach to visualizing AI competition and innovation, consider how these advanced tools can help you transform complex data into clear strategic insights that drive effective decision-making throughout your organization.
You Might Also Like
How to Design Science Lesson Plans That Captivate Students
Create science lesson plans that captivate students with hands-on activities, clear objectives, and real-world applications to foster curiosity and critical thinking.
How to Write a Scientific Review Article Step by Step
Learn how to write a review article in science step by step. Define research questions, synthesize findings, and structure your article for clarity and impact.
How to Write a Self-Performance Review with Practical Examples
Learn how to write a self-performance review with examples and tips. Use an employee performance review work self evaluation sample essay to guide your process.
How to Write a Spec Sheet Like a Pro? [+Templates]
Learn how to create a professional spec sheet with key components, step-by-step guidance, and free templates to ensure clarity and accuracy.
