Infographic Design Mastery: Principles That Transform Brand Engagement
Unlock the power of visual storytelling to captivate your audience
I've spent years analyzing how the right visual approach can dramatically transform audience engagement. In this comprehensive guide, I'll walk you through the essential principles of infographic design that will elevate your brand's visual communication strategy and drive meaningful engagement.
The Psychology Behind Effective Infographic Design
I've found that understanding the psychological aspects of visual processing is crucial when creating infographics that truly resonate. Our brains process visual information 60,000 times faster than text, making well-designed infographics powerful tools for communication.
Visual information is processed faster and retained longer than textual information
When I create infographics, I focus on the cognitive benefits they provide over text-only content. The combination of visual elements and concise text creates dual coding in the brain, significantly improving information retention and recall.
The Cognitive Balance
I've learned that the most effective infographics strike a delicate balance between aesthetic appeal and information clarity. Too much visual stimulation creates cognitive overload, while too little fails to engage. This is where visual communication design principles become essential.
Information Retention by Content Type
PageOn.ai's visual thinking tools have revolutionized how I align my designs with audience cognitive preferences. The platform helps me analyze which visual elements will resonate most with my specific audience, ensuring my infographics don't just look good, but actually drive engagement through psychological alignment.
Foundation Elements of High-Converting Infographics
In my experience, the most successful infographics always begin with a crystal-clear purpose. Before I even open my design software, I ask myself: "What single message do I want viewers to walk away with?" This singular focus forms the cornerstone of engagement.

Strategic Color Psychology
I've found that color choices can make or break an infographic's effectiveness. Each color triggers specific emotional responses in viewers:
                    flowchart TD
                        A[Color Psychology] --> B[Red]
                        A --> C[Blue]
                        A --> D[Green]
                        A --> E[Yellow]
                        A --> F[Orange]
                        A --> G[Purple]
                        B --> B1[Excitement]
                        B --> B2[Urgency]
                        B --> B3[Passion]
                        C --> C1[Trust]
                        C --> C2[Security]
                        C --> C3[Calmness]
                        D --> D1[Growth]
                        D --> D2[Health]
                        D --> D3[Harmony]
                        E --> E1[Optimism]
                        E --> E2[Clarity]
                        E --> E3[Warmth]
                        F --> F1[Creativity]
                        F --> F2[Enthusiasm]
                        F --> F3[Energy]
                        G --> G1[Luxury]
                        G --> G2[Wisdom]
                        G --> G3[Creativity]
When selecting colors for my infographics, I always ensure they align with both the brand identity and the emotional response I want to evoke. This strategic approach to color psychology significantly impacts engagement metrics.
Typography Hierarchy
I've learned that typography is not just about choosing attractive fonts—it's about creating a clear hierarchy that guides the viewer through the content. My approach includes:
- Using no more than 2-3 font families per infographic
- Selecting fonts that maintain readability at various sizes
- Creating clear size distinctions between headings, subheadings, and body text
- Ensuring sufficient contrast between text and background
Negative Space Utilization
I've found that one of the most overlooked elements in infographic design is negative space. When used strategically, it improves visual digestion by giving the eye room to rest and process information. This is especially important when trying to create stunning infographics that don't overwhelm viewers.
PageOn.ai's AI Blocks system has transformed how I approach these foundation elements. The platform simplifies complex layout decisions while maintaining visual harmony, allowing me to focus on the strategic aspects of my design rather than getting bogged down in technical details.
Visual Hierarchy: Guiding the Viewer's Journey
I've discovered that establishing a clear visual hierarchy is essential for guiding viewers through an infographic in a logical, engaging way. Without proper hierarchy, even the most beautiful design will fail to communicate effectively.
Establishing Clear Information Flow
When I design infographics, I use several techniques to create natural information flow patterns:
                    flowchart TD
                        A[Visual Hierarchy Techniques] --> B[Size Variation]
                        A --> C[Color Contrast]
                        A --> D[Strategic Positioning]
                        A --> E[Directional Cues]
                        A --> F[Typography Weight]
                        B --> B1[Larger elements draw attention first]
                        C --> C1[Contrasting colors create focal points]
                        D --> D1[Top-left placement for primary content]
                        E --> E1[Arrows and lines guide eye movement]
                        F --> F1[Bold text signals importance]
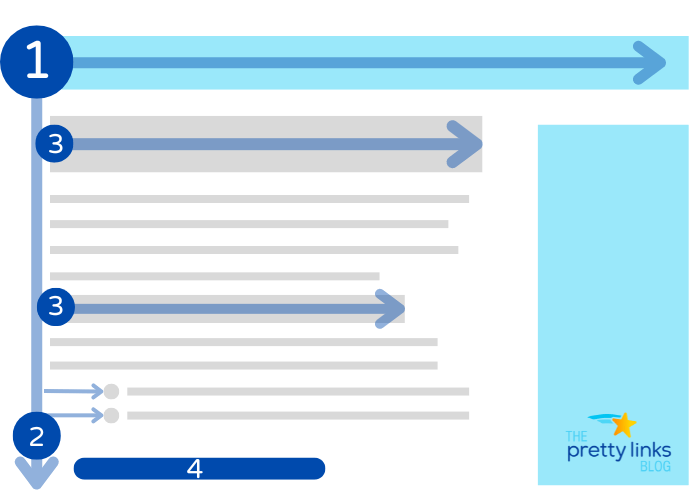
I've found that the F-pattern and Z-pattern are particularly effective for Western audiences who read from left to right. The F-pattern works well for text-heavy infographics, while the Z-pattern is ideal for more visual designs with distinct sections.
F-Pattern

Z-Pattern
Size, Contrast, and Positioning
I strategically use these elements to highlight key data points and create focal points that draw the viewer's attention to the most important information first. This approach ensures that even if someone only glances at my infographic for a few seconds, they'll still absorb the key message.
PageOn.ai's structure templates have been invaluable in my design process. They automatically establish proper visual hierarchy, saving me time while ensuring my infographics guide viewers effectively through the content. This is especially helpful when creating interactive content for marketing strategy that requires careful attention to user flow.
Data Visualization Excellence
I've learned that effective data visualization is about more than just making numbers look pretty—it's about telling a compelling story with data that resonates with your audience and drives home your key message.
Matching Chart Types to Data Stories
Selecting the right chart type is critical for effective storytelling. Here's my guide to matching visualization types with specific data needs:
Chart Selection Guide
When I'm working with complex data, I follow these simplification techniques to prevent overwhelming my audience:
- Round numbers to make them more digestible (e.g., 48.7% becomes 49%)
- Group smaller categories into an "Other" category when using pie charts
- Use progressive disclosure for complex data (reveal details on hover/click)
- Focus on the delta (change) rather than absolute values when appropriate

Interactive Elements
I've seen firsthand how adding interactive elements to infographics can dramatically increase engagement metrics. Some effective approaches include:
- Hover states that reveal additional information
- Click-to-expand sections for deeper exploration
- Animated transitions between data states
- User-controlled filters to personalize the data view
PageOn.ai's Deep Search functionality has revolutionized how I integrate relevant data visualizations. The platform helps me find and incorporate data that resonates specifically with my target audience, making my infographics not just visually appealing but genuinely insightful and valuable to viewers.
Brand Consistency in Infographic Design
I've found that maintaining brand consistency across all infographics is crucial for building recognition and trust. Each visual piece should feel like it belongs to the same family while still being uniquely valuable.

Creating Visual Systems
When I develop infographics for brands, I establish visual systems that reinforce brand identity across all content. This includes:
Elements of a Brand Visual System
Consistent Iconography
I've learned that iconography is a powerful tool for brand recognition when used consistently. My approach includes:
- Maintaining the same style and weight across all icons
- Using a consistent color application method (solid, outline, duo-tone)
- Ensuring proportional sizing between related icons
- Creating custom icons when necessary to maintain stylistic coherence
Color Palette Discipline
Color discipline is essential for brand recognition. I typically establish:
- Primary brand colors (used most prominently)
- Secondary palette (for supporting elements)
- Accent colors (used sparingly for emphasis)
- Functional colors (for success, warning, error states)
When working with visual personal brand story development, I've found that color consistency is particularly important for establishing a recognizable presence.
PageOn.ai has been invaluable in helping me maintain brand consistency while still allowing for creative flexibility. The platform's ability to store and apply brand guidelines ensures that every infographic I create aligns perfectly with the overall brand identity, regardless of which team member is working on it.
Mobile-First Considerations for Maximum Reach
I've observed that more than 60% of content is now consumed on mobile devices, making mobile-first design essential for infographics. Ignoring mobile optimization means potentially losing more than half your audience.

Responsive Design Principles
When I design infographics, I follow these responsive design principles:
                    flowchart TD
                        A[Mobile-First Design] --> B[Progressive Enhancement]
                        A --> C[Fluid Layouts]
                        A --> D[Breakpoints]
                        A --> E[Touch-Friendly Elements]
                        B --> B1[Start with core content for small screens]
                        B --> B2[Add complexity for larger screens]
                        C --> C1[Use relative units: %, em, rem]
                        C --> C2[Avoid fixed-width elements]
                        D --> D1[Define specific screen widths]
                        D --> D2[Adjust layout at each breakpoint]
                        E --> E1[Minimum target size: 44x44px]
                        E --> E2[Adequate spacing between elements]
Legibility Testing
I always test my infographics across multiple device sizes to ensure legibility. My checklist includes:
- Minimum font size of 16px for body text on mobile
- High contrast between text and background
- Sufficient spacing between interactive elements
- Testing with actual devices, not just browser emulators
Vertical Scrolling Optimization
For mobile-friendly infographics, I've found that optimizing for vertical scrolling is crucial:
- Reorganize horizontal layouts into vertical flows
- Place most important information at the top
- Create visual cues that encourage scrolling
- Break complex infographics into digestible sections
Mobile vs. Desktop Content Consumption
PageOn.ai has been a game-changer for my responsive infographic designs. The platform automatically adapts designs for multiple viewing contexts, saving me countless hours of manual adjustments while ensuring optimal viewing experiences across all devices.
From Concept to Completion: The Infographic Design Workflow
I've refined my infographic design process over years of professional practice. Following a structured workflow not only improves efficiency but also consistently produces higher quality results.
                    flowchart TB
                        A[Define Objectives] --> B[Research & Data Collection]
                        B --> C[Content Organization]
                        C --> D[Sketching & Wireframing]
                        D --> E[Visual Design]
                        E --> F[Review & Feedback]
                        F --> G[Revisions]
                        G --> H[Finalization]
                        H --> I[Publication]
                        I --> J[Performance Tracking]
                        A --> A1[Establish KPIs]
                        A --> A2[Define Target Audience]
                        A --> A3[Set Clear Goals]
                        B --> B1[Gather Relevant Data]
                        B --> B2[Verify Sources]
                        B --> B3[Identify Key Statistics]
                        C --> C1[Create Information Hierarchy]
                        C --> C2[Develop Narrative Flow]
                        C --> C3[Identify Visual Opportunities]
Establishing Clear Objectives
I always begin by defining specific objectives and key performance indicators (KPIs). This includes:
- Primary message or takeaway
- Target audience demographics and psychographics
- Desired audience action after viewing
- Metrics to measure success (shares, conversions, time on page)
Research and Data Gathering
Quality research is the foundation of compelling infographics. My methodology includes:
- Using primary sources whenever possible
- Cross-referencing data points for accuracy
- Looking for unexpected patterns or insights in the data
- Gathering more data than needed, then curating for impact

Sketching and Wireframing
Before diving into digital design, I always create rough sketches and wireframes to:
- Experiment with different layout options
- Establish information flow
- Identify potential visualization types for each data point
- Get stakeholder feedback before investing in detailed design
PageOn.ai's conversational creation approach has revolutionized my workflow. The platform allows me to quickly generate initial concepts through natural language prompts, streamlining the entire process from ideation to execution. This has been particularly valuable when working with tight deadlines or when exploring multiple creative directions simultaneously.
Measuring Infographic Performance
I've learned that creating beautiful infographics is only half the battle—measuring their performance is equally important for continuous improvement and demonstrating ROI.
Key Engagement Metrics
When evaluating infographic performance, I focus on these key metrics:
Infographic Performance Metrics
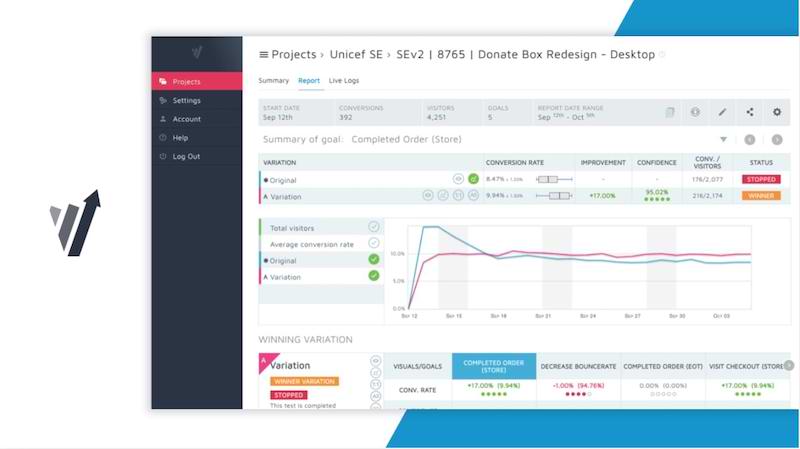
A/B Testing Methodologies
I regularly use A/B testing to optimize infographic elements. My testing approach includes:
- Testing one variable at a time (color, layout, headline, etc.)
- Ensuring sufficient sample sizes for statistical significance
- Setting clear success metrics before beginning tests
- Implementing learnings across future infographics
Analytics Integration
To track infographic performance effectively, I integrate analytics tools that provide detailed insights:
- Heat mapping to see where viewers focus attention
- Scroll depth analysis to identify engagement drop-off points
- Conversion tracking to measure bottom-line impact
- Referral tracking to identify most effective distribution channels
PageOn.ai's iterative design capabilities have transformed how I approach data-driven refinement. The platform makes it easy to implement changes based on performance data, allowing me to continuously improve my infographics based on real-world engagement metrics.
Case Studies: Brand Engagement Transformation
I've witnessed firsthand how strategic infographic design can dramatically transform brand engagement. These case studies highlight real-world examples of successful implementations.

Tech Startup Engagement Boost
A B2B software company was struggling with explaining their complex product features. By implementing the principles outlined in visual communication for designers, we transformed their approach:
Before:
- Text-heavy product explanations
- Low engagement metrics (avg. 15 seconds on page)
- 2% click-through rate to product demo
After:
- Process-focused infographic with clear visual hierarchy
- Average time on page increased to 2:45 minutes
- Click-through rate to product demo increased to 12%
- 47% increase in social shares
Healthcare Education Campaign
A healthcare provider needed to educate patients about a complex medical procedure:
Before:
- Multi-page text document with medical terminology
- High patient anxiety and confusion
- Low procedure opt-in rates
After:
- Step-by-step visual infographic with simplified explanations
- Patient-reported understanding increased by 86%
- Procedure opt-in rates increased by 34%
- Staff time explaining procedure reduced by 50%
Engagement Metrics Improvement
These case studies demonstrate the transformative power of well-designed infographics. PageOn.ai has been instrumental in helping brands transform complex information into engaging visual stories, significantly improving key performance metrics across various industries.
Future Trends in Infographic Engagement
As I look to the future of infographic design, several emerging trends are poised to transform how brands engage with their audiences through visual content.
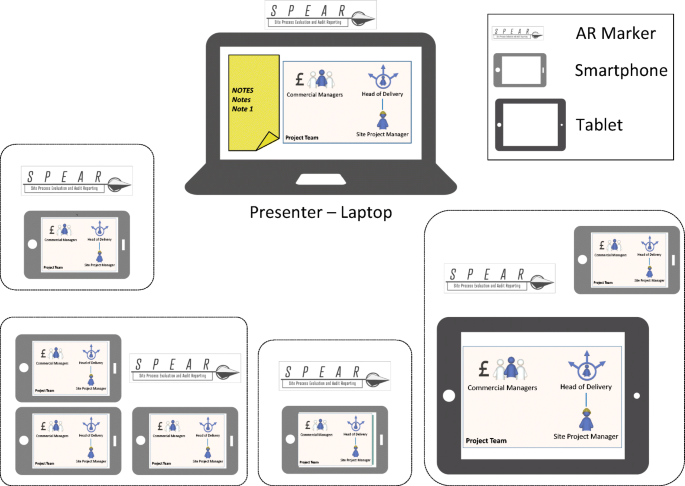
Interactive and Immersive Experiences
I'm seeing a significant shift toward interactive infographics that invite audience participation rather than passive consumption:
- Micro-interactions that respond to user behavior
- Gamified elements that increase time spent with content
- AR/VR integrations for three-dimensional data exploration
- Audio components that create multi-sensory experiences
AI-Powered Personalization
The future of infographics will be increasingly personalized through AI:
                    flowchart TD
                        A[AI-Powered Personalization] --> B[Dynamic Content]
                        A --> C[User Behavior Analysis]
                        A --> D[Contextual Adaptation]
                        A --> E[Predictive Content]
                        B --> B1[Content changes based on viewer]
                        B --> B2[Data points relevant to user]
                        C --> C1[Tracking engagement patterns]
                        C --> C2[Learning from interactions]
                        D --> D1[Adapts to viewing context]
                        D --> D2[Device-specific optimizations]
                        E --> E1[Anticipates information needs]
                        E --> E2[Suggests related content]
Accessibility Considerations
I believe the future of infographic design will place greater emphasis on accessibility:
- Alternative text layers for screen readers
- Color combinations tested for all types of color vision deficiency
- Multiple information encoding (color + shape + text) for key data points
- Keyboard-navigable interactive elements
Future Infographic Technology Adoption
PageOn.ai is at the forefront of these trends, pioneering the next generation of infographic creation tools. The platform's AI-driven approach to design is already incorporating many of these future-facing elements, making it easier than ever for brands to create cutting-edge visual content that drives meaningful engagement.
Transform Your Visual Expressions with PageOn.ai
Ready to create infographics that captivate your audience and drive meaningful engagement? PageOn.ai provides all the tools you need to transform complex information into stunning visual stories—no design experience required.
Start Creating with PageOn.ai TodayConclusion: Elevating Your Brand Through Visual Excellence
Throughout this guide, I've shared the essential principles that transform ordinary infographics into powerful brand engagement tools. From understanding the psychology behind effective design to implementing future-facing trends, these strategies will help your visual content stand out in an increasingly crowded digital landscape.
Remember that great infographic design is both an art and a science—blending creativity with data-driven decision making. By focusing on clear purpose, strategic color psychology, proper visual hierarchy, and consistent brand elements, you'll create infographics that not only look beautiful but deliver measurable business results.
As visual communication continues to evolve, tools like PageOn.ai are making it easier than ever to create professional-quality infographics without specialized design skills. By leveraging AI-powered templates, data visualization tools, and automated responsiveness, you can focus on crafting your message while the platform handles the technical details.
I encourage you to apply these principles to your next infographic project and measure the impact on your engagement metrics. The results may surprise you—and transform how you approach visual communication across your brand.
You Might Also Like
Visualizing the AI Revolution: From AlphaGo to AGI Through Key Visual Milestones
Explore the visual journey of AI evolution from AlphaGo to AGI through compelling timelines, infographics and interactive visualizations that map key breakthroughs in artificial intelligence.
The Meta-Mind Advantage: How Self-Aware AI Strategy Defines Market Leadership in 2025
Discover why metacognitive AI strategy separates industry leaders from followers in 2025. Learn frameworks for building self-aware AI implementation that drives competitive advantage.
First Principles Framework for Building Powerful AI Commands | Master AI Prompt Engineering
Learn the first principles approach to crafting powerful AI commands. Master prompt engineering with proven frameworks, templates, and visualization techniques for optimal AI interaction.
The AI Superpower Timeline: Visualizing US-China AI Race & Tech Developments
Explore the narrowing US-China AI performance gap, historical milestones, technical battlegrounds, and future projections in the global artificial intelligence race through interactive visualizations.