Building a Comprehensive MCP Implementation Roadmap Visualizer
From Concept to Deployment: Creating Clarity in Complex Protocol Integration
Model Context Protocol (MCP) represents a paradigm shift in how AI systems interact with tools, data sources, and other agents. However, implementing MCP across an organization requires careful planning and clear communication. An effective roadmap visualizer transforms abstract technical concepts into actionable implementation plans, enabling stakeholders at all levels to understand the journey ahead.
Understanding the Model Context Protocol (MCP) Landscape
The Model Context Protocol (MCP) provides a standardized framework for AI models to interact with tools, data sources, and even other AI agents. Before diving into visualization strategies, it's essential to understand the core architecture and benefits of MCP implementation.
                        flowchart TD
                            A[AI Model] <-->|MCP| B[Tools]
                            A <-->|MCP| C[Data Sources]
                            A <-->|A2A Protocol| D[Other AI Agents]

                            subgraph "MCP Benefits"
                            E[Standardized Integration]
                            F[Enhanced Interoperability]
                            G[Multi-Agent Support]
                            end

                            subgraph "Implementation Challenges"
                            H[Complex Architecture]
                            I[Security Concerns]
                            J[Version Management]
                            end
Figure 1: MCP Architecture and Relationship Overview
Evolution of MCP
MCP has evolved from a conceptual framework to a practical implementation standard across various AI platforms. Organizations like Anthropic, OpenAI, and others have embraced MCP to enhance their AI systems' capabilities through standardized tool integration.
Key Benefits of MCP Implementation
- Standardized Integration: Consistent protocols for connecting AI models with external tools
- Enhanced Tool Interoperability: Seamless interaction between models and diverse toolsets
- Multi-Agent Systems Support: Foundation for complex agent-to-agent interactions
- Scalable Architecture: Ability to grow capabilities without redesigning core systems
Protocol Ecosystem
Understanding how MCP relates to complementary protocols like Agent-to-Agent (A2A) and AG-UI is crucial for comprehensive implementation planning. Each protocol addresses specific interaction needs in the AI ecosystem.

Figure 2: MCP in the Broader Protocol Ecosystem
Without proper visualization, organizations often struggle with planning MCP implementation due to the complex relationships between components, security considerations, and the need for phased deployment approaches. A well-designed roadmap visualizer addresses these challenges by providing clarity and structure to the implementation process.
As data visualization charts become more sophisticated, they offer powerful ways to communicate the complexities of MCP implementation across organizational stakeholders, from technical teams to executive leadership.
Essential Components of an Effective MCP Roadmap Visualizer
An effective MCP implementation roadmap visualizer must capture several critical components to provide a comprehensive view of the journey ahead. These components form the foundation of any successful visualization strategy.
Core Architectural Elements
- AI Models and their capabilities
- Tool integration points
- Data source connectors
- Protocol version specifications
- Service boundaries
Connection Points
- Agent-to-tool interfaces
- Data flow pathways
- Authentication touchpoints
- Error handling mechanisms
- Cross-system boundaries
Implementation Phase Visualization Matrix
Figure 3: Implementation Phase Maturity Comparison Across Key Components
Security and Authentication Visualization
Any comprehensive MCP roadmap visualizer must include clear representations of security and authentication mechanisms. This includes visualizing:
- Authentication flow between agents and tools
- Authorization boundaries and permission models
- Data encryption points throughout the system
- Audit logging mechanisms
- Security testing and validation processes
                        flowchart TD
                            A[AI Agent] -->|Request| B[Auth Service]
                            B -->|Token| A
                            A -->|Authenticated Request + Token| C[Tool Service]
                            C -->|Validate Token| B
                            B -->|Token Valid/Invalid| C
                            C -->|Execute if Valid| D[Tool Execution]
                            D -->|Results| C
                            C -->|Response| A

                            style A fill:#FF8000,stroke:#333,stroke-width:2px
                            style B fill:#4ECDC4,stroke:#333,stroke-width:2px
                            style C fill:#FF6B6B,stroke:#333,stroke-width:2px
                            style D fill:#C7F464,stroke:#333,stroke-width:2px
Figure 4: MCP Security and Authentication Flow Visualization
Performance Monitoring and Analytics
Effective visualizations must also incorporate elements for monitoring and measuring implementation success. This includes representations of:
System Metrics
Latency, throughput, error rates, and service availability dashboards
Usage Analytics
Tool adoption, interaction patterns, and user engagement metrics
Business Impact
Efficiency gains, cost savings, and outcome improvements
Organizations implementing MCP need customization options to adapt visualizations to their specific context. By incorporating interactive visualizations for data exploration, roadmap visualizers can accommodate different organizational needs, from small startups to enterprise deployments.
Designing the Visualization Architecture
The architecture of your MCP roadmap visualization significantly impacts its effectiveness. Different approaches serve different purposes, and the right design choices can dramatically enhance understanding and engagement.
Hierarchical Visualization
                            flowchart TD
                                A[MCP Implementation] --> B[Foundation Phase]
                                A --> C[Integration Phase]
                                A --> D[Advanced Phase]

                                B --> B1[Basic Tool Integration]
                                B --> B2[Security Framework]
                                B --> B3[Data Source Connections]

                                C --> C1[Cross-System Integration]
                                C --> C2[Advanced Security]
                                C --> C3[Performance Monitoring]

                                D --> D1[Multi-Agent Orchestration]
                                D --> D2[Scalability Features]
                                D --> D3[Full Ecosystem Integration]

                                style A fill:#FF8000,stroke:#333,stroke-width:2px
Hierarchical visualizations help establish clear parent-child relationships and implementation phases.
Network-Based Visualization
Network visualizations highlight interconnections between components and show the complexity of relationships.
Color Coding Strategies
Effective color coding creates visual hierarchy and meaning within your MCP roadmap visualizations. A consistent color system helps users quickly identify component types, status, and relationships.
| Component Type | Recommended Color | Rationale |
|---|---|---|
|
AI Agents
|
Orange (#FF8000) | Represents intelligence and core components |
|
Tools & Services
|
Blue (#3B82F6) | Conveys reliability and utility |
|
Data Sources
|
Green (#10B981) | Represents information and growth |
|
Security Components
|
Red (#EF4444) | Signifies importance and protection |
|
Integration Points
|
Purple (#8B5CF6) | Highlights connection and transformation |
Temporal Progression Visualization
MCP implementation happens over time, making temporal visualization crucial for roadmap planning. Effective time-based visualizations help stakeholders understand the sequence and duration of implementation phases.
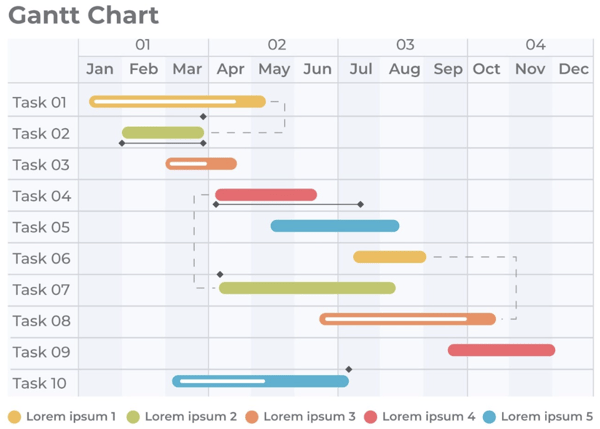
Figure 5: MCP Implementation Timeline with Milestone Indicators
Interactive Elements
Interactive elements enhance user engagement and understanding. Modern MCP roadmap visualizers should incorporate:
- Drill-down capabilities for exploring details
- Filtering options to focus on specific components
- Tooltips providing additional context
- Animation to illustrate process flows
- Linked views showing relationships between different visualization types
PageOn.ai's AI Blocks feature offers an elegant solution for creating intuitive node and connection representations. These modular components allow for clear visualization of complex relationships between MCP elements while maintaining visual consistency across your implementation documentation. The use of consistent data visualization graph tools ensures stakeholders can easily understand the relationships between different MCP components.
Technical Implementation Considerations
Building an effective MCP roadmap visualizer requires careful attention to technical details. The underlying data structures, integration capabilities, and performance considerations all impact the visualization's effectiveness.
Data Structures for Visualization
The right data structures are critical for supporting dynamic MCP visualizations. Common approaches include:
                        classDiagram
                            class MCPImplementation {
                                +String name
                                +Array phases
                                +getPhaseByName(name)
                                +addPhase(phase)
                            }

                            class Phase {
                                +String name
                                +Date startDate
                                +Date endDate
                                +Array components
                                +getProgress()
                                +addComponent(component)
                            }

                            class Component {
                                +String name
                                +String type
                                +String status
                                +Array connections
                                +addConnection(connection)
                            }

                            class Connection {
                                +Component source
                                +Component target
                                +String type
                                +Boolean isDirectional
                            }

                            MCPImplementation "1" --* "many" Phase
                            Phase "1" --* "many" Component
                            Component "1" --* "many" Connection
Figure 6: Data Model for MCP Roadmap Visualization
Integration with Knowledge Graph Tools
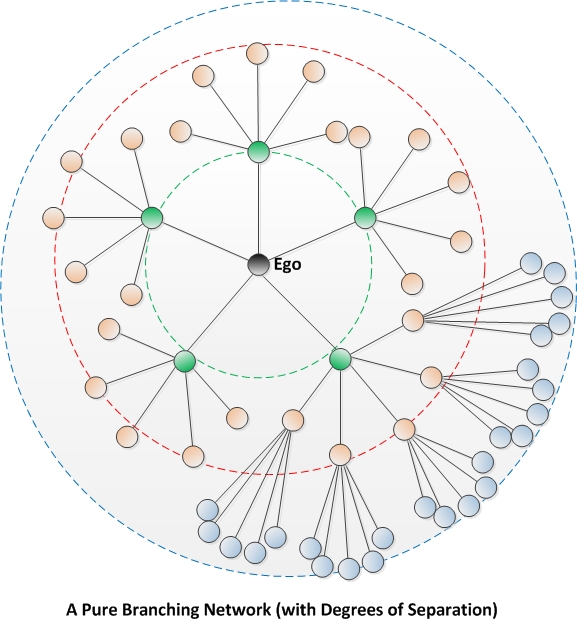
MCP implementations often involve complex relationships that are well-suited to knowledge graph visualization. Consider integration with specialized tools that can represent these relationships effectively.
Knowledge Graph Visualization Considerations
- Entity Representation: How to visually distinguish agents, tools, data sources, and other entities
- Relationship Types: Visual encoding for different relationship types (calls, returns data, authenticates with, etc.)
- Clustering: Strategies for grouping related components while maintaining visibility of cross-group connections
- Dimensionality: When to use 2D vs. 3D visualizations for complex knowledge graphs
- Filtering and Search: Mechanisms for finding specific entities or relationships within large graphs

Figure 7: Knowledge Graph Visualization of MCP Components and Relationships
API Connectors for Status Updates
Real-time implementation status updates enhance the value of MCP roadmap visualizers. API connectors can pull the latest information from:
- Project management systems tracking implementation progress
- Monitoring tools reporting on deployed components
- Version control systems indicating development status
- Testing frameworks showing validation results
- Deployment pipelines reporting on staging and production status
Performance Optimization
Complex MCP implementation diagrams can strain rendering capabilities. Consider these optimization strategies:
Figure 8: Performance Optimization Techniques for Complex MCP Visualizations
PageOn.ai's Deep Search functionality can significantly enhance MCP roadmap visualizers by incorporating relevant technical documentation directly into visualization components. This allows users to access critical information without leaving the visualization context, improving understanding and implementation accuracy.
Complex geospatial MCP deployments may benefit from specialized map-based visualizations, particularly when showing distributed agent networks or regional tool availability. Implementing map data visualization basics can help organizations effectively represent the geographical aspects of their MCP implementation.
Building Phase-Specific Visualizations
Different phases of MCP implementation require specialized visualization approaches. Each phase has unique components, relationships, and metrics that must be effectively communicated.
Foundation Phase Visualization
The foundation phase establishes the basic infrastructure for MCP implementation. Visualizations during this phase should focus on core components and initial connections.
                        flowchart TB
                            subgraph "AI Model Layer"
                            A[AI Model]
                            end

                            subgraph "MCP Layer"
                            B[MCP Interface]
                            end

                            subgraph "Tool Integration Layer"
                            C[SQL Database Tool]
                            D[Document Retrieval]
                            E[Basic Visualization Tool]
                            end

                            subgraph "Security Layer"
                            F[Authentication Service]
                            G[Authorization Rules]
                            end

                            A <--> B
                            B <--> C
                            B <--> D
                            B <--> E
                            C --- F
                            D --- F
                            E --- F
                            F --- G

                            style A fill:#FF8000,stroke:#333,stroke-width:2px
                            style B fill:#FF9A3C,stroke:#333,stroke-width:2px
                            style F fill:#EF4444,stroke:#333,stroke-width:2px
                            style G fill:#EF4444,stroke:#333,stroke-width:2px
Figure 9: MCP Foundation Phase Architecture Visualization
Key elements to visualize in the foundation phase include:
- Basic tool integration connections
- Initial data flow pathways
- Core authentication and authorization mechanisms
- Deployment architecture for foundational components
- Success metrics for validating the foundation
Integration Phase Visualization
The integration phase extends MCP capabilities across systems and introduces more sophisticated interactions. Visualizations should highlight cross-system connections and enhanced functionality.
Integration Phase Visualization Components
Cross-System Mapping
- System boundary visualizations
- Data transformation points
- Integration service connections
- API gateway mapping
Multi-Agent Coordination
- Agent communication pathways
- Task delegation visualization
- Coordination mechanism diagrams
- Agent capability profiles
Error Handling
- Fallback pathway mapping
- Error detection points
- Recovery mechanism visualization
- Reliability pattern implementation
Progress Tracking
- Integration milestone visualization
- Completion percentage indicators
- Dependency resolution tracking
- Critical path highlighting
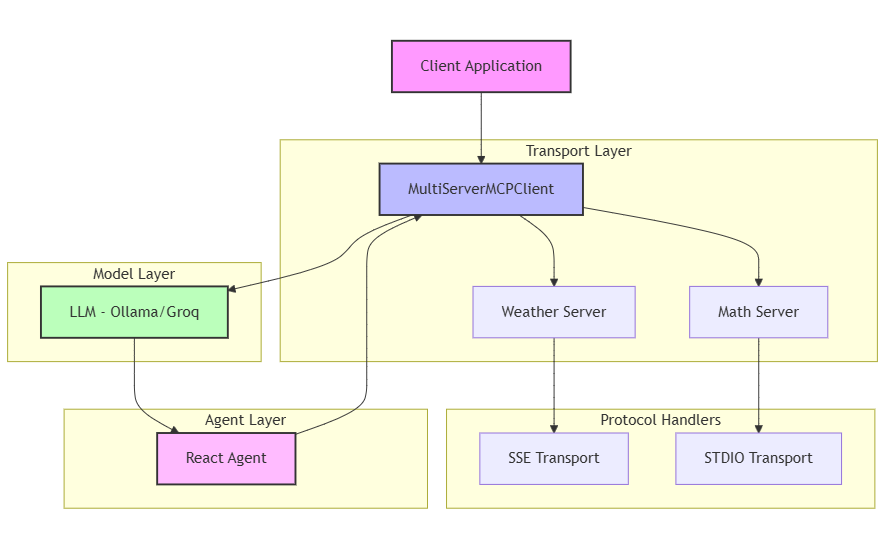
Figure 10: Cross-System Integration in the MCP Environment
Advanced Implementation Phase Visualization
The advanced phase represents a fully mature MCP implementation with sophisticated capabilities. Visualizations should capture complex interactions and optimization opportunities.
Figure 11: Advanced Phase Implementation Gap Analysis
Key components of advanced phase visualization include:
- Complex multi-system orchestration diagrams
- Comprehensive performance monitoring dashboards
- Detailed security audit maps and compliance visualization
- Extension framework architecture diagrams
- Future roadmap integration visualizations
Effective event sequencing is crucial when planning advanced MCP implementation. Using event planning templates can help organize the complex sequence of deployment activities, ensuring all implementation milestones are properly visualized and tracked.
Case Studies: MCP Implementation Visualization Success Stories
Examining real-world MCP implementation visualization approaches provides valuable insights and practical lessons. These case studies highlight successful strategies across different organizational contexts.
Anthropic's Memory MCP Knowledge Graph
Anthropic developed a sophisticated knowledge graph visualization approach for their Memory MCP implementation. This interactive tool allows developers to explore, debug, and analyze complex entity-relation networks.
Key Visualization Features:
- Interactive node exploration
- Relationship type filtering
- Temporal memory visualization
- Entity importance weighting
- Context-aware clustering
Implementation Impact:
The visualization tool reduced debugging time by 60% and improved developer understanding of complex memory structures, leading to more effective implementation.
Jan's Integration Roadmap Visualization
The Jan team created a phased roadmap visualization for their MCP implementation that effectively communicated progress and upcoming work to both technical and non-technical stakeholders.
Key Visualization Features:
- Milestone-based progress tracking
- Integration point mapping
- Capability matrix visualization
- Resource allocation diagrams
- Dependency tracking
Implementation Impact:
The visualization approach improved stakeholder alignment, accelerated decision-making, and provided a clear framework for measuring implementation progress.
Figure 12: Impact Comparison of MCP Implementation With and Without Visualization
Enterprise-Scale MCP Deployment
Large organizations face unique challenges when implementing MCP at scale. A financial services firm developed a comprehensive visualization approach that addressed multiple business units, diverse tools, and complex security requirements.
Enterprise Visualization Approach
Multi-Level Detail
Hierarchical visualizations with drill-down capabilities allowed different stakeholders to access appropriate levels of detail.
Compliance Mapping
Visual indicators for regulatory compliance status across all MCP components streamlined audit processes.
Business Impact View
Business capability maps linked to MCP components helped leadership understand implementation value.
Analytics Agent Using MCP
A data analytics startup implemented an MCP-based analytics agent with a focus on visualization-driven development. Their approach centered on visualizing the agent's connections to diverse data sources, analytics capabilities, and output generation.
                        flowchart LR
                            A[Analytics Agent] -->|Query| B[SQL Connector]
                            A -->|Document Request| C[Document Store]
                            A -->|Generate| D[Visualization Engine]

                            B -->|Connect| B1[MySQL]
                            B -->|Connect| B2[PostgreSQL]
                            B -->|Connect| B3[Snowflake]

                            C -->|Retrieve| C1[S3 Documents]
                            C -->|Retrieve| C2[SharePoint]

                            D -->|Create| D1[Charts]
                            D -->|Create| D2[Dashboards]
                            D -->|Create| D3[Reports]

                            style A fill:#FF8000,stroke:#333,stroke-width:2px
                            style D fill:#4ECDC4,stroke:#333,stroke-width:2px
                            style D1 fill:#C7F464,stroke:#333,stroke-width:2px
                            style D2 fill:#C7F464,stroke:#333,stroke-width:2px
                            style D3 fill:#C7F464,stroke:#333,stroke-width:2px
Figure 13: Analytics Agent MCP Connection Visualization
Small-Team Implementation
Not all MCP implementations happen at a large scale. A small AI research team developed a lightweight visualization approach focused on agility and rapid iteration for their MCP implementation.
Small Team Visualization Strategy
- Simplified Component Views: Focus on core functionality without excessive detail
- Iteration Tracking: Visual representation of implementation cycles and improvements
- Testing Feedback Loop: Visualization of test outcomes integrated into development view
- Resource Allocation: Clear visualization of limited resources to optimize implementation
Across these diverse case studies, a common theme emerges: organizations that invested in comprehensive visualization of their MCP implementation achieved better outcomes, faster deployment, and improved stakeholder alignment. PageOn.ai provided these organizations with powerful tools to transform complex MCP concepts into actionable visuals, significantly reducing implementation friction and accelerating time to value.
Best Practices for MCP Roadmap Visualization
Creating effective MCP roadmap visualizations requires attention to both technical and communication details. These best practices will help ensure your visualizations drive successful implementation.
Balancing Technical Detail and Clarity
One of the greatest challenges in MCP visualization is striking the right balance between technical accuracy and clarity for diverse stakeholders.
Figure 14: Appropriate Technical Detail by Audience Type
✓ Recommended Approaches
- Create layered visualizations with progressive disclosure
- Use consistent visual language across technical levels
- Provide explanatory tooltips for technical elements
- Include abstracted views for high-level stakeholders
- Maintain detailed technical documentation linked from visuals
✗ Approaches to Avoid
- Creating separate, disconnected views for different audiences
- Oversimplifying to the point of inaccuracy
- Including excessive technical jargon without explanation
- Focusing exclusively on either business or technical aspects
- Using inconsistent terminology across visualizations
Creating Living Visualizations
Effective MCP roadmap visualizations aren't static documents but living tools that evolve with the implementation. This dynamic approach ensures visualizations remain relevant throughout the project lifecycle.
                        flowchart LR
                            A[Initial Planning] --> B[Design Phase]
                            B --> C[Implementation]
                            C --> D[Testing]
                            D --> E[Deployment]
                            E --> F[Monitoring]
                            F -->|Feedback| G[Iteration]
                            G --> B

                            subgraph "Visualization Updates"
                                H[Milestone Updates]
                                I[Progress Tracking]
                                J[Issue Visualization]
                                K[Performance Metrics]
                            end

                            B --- H
                            C --- I
                            D --- J
                            F --- K

                            style A fill:#FF8000,stroke:#333,stroke-width:2px
                            style G fill:#FF8000,stroke:#333,stroke-width:2px
Figure 15: Living Visualization Update Cycle
Incorporating Feedback Mechanisms
Effective visualizations should include mechanisms for collecting and incorporating feedback, creating a continuous improvement loop for both the MCP implementation and its visualization.
- Include feedback capture elements directly within interactive visualizations
- Create visualization annotation capabilities for stakeholders
- Establish regular review sessions focused specifically on visualization effectiveness
- Track visualization usage analytics to understand which elements provide the most value
- Implement A/B testing for alternative visualization approaches when appropriate
Documentation Integration
Visualizations should complement written documentation, creating a comprehensive implementation resource ecosystem. Consider these integration strategies:
Interactive Links
Embed clickable links in visualization components that lead to relevant documentation sections.
Shared Terminology
Ensure consistent naming conventions between visualizations and technical documentation.
Visual Documentation
Use visualization components as central elements in documentation sections to enhance understanding.
Review and Validation
Regular review and validation of visualizations ensures they remain accurate and effective. Establish a structured process for:
- Technical accuracy validation by subject matter experts
- Usability testing with intended stakeholder groups
- Alignment verification with project management artifacts
- Comparison against implementation reality to identify gaps
- Cross-referencing with parallel documentation
PageOn.ai's Vibe Creation feature offers a powerful way to maintain visual consistency across MCP implementation documentation. This ensures that all visualizations share a coherent design language, making them more intuitive and effective for stakeholders at all levels.
By following these best practices, organizations can create MCP roadmap visualizations that not only communicate implementation plans effectively but also serve as valuable tools throughout the development process.
Future Trends in MCP Visualization
As MCP adoption accelerates and visualization technologies evolve, several important trends are emerging that will shape the future of MCP implementation roadmap visualization.
Figure 16: Projected Adoption of Emerging MCP Visualization Trends
Integration with Emerging AI Agent Protocols
As the ecosystem of AI agent protocols continues to expand beyond MCP, visualization approaches will need to evolve to represent increasingly complex interactions between protocols.
Emerging Protocol Integration Visualization
- Protocol Boundary Mapping: Clear visual differentiation between protocol domains
- Cross-Protocol Translation: Visualization of data transformation between protocol formats
- Protocol Capability Profiling: Visual representation of functionality available in each protocol
- Protocol Version Management: Visual tracking of compatibility across protocol versions
Advances in Interactive Visualization
Next-generation interactive visualization technologies will transform how stakeholders engage with MCP implementation roadmaps.
Virtual Reality Visualization
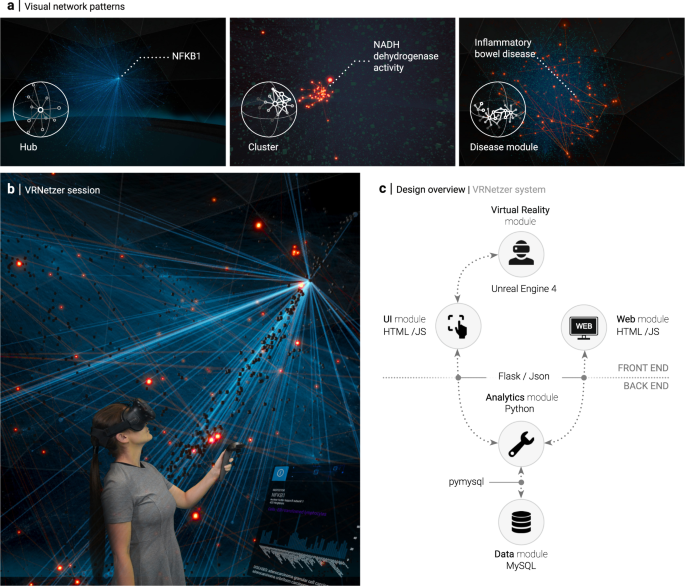
VR environments allow teams to collaboratively explore complex MCP implementations in immersive, spatially-aware interfaces.
AI-Generated Visualizations

AI systems will generate sophisticated MCP visualizations directly from technical specifications and implementation code.
Predictive Visualization
Future MCP visualization tools will incorporate predictive capabilities, helping organizations anticipate implementation challenges before they arise.
- Risk prediction based on implementation patterns and historical data
- Resource bottleneck forecasting with visual indicators
- Automated dependency impact analysis
- Performance projection based on architectural decisions
- Security vulnerability prediction from implementation design
Standardization Efforts
As MCP implementation becomes more widespread, efforts to standardize visualization approaches will accelerate, creating common visual languages for representing MCP components and relationships.
Standardization Benefits
For Organizations
- Reduced learning curve for new team members
- Easier communication with external partners
- More consistent documentation
- Simplified tool selection process
For the Ecosystem
- Accelerated knowledge sharing
- More portable visualization tools
- Enhanced interoperability
- Improved educational resources
Cross-Organization Implementation Frameworks
As organizations increasingly collaborate on AI initiatives, visualization frameworks that span organizational boundaries will become essential for coordinated MCP implementation.
                        flowchart TD
                            subgraph "Organization A"
                            A1[AI System]
                            A2[MCP Layer]
                            A3[Tool Registry]
                            end

                            subgraph "Organization B"
                            B1[AI System]
                            B2[MCP Layer]
                            B3[Tool Registry]
                            end

                            subgraph "Shared Implementation"
                            C1[Standardized Interfaces]
                            C2[Cross-Org Auth]
                            C3[Shared Tools]
                            end

                            A1 --- A2
                            A2 --- A3
                            B1 --- B2
                            B2 --- B3

                            A2 --- C1
                            B2 --- C1
                            A3 --- C3
                            B3 --- C3
                            A2 --- C2
                            B2 --- C2

                            style A1 fill:#FF8000,stroke:#333,stroke-width:2px
                            style B1 fill:#FF8000,stroke:#333,stroke-width:2px
                            style C1 fill:#4ECDC4,stroke:#333,stroke-width:2px
                            style C2 fill:#4ECDC4,stroke:#333,stroke-width:2px
                            style C3 fill:#4ECDC4,stroke:#333,stroke-width:2px
Figure 17: Cross-Organization MCP Implementation Framework
PageOn.ai's Agentic capabilities represent the cutting edge of roadmap visualization maintenance. These intelligent features can autonomously update visualizations based on implementation changes, suggest improvements to visualization clarity, and even generate new visualization components as implementation scope evolves. This reduces the maintenance burden significantly while ensuring visualizations remain accurate and relevant throughout the MCP implementation lifecycle.
Transform Your MCP Implementation with PageOn.ai
Create stunning, interactive visualizations that transform complex MCP concepts into clear, actionable roadmaps. PageOn.ai's powerful visualization tools help you communicate implementation plans effectively across all stakeholders.
Start Creating with PageOn.ai TodayYou Might Also Like
How to Design Science Lesson Plans That Captivate Students
Create science lesson plans that captivate students with hands-on activities, clear objectives, and real-world applications to foster curiosity and critical thinking.
How to Write a Scientific Review Article Step by Step
Learn how to write a review article in science step by step. Define research questions, synthesize findings, and structure your article for clarity and impact.
How to Write a Self-Performance Review with Practical Examples
Learn how to write a self-performance review with examples and tips. Use an employee performance review work self evaluation sample essay to guide your process.
How to Write a Spec Sheet Like a Pro? [+Templates]
Learn how to create a professional spec sheet with key components, step-by-step guidance, and free templates to ensure clarity and accuracy.