Visualizing the Journey: Mapping Communication Flows in MCPs
Understanding the Query-Response Framework in Multi-Agent Systems
Explore the intricate patterns of information exchange between AI agents, from the initial query to the final response, and discover how effective visualization transforms complex communication protocols into intuitive, actionable insights.
Understanding the Query-Response Framework in MCPs
Multi-agent Conversation Protocols (MCPs) form the backbone of modern AI interaction systems. At their core, these protocols govern how different specialized AI agents communicate, process information, and collaborate to transform a user's query into a meaningful response.
Unlike traditional single-agent systems, MCPs distribute cognitive responsibilities across multiple specialized components, creating complex communication patterns that can be difficult to understand without proper visualization.
The evolution from simple query-response patterns to sophisticated multi-agent conversation protocols
The Evolution of Conversational Systems
The journey from simple query-response models to sophisticated MCP architectures reflects the growing complexity of AI systems. Early conversational models operated on direct input-output pathways, whereas modern systems employ intricate networks of specialized agents that parse, reason, retrieve, and synthesize information.
This evolution has created a need for robust visualization techniques that can accurately map these communication patterns. ChatGPT vs traditional search engines exemplifies this shift, with conversational AI systems using much more complex internal communication flows than traditional search technologies.
Why Visualization Matters
Visualizing MCP communication flows provides several critical benefits:
- Enhanced system understanding for developers and stakeholders
- Easier identification of bottlenecks and inefficiencies
- Improved collaboration between teams working on different system components
- Better documentation for complex architectures
- More effective communication of system capabilities to non-technical audiences
PageOn.ai transforms these complex MCP flows into intuitive visual maps, making the invisible communication patterns between agents visible and comprehensible.
Core Components of MCP Communication Pathways
Understanding the essential elements that make up MCP communication pathways is crucial for effective visualization. These components form the building blocks that can be assembled to represent even the most complex multi-agent systems.
flowchart TD
    User([User Query]) --> Parser[Query Parser Agent]
    Parser --> Intent[Intent Classification Agent]
    Intent --> Decision{Decision Router}
    Decision -->|Factual Query| Knowledge[Knowledge Retrieval Agent]
    Decision -->|Creative Request| Creative[Creative Generation Agent]
    Decision -->|Procedural Question| Procedure[Procedural Logic Agent]
    Knowledge --> Synthesizer[Response Synthesizer]
    Creative --> Synthesizer
    Procedure --> Synthesizer
    Synthesizer --> Format[Response Formatting Agent]
    Format --> Response([Final Response])

    classDef user fill:#FF8000,stroke:#FF6000,color:white
    classDef agent fill:#FFFFFF,stroke:#A0A0A0,color:#333333
    classDef router fill:#F8F8F8,stroke:#A0A0A0,color:#333333
    classDef output fill:#FF8000,stroke:#FF6000,color:white

    class User,Response user
    class Parser,Intent,Knowledge,Creative,Procedure,Synthesizer,Format agent
    class Decision router
Core components of a multi-agent conversation protocol with defined agent roles and routing mechanisms
Agent Roles and Responsibilities
Each agent in an MCP architecture plays a specific role in the communication chain. These roles typically include:
Input Processing Agents
Handle parsing, understanding, and classifying user queries
Routing Agents
Direct queries to appropriate specialized agents based on content
Information Retrieval Agents
Access and extract relevant information from knowledge sources
Reasoning Agents
Apply logic, inference, and problem-solving to process information
Generation Agents
Create new content or synthesize information into coherent responses
Quality Control Agents
Verify accuracy, relevance, and appropriateness of responses
Mapping these roles visually helps clarify the division of labor and information flow between components. When building complex systems, architects must consider which agent handles each responsibility and how information transitions between them.
Decision Points and Routing Mechanisms
Critical to any MCP architecture are the decision points that determine how information flows through the system. These routing mechanisms can include:
- Conditional branching based on query classification
- Priority-based routing for time-sensitive requests
- Content-based filtering to match queries with specialized agents
- Dynamic routing that adapts based on system load or performance metrics
- Feedback loops that allow for iterative refinement of responses
Modular Representation with PageOn.ai
PageOn.ai's AI Blocks feature provides an ideal solution for creating modular visual representations of agent interactions. These blocks can be:
- Color-coded by function or agent type
- Connected with directional arrows to show information flow
- Labeled with processing times to identify performance bottlenecks
- Grouped into functional clusters to represent subsystems
- Nested to represent hierarchical agent relationships
By using build knowledge graph RAG systems as building blocks, complex MCP architectures can be broken down into understandable visual components that accurately represent the system's communication patterns.
Communication Pattern Visualization Techniques
Different visualization techniques offer unique advantages when mapping MCP communication patterns. Selecting the right approach depends on the specific aspects of communication you want to highlight and the complexity of the system being visualized.
Comparative analysis of visualization approaches for MCP mapping across key evaluation criteria
Comparing Visualization Approaches
| Visualization Type | Best For | Limitations |
|---|---|---|
| Flow Diagrams |
|
|
| Network Graphs |
|
|
| Sequential Process Maps |
|
|
Visual Hierarchy and Color-Coding
Effective MCP visualizations leverage visual hierarchy and color-coding to enhance comprehension:
Color-coding and visual hierarchy representing agent priorities and relationships
- Size variations to indicate the importance or processing load of different agents
- Color schemes that group similar agent types or functions
- Line thickness to represent the bandwidth or frequency of communication
- Icon differentiation to quickly distinguish agent roles visually
- Spatial positioning to show hierarchical relationships between agents
Temporal Elements in MCP Visualization
Representing time in MCP visualizations adds crucial context to communication patterns. PageOn.ai's Deep Search can help integrate templates that effectively show:
- Processing duration at each agent node
- Total elapsed time for query resolution
- Sequential numbering to track information flow order
- Animation potential for dynamic visualization of communication flow
- Timeline integration to show parallel activities with proper synchronization
When designing MCP visualizations with temporal elements, consider using ai response generators to automatically create descriptive labels for each time-related component.
From Simple to Complex: MCP Communication Models
MCP architectures range from straightforward query-response patterns to sophisticated multi-layered systems with numerous specialized agents. Understanding this progression helps in creating appropriate visualizations for systems of varying complexity.
Basic Query-Response Pattern
sequenceDiagram
    participant User
    participant Parser
    participant Processor
    participant Generator

    User->>Parser: Submit Query
    Parser->>Processor: Parsed Query
    Processor->>Generator: Processed Information
    Generator->>User: Final Response
Simple direct routing pattern with minimal agent interaction
In this basic model, communication follows a linear path with minimal branching. The query moves through a small number of agents, each with a clearly defined role in the processing chain. This pattern is typical of early conversational AI systems and remains useful for straightforward applications with limited scope.
Cascading Agent Communication
flowchart TD
    User([User]) --> Parser[Query Parser]
    Parser --> Intent[Intent Classifier]
    Intent --> Router{Router}
    Router -->|Factual Query| KB[Knowledge Base Agent]
    Router -->|Opinion Request| Opinion[Opinion Generator]
    Router -->|Creative Request| Creative[Creative Agent]

    KB --> Fact[Fact Checker]
    KB -.-> Context[Context Provider]
    Opinion -.-> Context
    Creative -.-> Context

    Fact --> Synth[Response Synthesizer]
    Opinion --> Synth
    Creative --> Synth
    Context -.-> Synth

    Synth --> Format[Formatter]
    Format --> User

    classDef default fill:#f9f9f9,stroke:#333,stroke-width:1px
    classDef user fill:#FF8000,color:white,stroke:#FF6000
    classDef router fill:#f0f0f0,stroke:#666
    classDef support fill:#f0f0f0,stroke-dasharray: 5 5

    class User user
    class Router router
    class Context support
Cascading agent communication with intermediate processing and context sharing
Cascading systems introduce more complex routing, with specialized agents handling different query types. Intermediate processing occurs between initial understanding and final response generation. These systems often include feedback loops and context-sharing between agents, creating a more interconnected communication pattern.
This approach is common in AI discussion response generators where multiple specialized components collaborate to create nuanced, contextually appropriate replies.
Decision Tree Models for Conditional Routing

Decision tree modeling for conditional response pathways in complex query handling
Decision tree models represent systems where the communication path depends on a series of conditional evaluations. Each node represents a decision point that determines which agents receive information and how that information is processed. This pattern excels at visualizing rule-based routing systems where clear conditions determine information flow.
Parallel Processing Representation
Advanced MCP systems often process information in parallel streams, with multiple agents working simultaneously on different aspects of a query. Visualizing these parallel communications requires techniques that clearly show:
- Simultaneous processing across multiple agent pathways
- Synchronization points where parallel streams converge
- Resource allocation across concurrent processing tasks
- Priority levels that determine processing order when conflicts arise
- Fallback mechanisms when parallel processes yield conflicting results
Creating Adaptable MCP Visualizations
As MCP systems evolve, their visualizations must adapt accordingly. PageOn.ai provides tools for creating flexible visual representations that:
- Scale elegantly as new agents are added to the system
- Maintain clarity when communication patterns become more complex
- Support versioning to track architectural changes over time
- Allow for component-based updates to reflect system modifications
- Enable alternative views that emphasize different aspects of the same architecture
These adaptable visualizations ensure that as your MCP architecture grows in sophistication, your ability to understand and communicate its structure grows with it.
Real-World Applications of MCP Communication Mapping
The practical applications of MCP communication mapping extend across various domains, from enhancing system documentation to improving user understanding. Real-world implementations demonstrate how visualization transforms abstract architectures into tangible, actionable insights.
Case Study: Knowledge Graph RAG Systems
flowchart TD
    User([User Query]) --> Parser[Query Parser]
    Parser --> Embedding[Embedding Generator]
    Embedding --> KGSearch[Knowledge Graph Search]

    subgraph "Knowledge Graph RAG System"
        KGSearch --> EntityExtract[Entity Extraction]
        EntityExtract --> RelationMap[Relationship Mapping]
        RelationMap --> Relevance[Relevance Ranking]

        KGSearch -.-> KG[(Knowledge Graph)]
        EntityExtract -.-> KG
        RelationMap -.-> KG
    end

    Relevance --> Context[Context Assembler]
    Context --> LLM[Large Language Model]
    LLM --> Response[Response Generator]
    Response --> User

    classDef user fill:#FF8000,stroke:#FF6000,color:white
    classDef agent fill:#FFFFFF,stroke:#A0A0A0,color:#333333
    classDef kg fill:#E0E0E0,stroke:#A0A0A0,color:#333333

    class User user
    class KG kg
    class Parser,Embedding,KGSearch,EntityExtract,RelationMap,Relevance,Context,LLM,Response agent
Communication flow in a knowledge graph RAG system showing component interaction
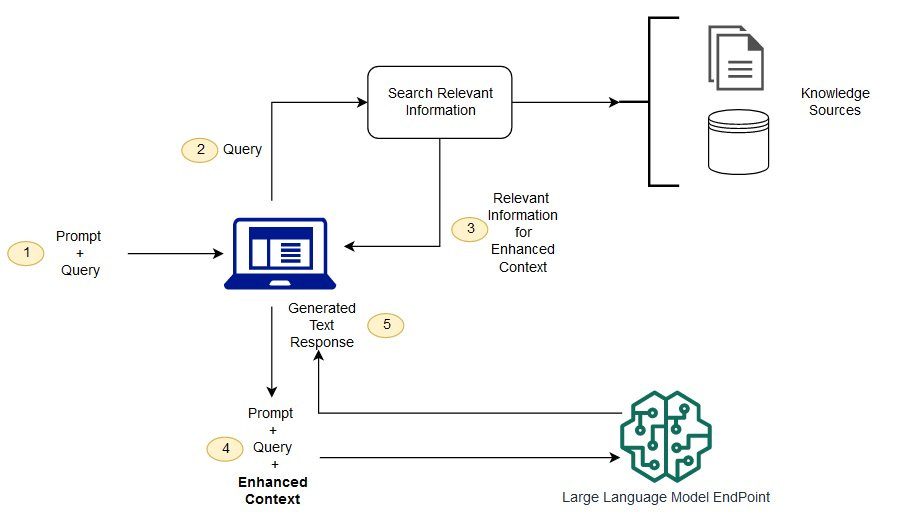
Retrieval-Augmented Generation (RAG) systems that leverage knowledge graphs represent one of the most complex MCP architectures in production today. These systems combine multiple specialized agents that extract entities, map relationships, search graph structures, and synthesize information into coherent responses.
Visualizing the communication patterns in these systems reveals key insights:
- How information flows between retrieval and generation components
- Where bottlenecks might occur in complex graph traversals
- How context is maintained throughout the query processing lifecycle
- Which components require the most computational resources
- Where optimizations would have the greatest system-wide impact
Comparing Search Engine and Conversational AI Patterns
Capability comparison between traditional search engines and conversational AI systems
The communication patterns in traditional search engines differ significantly from those in conversational AI systems. chatgpt search alternatives represent this evolution in information retrieval models, with different underlying communication architectures.
Visual mapping of these differences reveals:
- How search engines prioritize broad retrieval over deep understanding
- Where conversational systems introduce additional processing layers for context preservation
- How ranking algorithms differ from response synthesis mechanisms
- The communication overhead required for maintaining conversation history
- Different query transformation processes based on expected output format
Mapping Complexity Behind Simple Interactions
The hidden complexity behind seemingly simple AI discussion responses
One of the most valuable applications of MCP communication mapping is revealing the hidden complexity behind seemingly simple interactions. What appears to users as a straightforward discussion response actually involves sophisticated orchestration between multiple specialized agents.
Visualizing this hidden complexity serves several purposes:
- Educating stakeholders about the true sophistication of the system
- Helping developers understand dependencies between components
- Identifying potential failure points that might not be apparent from user interactions
- Supporting resource allocation decisions based on actual processing requirements
- Guiding architectural decisions for system scaling and enhancement
Transforming Technical Documentation with PageOn.ai
PageOn.ai excels at transforming complex technical MCP documentation into accessible visuals that improve understanding across organizational roles:
- Converting text-heavy system specifications into intuitive visual maps
- Creating consistent visual language for representing system components
- Generating multiple visualization perspectives for different stakeholder needs
- Updating visualizations automatically when system architecture changes
- Providing interactive explorations of complex communication patterns
These visual transformations bridge the gap between technical implementation details and high-level understanding, making MCP systems more transparent and approachable for all stakeholders.
Optimizing MCP Performance Through Visual Analysis
Beyond documentation and understanding, MCP communication visualizations serve as powerful tools for system optimization. Visual analysis can reveal inefficiencies and improvement opportunities that might remain hidden in code reviews or performance logs alone.
Identifying Communication Bottlenecks
Heat map visualization highlighting communication bottlenecks in an MCP system
Visual analysis techniques can quickly identify bottlenecks in MCP communication patterns:
- Heat mapping to highlight high-traffic or high-latency communication paths
- Time-series visualizations showing processing duration at each agent
- Queue depth indicators for agents with processing backlogs
- Resource utilization overlays showing computational load distribution
- Critical path analysis identifying rate-limiting components
Once identified, these bottlenecks can be addressed through architectural changes, resource reallocation, or component optimizations.
Spotting Redundancies and Optimization Opportunities
Processing time comparison before and after optimizing MCP communication pathways
Visual analysis can also reveal optimization opportunities such as:
- Redundant processing across multiple agents
- Unnecessary data transformations between compatible components
- Excessive back-and-forth communication that could be streamlined
- Opportunities for parallel processing where sequential steps currently exist
- Potential for agent consolidation where responsibilities overlap
Addressing these opportunities can significantly improve system responsiveness and resource efficiency.
A/B Testing Different Communication Architectures
Visual comparison of alternative MCP architectures enables data-driven optimization:
flowchart TD
    subgraph "Architecture A"
        A1[Parser] --> A2[Intent Classifier]
        A2 --> A3{Router}
        A3 -->|Type 1| A4[Specialist Agent 1]
        A3 -->|Type 2| A5[Specialist Agent 2]
        A4 --> A6[Synthesizer]
        A5 --> A6
    end

    subgraph "Architecture B"
        B1[Parser] --> B2[Universal Classifier]
        B2 --> B3[Universal Agent]
        B3 --> B4[Refiner]
    end

    classDef default fill:#f9f9f9,stroke:#333,stroke-width:1px
    classDef archA fill:#FFE0B2,stroke:#FF8000,stroke-width:1px
    classDef archB fill:#B3E5FC,stroke:#0288D1,stroke-width:1px

    class A1,A2,A3,A4,A5,A6 archA
    class B1,B2,B3,B4 archB
Side-by-side comparison of specialized vs. generalized MCP architectures for A/B testing
By creating visual representations of alternative architectures, teams can:
- Compare specialized vs. generalized agent approaches
- Evaluate different routing strategies for query processing
- Assess the impact of adding or removing processing stages
- Test hypotheses about optimal communication patterns
- Communicate architectural changes more effectively to stakeholders
Collaborative MCP Refinement with PageOn.ai
PageOn.ai facilitates collaborative optimization of MCP systems by providing:
- Shareable visual frameworks that teams can annotate and refine
- Versioning capabilities to track architectural changes over time
- Commenting features for discussing optimization proposals
- Performance metric overlays to visualize the impact of changes
- Template libraries for quickly implementing proven optimization patterns
This collaborative approach ensures that optimizations are based on shared understanding and aligned with overall system goals, rather than isolated improvements that might create unintended consequences elsewhere in the architecture.
Future Directions in MCP Communication Visualization
As multi-agent systems continue to grow in complexity and importance, the field of MCP communication visualization is rapidly evolving. Emerging trends point to exciting future developments that will further enhance our ability to understand and optimize these systems.
Emerging Visualization Standards
The field is moving toward standardized visualization approaches that will enable more consistent representation of MCP communication patterns:
- Unified icon sets for representing different agent types and functions
- Standardized connector styles for different communication protocols
- Common color schemes for representing system states and conditions
- Agreed metadata formats for enriching visual representations with performance metrics
- Interchange formats enabling visualization sharing across different tools
These emerging standards will facilitate clearer communication between teams and organizations working on similar MCP architectures.
Interactive and Dynamic MCP Maps

Interactive dashboard for real-time MCP communication visualization
The future of MCP visualization lies in interactive, dynamic maps that provide real-time insights:
- Live updates showing current system activity and communication flows
- Interactive drill-down capabilities for examining specific components
- Animated data flows representing actual system behavior
- Adaptive visibility controls for managing complexity
- Simulation capabilities for testing hypothetical scenarios
These dynamic visualizations will transform MCP maps from static documentation into active operational tools.
Predictive Modeling of Communication Patterns
Predictive modeling of response time scaling for different MCP architectures
Advanced MCP visualization tools will incorporate predictive capabilities:
- Forecasting communication bottlenecks as system load increases
- Modeling scalability characteristics of different architectural approaches
- Predicting failure points under various load and error conditions
- Suggesting optimal agent configurations for anticipated workloads
- Estimating resource requirements for future system states
These predictive visualizations will support proactive system optimization and capacity planning.
Integration of User Experience Metrics
Future MCP visualizations will incorporate user experience metrics to connect technical performance with business outcomes:
- End-to-end response time overlays showing impact on user experience
- Satisfaction score correlations with communication patterns
- Highlighting communication paths involved in low-rated interactions
- Visualization of retry patterns resulting from unsatisfactory responses
- Business impact assessments for different communication architectures
This integration will help organizations prioritize optimizations that deliver the greatest user and business value.
PageOn.ai's Evolution for Complex MCP Mapping
PageOn.ai continues to evolve its capabilities to address increasingly complex MCP mapping needs:
- AI-powered recommendations for visualization approaches based on system characteristics
- Automated translation between code/configuration and visual representations
- Dynamic complexity management that reveals details progressively
- Integrated testing and validation of visualized communication patterns
- Cross-team collaboration features for distributed development environments
By anticipating the growing complexity of multi-agent systems, PageOn.ai is positioning itself as an essential tool for organizations seeking to understand, optimize, and evolve their MCP architectures for maximum effectiveness.
Transform Your MCP Visualizations with PageOn.ai
From simple query flows to complex multi-agent architectures, PageOn.ai gives you the tools to create clear, insightful visual representations that enhance understanding and drive optimization.
Start Creating with PageOn.ai TodayThe Future of MCP Visualization
As multi-agent conversation protocols continue to grow in complexity and importance, the need for effective visualization tools becomes increasingly critical. The journey from query to response involves intricate communication patterns that require thoughtful representation to be fully understood and optimized.
By leveraging the techniques and approaches discussed in this guide, you can transform abstract MCP architectures into clear, actionable visual expressions that drive better system design, more efficient optimization, and improved stakeholder communication.
PageOn.ai stands at the forefront of this visualization revolution, providing the tools and capabilities needed to create compelling, informative visual maps of even the most sophisticated multi-agent systems. As these systems continue to evolve, so too will PageOn.ai's capabilities, ensuring that you always have access to cutting-edge visualization techniques for your MCP communication patterns.
You Might Also Like
How to Design Science Lesson Plans That Captivate Students
Create science lesson plans that captivate students with hands-on activities, clear objectives, and real-world applications to foster curiosity and critical thinking.
How to Write a Scientific Review Article Step by Step
Learn how to write a review article in science step by step. Define research questions, synthesize findings, and structure your article for clarity and impact.
How to Write a Self-Performance Review with Practical Examples
Learn how to write a self-performance review with examples and tips. Use an employee performance review work self evaluation sample essay to guide your process.
How to Write a Spec Sheet Like a Pro? [+Templates]
Learn how to create a professional spec sheet with key components, step-by-step guidance, and free templates to ensure clarity and accuracy.