Scientific Advertising in the Visual AI Age: How PageOn.ai Redefines Claude Hopkins' Timeless Principles
Transforming century-old marketing wisdom into cutting-edge visual intelligence
Claude Hopkins revolutionized advertising in 1923 with a scientific approach based on testing and measuring results. Today, PageOn.ai brings these foundational principles into the visual AI era, empowering marketers to create data-driven visual experiences that deliver measurable impact.
The Pioneering Legacy of Scientific Advertising
In 1923, Claude Hopkins published a slim volume that would forever change the world of advertising. Scientific Advertising wasn't just another book about creating clever ads—it was a revolutionary manifesto that transformed advertising from an artistic guessing game into a methodical science.
Hopkins' core thesis was radical yet simple: advertising could and should be measured, tested, and optimized based on actual results. Rather than relying on creative intuition alone, Hopkins advocated for a disciplined approach where every element of an advertisement was scrutinized for its impact on sales.
The legendary David Ogilvy famously stated that "Nobody should be allowed to have anything to do with advertising until he has read this book seven times." This wasn't hyperbole—Ogilvy recognized that Hopkins' principles formed the bedrock of effective advertising, regardless of the medium or era.
At the heart of Hopkins' philosophy was the concept of "salesmanship in print"—the idea that every advertisement should function as a salesperson, making a compelling case that drives customers to specific action. This principle hasn't lost its relevance; it has simply transformed in our visual-first digital landscape.
Core Principles of Scientific Advertising
Even a century later, Hopkins' methodologies remain strikingly relevant. The channels and formats have evolved dramatically, but the fundamental approach of testing, measuring, and optimizing based on consumer response continues to drive the most successful visual advertising techniques. As we'll explore, PageOn.ai now enables marketers to apply these time-tested principles to modern visual communication with unprecedented precision and creativity.
The Evolution from Print to Visual Intelligence
When Hopkins introduced his revolutionary testing methods in the 1920s, the advertising landscape was primarily text and print-based. His innovative use of coupons and split testing was groundbreaking—allowing advertisers to measure response rates with remarkable precision for that era.
The Evolution of Advertising Testing
timeline
    title Evolution of Advertising Testing Methods
    1923 : Scientific Advertising Published
         : Coupon-based tracking
         : Basic split testing
    1950s : Television metrics
          : Brand recall studies
    1980s : Focus groups
          : Demographic targeting
    2000s : Digital click tracking
          : Web analytics
          : A/B testing platforms
    2010s : Heat maps
          : Social engagement metrics
          : Multi-variant testing
    2023+ : AI-powered visual testing
          : Neuroscience-backed design
          : Real-time visual optimization
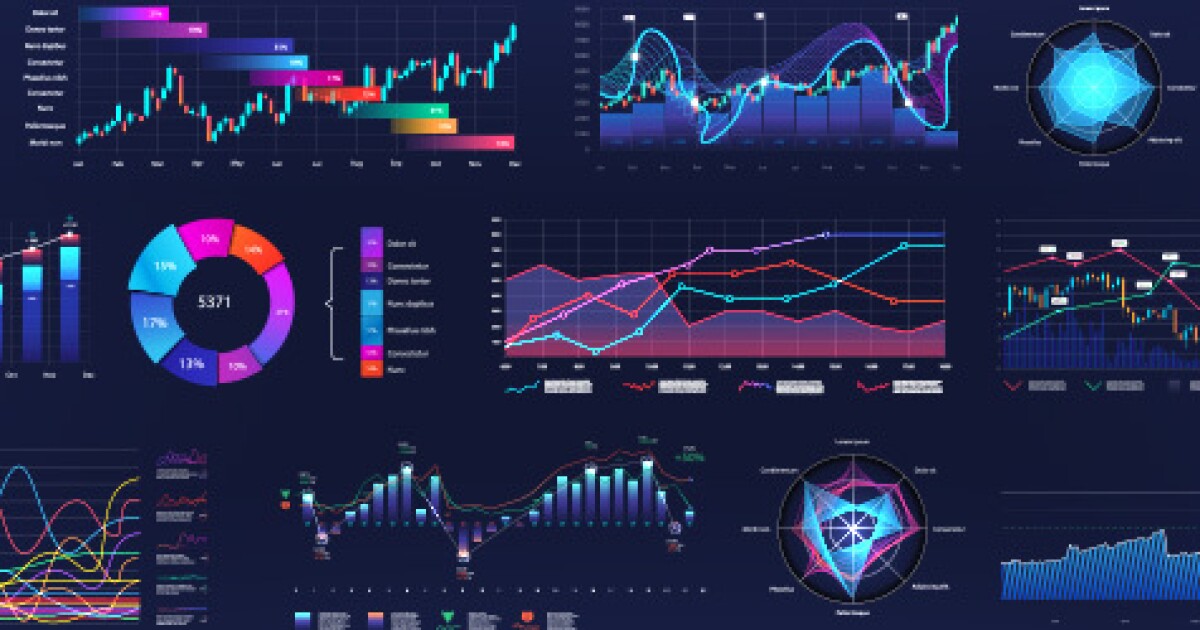
Fast-forward to today, and we've witnessed a profound shift from text-based persuasion to visual-data persuasion. Modern consumers process information visually first—making the science of visual communication more crucial than ever for effective marketing.
Where Hopkins once laboriously tracked paper coupons, PageOn.ai's AI Blocks now enable marketers to transform traditional advertising concepts into comprehensive visual systems. These systems not only communicate more effectively but also integrate sophisticated tracking mechanisms that Hopkins could only have dreamed of.
The science of visual information processing reveals why this evolution matters so much. The human brain processes visual information 60,000 times faster than text, with 90% of information transmitted to the brain being visual. When marketers leverage these biological realities through tools like PageOn.ai, they aren't abandoning Hopkins' principles—they're supercharging them.

Visual Information Processing Impact on Conversion
Reimagining Split Testing with Visual AI
Claude Hopkins is widely credited with pioneering the practice of split testing—the methodology of creating multiple versions of an advertisement to determine which performs best. This approach revolutionized marketing by providing concrete data on what works and what doesn't, reducing wasted advertising spend and maximizing returns.

Modern Visual A/B Testing
Today, PageOn.ai's Deep Search capability transforms Hopkins' split testing approach by identifying high-performing visual patterns across entire campaigns. Where Hopkins was limited to testing headline variations or copy points, modern marketers can test complex visual elements with precision.
The platform empowers marketers to implement sophisticated A/B testing for visual elements without requiring technical expertise. This democratizes access to scientific advertising principles, allowing anyone to create data-driven visual experiments regardless of their technical background.
Perhaps most importantly, PageOn.ai transforms abstract testing concepts into actionable visual experiments. This bridges the gap between Hopkins' theoretical frameworks and practical implementation in today's visual-first marketing landscape.
From Coupons to Visual Engagement Tracking
flowchart LR
    A[Hopkins' Coupon System] --> B[Send Different Coupons]
    B --> C[Track Redemptions]
    C --> D[Calculate ROI]
    D --> E[Optimize Next Campaign]

    F[PageOn Visual Tracking] --> G[Create Visual Variations]
    G --> H[Monitor Engagement Metrics]
    H --> I[AI Pattern Analysis]
    I --> J[Automated Visual Optimization]

    style A fill:#FFF1E2,stroke:#FF8000
    style B fill:#FFF1E2,stroke:#FF8000
    style C fill:#FFF1E2,stroke:#FF8000
    style D fill:#FFF1E2,stroke:#FF8000
    style E fill:#FFF1E2,stroke:#FF8000

    style F fill:#E2F5FF,stroke:#3498DB
    style G fill:#E2F5FF,stroke:#3498DB
    style H fill:#E2F5FF,stroke:#3498DB
    style I fill:#E2F5FF,stroke:#3498DB
    style J fill:#E2F5FF,stroke:#3498DB
Case Study: Converting Hopkins' methodology to modern visual engagement tracking
Visual Element Impact Analysis
Relative impact of different visual elements on audience engagement
By applying Hopkins' scientific principles to visual elements, marketers can now gather precise data on which visual approaches drive engagement and conversion. This allows for a more refined approach to market research reports and visual content strategy, creating a virtuous cycle of testing, learning, and optimization.
From "Salesmanship in Print" to "Salesmanship in Visuals"
Claude Hopkins' concept of "salesmanship in print" was revolutionary for its time—the idea that advertisements should function as surrogate salespeople, delivering persuasive messages that drive specific consumer actions. This principle remains as valid as ever, but today, it has evolved into "salesmanship in visuals."
Visual Persuasion Elements
PageOn.ai's Vibe Creation system transforms marketing messages into compelling visual stories that maintain Hopkins' emphasis on persuasion while leveraging the power of modern visual communication. This approach doesn't abandon Hopkins' principles—it amplifies them through the language most natural to today's consumers: visual storytelling.
In the context of the 4 Ps of marketing, visual salesmanship excels at highlighting unique selling propositions through visual hierarchies. By strategically arranging visual elements according to importance, marketers can guide audiences through a persuasive sequence that parallels the structure of an effective sales pitch.
The critical insight is that Hopkins' focus on measurable results remains central to this approach. Visual salesmanship isn't about creating pretty pictures—it's about crafting visual experiences that drive specific, measurable outcomes aligned with business objectives.

Visual Persuasion Framework
graph TD
    A[Visual Attention] -->|Captures Interest| B[Emotional Connection]
    B -->|Builds Desire| C[Clear Value Proposition]
    C -->|Creates Understanding| D[Visual Evidence/Proof]
    D -->|Establishes Trust| E[Clear Call to Action]
    E -->|Drives Action| F[Measurable Results]

    style A fill:#FFEDD5,stroke:#FF8000
    style B fill:#FFEDD5,stroke:#FF8000
    style C fill:#FFEDD5,stroke:#FF8000
    style D fill:#FFEDD5,stroke:#FF8000
    style E fill:#FFEDD5,stroke:#FF8000
    style F fill:#FFEDD5,stroke:#FF8000
The modern visual selling process follows Hopkins' principles of guiding prospects through a logical sequence
Comparative Effectiveness of Visual Storytelling Elements
| Visual Element | Traditional Use | Scientific Approach | Measurable Impact |
|---|---|---|---|
| Color Psychology | Based on intuition and trends | Tested against conversion metrics | 15-30% lift in engagement |
| Visual Hierarchy | Designer preference | Eye-tracking optimized | 40-60% improvement in message retention |
| Image Selection | Aesthetic judgment | A/B tested for emotional response | 25-45% increase in conversion |
| Typography | Brand guidelines | Readability and response tested | 10-20% improvement in comprehension |
| Layout Structure | Industry conventions | Heat map optimized | 30-50% reduction in bounce rate |
Data-Driven Design: The New Scientific Method
Hopkins' obsession with measurable results finds its modern equivalent in data-driven design. This approach integrates analytics, user behavior insights, and performance metrics directly into the visual creation process.
PageOn.ai's platform enables this integration by using data to inform visual storytelling decisions at every stage. Instead of creating visuals based purely on aesthetic judgment, the system incorporates performance data to guide creative choices toward proven patterns of engagement and conversion.
This approach allows marketers to integrate customer insights and market research reports directly into visual advertising elements, ensuring that visual decisions are grounded in audience preferences and behaviors.
The Data-Driven Design Process
flowchart TD
    A[Collect Data Insights] -->|Inform| B[Create Visual Hypothesis]
    B -->|Test| C[Measure Performance]
    C -->|Analyze| D[Identify Patterns]
    D -->|Optimize| E[Refine Visual Strategy]
    E -->|Scale| F[Deploy Proven Visuals]
    F -->|Monitor| A

    style A fill:#FFF1E2,stroke:#FF8000
    style B fill:#FFF1E2,stroke:#FF8000
    style C fill:#FFF1E2,stroke:#FF8000
    style D fill:#FFF1E2,stroke:#FF8000
    style E fill:#FFF1E2,stroke:#FF8000
    style F fill:#FFF1E2,stroke:#FF8000
The power of this approach lies in the continuous feedback loop between data and design. By tracking the performance of different visual approaches with precision, marketers can make informed adjustments that steadily improve results over time—a modern application of Hopkins' scientific method.
Performance Tracking Across Visual Variables
This data-driven approach to visual design embodies Hopkins' philosophy that advertising should be a science, not just an art. By applying rigorous measurement and optimization to visual elements, PageOn.ai helps marketers achieve the predictable, scalable results that Hopkins championed, but with the sophisticated visual language that today's digital landscape demands.
Practical Applications for Modern Marketers
Translating Hopkins' scientific principles into today's visual marketing landscape requires practical frameworks and tools. Here's how modern marketers can apply these timeless concepts using PageOn.ai's capabilities:
Step-by-Step Scientific Visual Advertising Framework
1. Research & Hypothesis
- Analyze existing visual performance data
- Review competitor visual approaches
- Formulate testable visual hypotheses
- Define clear success metrics
2. Visual Creation & Variation
- Use PageOn.ai to generate multiple variants
- Systematically vary specific elements
- Maintain control variables across tests
- Ensure variants address hypothesis
3. Testing Implementation
- Set up proper split testing environment
- Establish statistical significance parameters
- Implement proper tracking mechanisms
- Control for external variables
4. Data Collection & Analysis
- Gather quantitative performance metrics
- Collect qualitative feedback if relevant
- Analyze statistical significance
- Identify patterns across variations
5. Optimization & Iteration
- Implement winning visual approaches
- Develop new hypotheses based on findings
- Create enhanced versions for next tests
- Document learnings for future campaigns
6. Scaling & Systemization
- Create visual design systems based on winners
- Develop templates for proven approaches
- Build library of effective visual patterns
- Establish ongoing testing program
Industry-Specific Applications
Different industries can leverage scientific visual advertising in customized ways that address their specific challenges and opportunities:
E-commerce
Focus on product visualization optimization, testing multiple angles, contexts, and presentation styles. Implement visual split tests on product pages to determine which approaches drive higher conversion rates.
B2B Services
Test different visual representations of complex offerings, focusing on clarity and perceived value. Develop data visualizations that communicate ROI and business impact effectively.
SaaS Products
Create and test visual explanations of product functionality, focusing on benefit visualization rather than feature lists. Test different approaches to UI/UX visualization in marketing materials.

Visual Risk Management Matrix
Hopkins famously described his approach as "playing on the safe side of a hundred to one shot." This concept translates perfectly to visual marketing through a structured risk management framework:
| Risk Level | Visual Element Type | Testing Approach | Sample Size Needed |
|---|---|---|---|
| Low Risk | Minor color variations, small layout adjustments | Rapid testing, shorter duration | Smaller (500-1000 impressions) |
| Medium Risk | Image subject changes, messaging hierarchy | Standard A/B split test | Moderate (1000-5000 impressions) |
| High Risk | Complete visual rebrand, new visual identity | Extended multi-variant testing | Large (5000+ impressions) |
| Progressive | Gradual evolution of visual branding | Sequential testing with learnings applied | Cumulative across iterations |
By implementing Hopkins' customer-centric approach through personalized visual communication, modern marketers can create more relevant and impactful advertising. PageOn.ai's tools allow for the creation of visuals that adapt to different customer segments while maintaining brand consistency—enabling a scientific approach to personalization that would have impressed even Hopkins himself.
For those interested in writing about these techniques, PageOn.ai offers resources on how to write scientific review articles that can help document and share advertising case studies and findings.
The Future of Scientific Visual Advertising
As we look toward the horizon of advertising science, it's clear that AI-powered visual tools like PageOn.ai are fulfilling Hopkins' vision in ways he could never have imagined. These technologies are extending his scientific principles while dramatically increasing both the creativity and efficiency of advertising.

Emerging Technologies
The evolution of scientific advertising continues with several key technologies that extend Hopkins' testing philosophies:
- Neuroaesthetic Analysis: AI systems that can predict visual engagement based on neurological patterns
- Adaptive Visual Algorithms: Systems that automatically optimize visual elements based on real-time performance
- Multi-modal Testing: Integrated platforms that test visual, audio, and interactive elements simultaneously
- Semantic Visual Understanding: AI that comprehends the meaning and emotional impact of visual components
- Personalized Visual Experiences: Systems that adapt visuals to individual preferences and behaviors
Evolution of Advertising Testing Complexity
PageOn.ai's agentic capabilities represent a significant advancement in translating consumer psychology into visuals. These tools can analyze vast amounts of data to identify patterns in consumer response, then generate visual elements that are likely to resonate with specific audience segments—in essence, automating aspects of the scientific method that Hopkins pioneered.
Building a Sustainable Scientific Approach
The future of scientific visual advertising will require marketers to develop systems that can adapt to rapidly changing environments. PageOn.ai facilitates this through:
flowchart TD
    A[Continuous Learning Systems] -->|Feed| B[Visual Pattern Recognition]
    B -->|Inform| C[Automated Visual Generation]
    C -->|Create| D[Multivariate Testing]
    D -->|Measure| E[Performance Analysis]
    E -->|Update| A

    F[Market Changes] -->|Impact| A
    G[Consumer Behavior Shifts] -->|Modify| A
    H[Competitive Activity] -->|Influence| A
    I[New Visual Trends] -->|Transform| B

    style A fill:#FFF1E2,stroke:#FF8000
    style B fill:#FFF1E2,stroke:#FF8000
    style C fill:#FFF1E2,stroke:#FF8000
    style D fill:#FFF1E2,stroke:#FF8000
    style E fill:#FFF1E2,stroke:#FF8000

    style F fill:#E2F5FF,stroke:#3498DB
    style G fill:#E2F5FF,stroke:#3498DB
    style H fill:#E2F5FF,stroke:#3498DB
    style I fill:#E2F5FF,stroke:#3498DB
The future of scientific visual advertising lies in creating systems that can learn, adapt, and optimize automatically while maintaining the core principles that Hopkins established. With tools like PageOn.ai and a commitment to data-driven decision making, marketers can build sustainable approaches to AI marketing assistants and visual communication that will continue to evolve as technology advances and consumer behaviors change.
Transform Your Visual Expressions with PageOn.ai
Ready to apply Hopkins' scientific advertising principles to your visual marketing? PageOn.ai combines cutting-edge AI with time-tested marketing science to help you create data-driven visuals that drive measurable results.
Start Creating with PageOn.ai TodayA New Era of Scientific Visual Advertising
Claude Hopkins' revolutionary principles, first outlined in 1923, have found new life in the age of visual AI. By combining the rigorous testing methodology he championed with cutting-edge visual technologies, PageOn.ai empowers marketers to create data-driven visual expressions that deliver measurable results.
The journey from "salesmanship in print" to "salesmanship in visuals" represents not a departure from Hopkins' scientific advertising principles, but their natural evolution in a world where visual communication dominates consumer attention. Today's marketers have unprecedented tools to test, measure, and optimize visual elements with the scientific precision Hopkins advocated.
As we look to the future, the integration of AI, visual intelligence, and scientific testing methods promises to unlock even greater advertising effectiveness. By embracing these technologies while staying true to Hopkins' foundational principles, marketers can create visual advertising that resonates deeply with audiences while delivering the measurable results that have always been the hallmark of truly scientific advertising.
You Might Also Like
How to Design Science Lesson Plans That Captivate Students
Create science lesson plans that captivate students with hands-on activities, clear objectives, and real-world applications to foster curiosity and critical thinking.
How to Write a Scientific Review Article Step by Step
Learn how to write a review article in science step by step. Define research questions, synthesize findings, and structure your article for clarity and impact.
How to Write a Self-Performance Review with Practical Examples
Learn how to write a self-performance review with examples and tips. Use an employee performance review work self evaluation sample essay to guide your process.
How to Write a Spec Sheet Like a Pro? [+Templates]
Learn how to create a professional spec sheet with key components, step-by-step guidance, and free templates to ensure clarity and accuracy.