The Art of Startup Storytelling: Creating Compelling Visual Investor Narratives
Transform your complex ideas into visual stories that captivate investors and secure funding
As a founder, I've learned that having a revolutionary product isn't enough to secure investment. The difference between funded startups and those that fade away often comes down to one critical skill: the ability to tell a compelling visual story. In today's competitive landscape, investors are bombarded with pitches, making it essential to create narratives that not only inform but captivate and inspire action.
Throughout this guide, I'll share how to transform complex startup ideas into visual narratives that resonate with investors on both intellectual and emotional levels. We'll explore proven techniques for creating memorable presentations, leveraging psychology, and using modern visualization tools to showcase your startup's potential in ways that traditional pitches simply can't match.
The Psychology Behind Investor-Ready Storytelling

When I first started pitching to investors, I made the classic mistake of overwhelming them with data and technical specifications. What I didn't understand then was how the human brain processes information. Research shows that our brains are wired for stories, not statistics.
Stories create stronger neural connections than raw data alone. When investors hear a compelling narrative, their brains activate as if they're experiencing the story themselves. This is why a well-crafted story about your startup's mission can be more persuasive than even the most impressive market projections.
The Neural Impact of Storytelling vs. Data Presentation
                    flowchart TD
                        A[Raw Data Presentation] -->|Activates| B[Wernicke's Area]
                        B -->|Language Processing Only| C[Limited Neural Engagement]
                        D[Visual Storytelling] -->|Activates| E[Wernicke's Area]
                        D -->|Activates| F[Broca's Area]
                        D -->|Activates| G[Motor Cortex]
                        D -->|Activates| H[Sensory Cortex]
                        D -->|Activates| I[Emotional Centers]
                        E & F & G & H & I -->|Full Neural Synchronization| J[Deeper Memory Formation]
                        J --> K[Stronger Investment Decision]
                        style D fill:#FF8000,stroke:#333,stroke-width:2px
                        style J fill:#FF8000,stroke:#333,stroke-width:2px
                        style K fill:#FF8000,stroke:#333,stroke-width:2px
Visual narratives create particularly memorable impressions in investor meetings. When I combine storytelling with strategic visual elements, I create what neuroscientists call "sticky" memories – impressions that persist long after the pitch ends. This is crucial when investors are comparing dozens of opportunities.
Emotional Triggers in Investment Decisions
Despite what many believe, investment decisions aren't purely rational. Research in behavioral economics shows that emotions play a significant role in financial decision-making. The most effective startup one pager for investors and pitch materials tap into specific emotional triggers:
I've found that cohesive, mission-driven pitches consistently outperform purely technical presentations. When I tell a story about the problem my startup solves and the people it helps, I create an emotional connection that makes my technical innovation meaningful. As one angel investor told me, "I invest in stories I can retell – because if I can't explain your vision to my partners, I can't champion your startup."
Crafting Your Startup's Core Narrative
Every successful startup has a singular, intentional message that aligns perfectly with its focus. When I work with founders on their narratives, I always begin by asking: "If investors remember just one thing about your startup, what should it be?" This question forces clarity and intentionality.
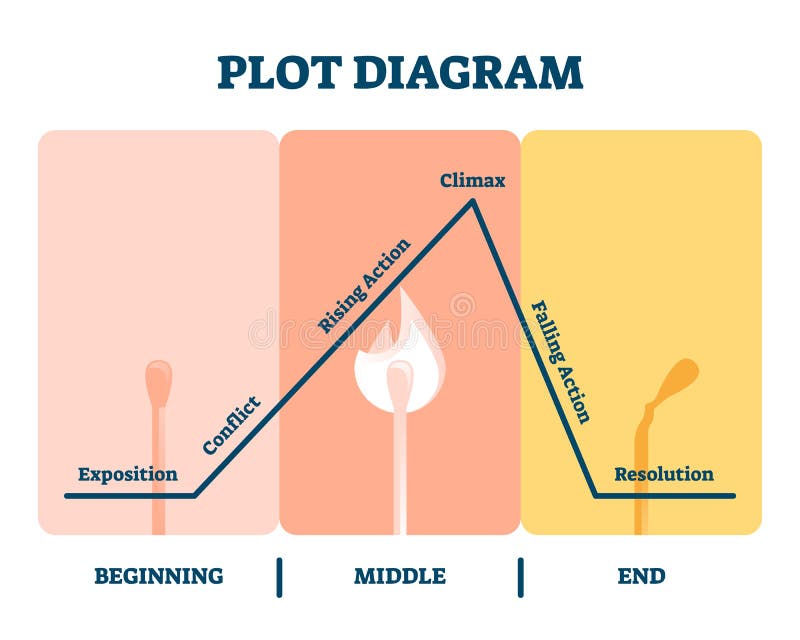
The most compelling startup narratives follow a classic story structure with three essential components:
The Narrative Arc of Successful Startup Pitches
                    flowchart LR
                        A[SETUP] -->|Problem & Context| B[CONFLICT]
                        B -->|Solution & Innovation| C[RESOLUTION]
                        subgraph SETUP ["1. SETUP (The World Today)"]
                            A1[Market Reality]
                            A2[Customer Pain]
                            A3[Status Quo Limitations]
                        end
                        subgraph CONFLICT ["2. CONFLICT (The Challenge)"]
                            B1[Technical Hurdles]
                            B2[Market Gaps]
                            B3[Existing Solution Failures]
                        end
                        subgraph RESOLUTION ["3. RESOLUTION (Your Vision)"]
                            C1[Your Innovation]
                            C2[Unique Approach]
                            C3[Market Transformation]
                        end
                        style SETUP fill:#FFF2E6,stroke:#FF8000
                        style CONFLICT fill:#FFE0CC,stroke:#FF8000
                        style RESOLUTION fill:#FFCB99,stroke:#FF8000
When transforming technical innovations into accessible stories, I focus on impact rather than process. Instead of explaining how our algorithm works, I show how it changes the user's experience. This approach makes complex technologies relatable and memorable.
Common Storytelling Pitfalls
| Pitfall | Impact on Investors | Better Approach |
|---|---|---|
| Too many storylines | Confusion, diluted message | Focus on one central narrative with supporting points |
| Technical overload | Mental fatigue, disengagement | Translate technical features into benefits and outcomes |
| Missing the "why" | Lack of emotional connection | Lead with purpose and mission before mechanics |
| No clear protagonist | Difficulty relating to the story | Center narrative on customer journey or founder's mission |
| Ignoring objections | Perceived naivety or dishonesty | Address challenges directly within your narrative |
Creating a compelling startup narrative used to take me weeks of iteration. Now, I use PageOn.ai's Vibe Creation feature to articulate my vision through conversation. The AI helps me distill complex ideas into clear, compelling language while maintaining my authentic voice. It's like having a storytelling partner who helps me find the perfect words to express my vision.
When crafting your startup pitch deck, remember that investors aren't just buying your product—they're buying your story. The narrative should make them feel like they're joining an exciting journey with tremendous potential for impact and returns.
Visualizing Your Market Opportunity
Market data alone rarely inspires investors. I've learned that transforming market statistics into visual storytelling elements creates both intellectual understanding and emotional impact. The goal is to help investors see the opportunity through a new lens.
One of the most effective approaches I've used is to visually demonstrate market gaps through compelling frameworks. Rather than simply stating that a gap exists, I show it visually:
Creating visual comparisons between current solutions and your innovation helps investors immediately grasp your competitive advantage. I find that using PageOn.ai's AI Blocks feature allows me to build logical visual progressions that show market evolution and where my startup fits in that timeline.
Competitive Landscape Visualization
                    flowchart TD
                        M[Market Need] --> E1[Existing Solution A]
                        M --> E2[Existing Solution B]
                        M --> E3[Existing Solution C]
                        E1 -->|Limitation 1| G1[Gap 1: Scalability]
                        E2 -->|Limitation 2| G2[Gap 2: Cost Efficiency]
                        E3 -->|Limitation 3| G3[Gap 3: User Experience]
                        G1 & G2 & G3 --> O[OPPORTUNITY SPACE]
                        O --> S[Our Solution]
                        S -->|Benefit 1| V1[Value Proposition 1]
                        S -->|Benefit 2| V2[Value Proposition 2]
                        S -->|Benefit 3| V3[Value Proposition 3]
                        style S fill:#FF8000,stroke:#333,stroke-width:2px
                        style O fill:#FF8000,stroke:#333,stroke-width:2px,stroke-dasharray: 5 5
When incorporating competitive landscape visuals, I'm careful to position my startup strategically without disparaging competitors. The goal is to show that I understand the market thoroughly and have identified a specific opportunity that others have missed or can't address with their current approaches. This demonstrates both market awareness and strategic thinking to investors.
From Abstract Concept to Visual Reality

One of my biggest challenges as a technical founder was explaining complex innovations to non-technical investors. I've learned that transforming technical processes into clear, engaging visuals bridges this gap effectively.
Visual metaphors are particularly powerful for making complex concepts accessible. For example, when pitching a distributed computing solution, I compared it to a beehive rather than explaining the technical architecture. This immediately conveyed the key concepts of distributed work, collaboration, and resilience.
Technical Process Visualization
                    flowchart LR
                        User((User)) -->|Inputs Problem| A[Input Processing]
                        A -->|Structured Query| B[AI Analysis Engine]
                        subgraph "Core Technology"
                            B -->|Raw Results| C{Decision Matrix}
                            C -->|Option A| D1[Processing Path 1]
                            C -->|Option B| D2[Processing Path 2]
                            C -->|Option C| D3[Processing Path 3]
                            D1 & D2 & D3 -->|Processed Data| E[Results Synthesis]
                        end
                        E -->|Optimized Solution| F[Visualization Engine]
                        F -->|Visual Output| User
                        style B fill:#FF8000,stroke:#333,stroke-width:2px
                        style C fill:#FF8000,stroke:#333,stroke-width:2px
                        style "Core Technology" fill:#FFF2E6,stroke:#FF8000,stroke-width:1px
Before/after scenarios are particularly effective for highlighting your solution's impact. I've found that showing the transformation rather than just describing it creates a much stronger impression. For example:
BEFORE: Current Process
- 12 manual steps
- 4-day processing time
- 18% error rate
- $240 cost per transaction
- Customer satisfaction: 62%
AFTER: Our Solution
- 3 automated steps
- 10-minute processing time
- 0.5% error rate
- $18 cost per transaction
- Customer satisfaction: 94%
Finding the perfect visual elements for technical concepts used to be challenging. Now I use PageOn.ai's Deep Search to quickly locate or generate exactly what I need. The tool understands the context of my technical concept and suggests visual elements that accurately represent it while remaining accessible to non-technical audiences.
Maintaining visual consistency across your narrative is crucial for reinforcing your brand and key messages. I create a simple visual language guide for each pitch that includes color meanings, icon styles, and diagram formats. This consistency helps investors absorb information more easily and creates a more professional impression. Through storytelling with data, I can transform complex technical concepts into compelling visual narratives that investors can easily understand and remember.
Data Storytelling for Investor Confidence
Financial projections are essential, but raw numbers rarely inspire investment. I've found that converting these projections into visual narratives that show growth potential creates much stronger investor confidence. The key is to show not just the what, but the why and how of your growth trajectory.
Creating visual milestones and roadmaps is another powerful technique for inspiring investor confidence. Rather than presenting a timeline as a simple list of dates, I create visual roadmaps that show the relationship between product development, market expansion, and financial outcomes.
Strategic Milestone Roadmap
                    gantt
                        title Product & Market Expansion Timeline
                        dateFormat  YYYY-MM
                        axisFormat %b %Y
                        section Product
                        MVP Release           :done, mvp, 2023-06, 30d
                        Feature Set A         :a1, 2023-07, 90d
                        Enterprise Version    :a2, after a1, 120d
                        Mobile Platform       :a3, after a2, 90d
                        section Market
                        Early Adopters        :done, m1, 2023-06, 60d
                        Industry Vertical 1   :m2, after m1, 90d
                        Industry Vertical 2   :m3, after m2, 90d
                        International Expansion :m4, 2024-06, 180d
                        section Financing
                        Seed Round Complete   :done, f1, 2023-05, 30d
                        Series A              :f2, 2023-12, 60d
                        Series B              :f3, 2024-12, 60d
Visualizing traction and early validation is particularly important for early-stage startups. When I have limited historical data, I focus on showing the quality and trajectory of what data I do have:
12
Beta Customers
94%
Problem Validation
$42K
MRR Committed
PageOn.ai has been instrumental in helping me transform spreadsheets into compelling data visualizations. I can upload my financial model and quickly generate charts and graphs that highlight key trends and insights. This saves hours of manual work and produces more visually appealing results than I could create on my own.
The balance between aspirational projections and credible visual evidence is delicate. I've learned to present ambitious goals while visually anchoring them to concrete data points and reasonable assumptions. This approach shows both vision and pragmatism—qualities investors look for in founders.
Tailoring Your Visual Narrative to Different Investor Types

Not all investors respond to the same visual narratives. I've learned that adapting visual elements for different investor types significantly improves engagement and understanding. Angel investors, venture capitalists, and strategic investors each have different priorities and perspectives.
| Investor Type | Visual Emphasis | Presentation Style |
|---|---|---|
| Angel Investors | Founder story, problem passion, early traction visuals | Personal, emotionally engaging, vision-oriented |
| Venture Capitalists | Market size, growth trajectory, competitive positioning | Data-rich, scalability focus, portfolio fit visuals |
| Strategic Investors | Integration opportunities, synergy visualizations | Industry-specific, partnership-focused diagrams |
| Impact Investors | Social/environmental impact metrics, outcome visuals | Mission-centric, outcome measurement frameworks |
Creating industry-specific visuals for specialized investors has been particularly effective in my experience. For example, when pitching to life sciences investors, I include detailed visualizations of clinical pathways and regulatory milestones. For technology investors, I focus more on technical architecture and scalability visualizations.
Developing visual narratives that address specific investor concerns has been a game-changer for my pitches. For example, if I know an investor has concerns about market size, I create detailed visualizations that break down the total addressable market into segments and show penetration strategies for each.
PageOn.ai has made it much easier to quickly customize presentations for different investor meetings. I can maintain my core narrative while adapting specific slides and visuals to address the particular interests and concerns of each investor group. This targeted approach has significantly improved my success rate in securing follow-up meetings.
Reading investor engagement with your visual story is a skill worth developing. I pay close attention to which visuals generate questions, note-taking, or follow-up discussions. This feedback helps me continuously refine my business overview pitch deck for maximum impact with each investor type.
Building a Multi-Channel Narrative Ecosystem

The most effective startup narratives extend beyond the pitch deck to create a cohesive ecosystem of storytelling assets. I've found that extending my core visual narrative across pitch decks, one-pagers, and digital presence creates a powerful multiplier effect.
Multi-Channel Narrative Ecosystem
                    flowchart TD
                        CN[Core Narrative] --> PD[Pitch Deck]
                        CN --> OP[One-Pager]
                        CN --> WP[Web Presence]
                        CN --> SM[Social Media]
                        CN --> EM[Email Sequence]
                        PD --> PM[Pitch Meeting]
                        OP --> PM
                        OP --> NI[Networking Intro]
                        WP --> DD[Due Diligence]
                        SM --> TA[Thought Leadership]
                        EM --> FR[Follow-up Relationship]
                        PM & NI & DD & TA & FR --> I[Investment]
                        style CN fill:#FF8000,stroke:#333,stroke-width:2px
                        style I fill:#FF8000,stroke:#333,stroke-width:2px
Creating cohesive visual storytelling between in-person pitches and leave-behind materials ensures that investors can easily recall and share your story. I maintain consistent visual elements, color schemes, and metaphors across all materials while adapting the depth of information to each format.
Pitch Deck
- • Full narrative arc
- • Presenter-supported visuals
- • 10-15 slides
- • Animation & build reveals
- • Discussion prompts
One-Pager
- • Condensed core message
- • Standalone visuals
- • Key metrics highlighted
- • Clear call to action
- • Contact information
Digital Presence
- • Expanded narrative depth
- • Interactive elements
- • Supporting evidence
- • Team & culture elements
- • Progress updates
Developing visual narratives that team members can consistently deliver has been crucial for scaling our fundraising efforts. I create a visual narrative guide that includes key talking points for each visual element, ensuring that any team member can effectively tell our story while maintaining a consistent message.
PageOn.ai has been invaluable for maintaining brand consistency across all storytelling assets. The platform allows me to create a visual language library that team members can access when creating new materials, ensuring that colors, icons, and visual metaphors remain consistent regardless of who creates the content.
For time-constrained environments like elevator pitches, I've developed techniques for visual storytelling that don't require actual visuals. By using vivid descriptive language and creating what I call "verbal visuals," I can paint a picture in the listener's mind that follows the same narrative structure as my visual presentations. This approach helps me maintain storytelling consistency even in spontaneous conversations with potential investors.
From Storytelling to Story-Showing: The Implementation
The most compelling evidence for visual storytelling comes from startups that have successfully secured funding through exceptional narratives. Let me share a few brief case studies that demonstrate the power of this approach:
Case Study: MedTech Startup
A medical device startup struggled to explain their complex technology to non-technical investors. After transforming their pitch into a visual narrative that focused on patient journey and outcomes rather than technical specifications, they secured $3.2M in seed funding—triple their initial target.
Key Success Factor: Before/after patient experience visualizations that made the impact immediately clear to investors.
Case Study: SaaS Platform
A B2B SaaS company was receiving lukewarm investor interest despite strong early metrics. After redesigning their narrative to visually demonstrate the market gap they were filling and the exponential efficiency gains for customers, they closed their Series A with a valuation 40% higher than initially projected.
Key Success Factor: Market positioning visualizations that clearly showed their unique advantage in a crowded space.
To transform your current pitch into a visual narrative, follow this step-by-step process:
Visual Narrative Transformation Process
                    flowchart TD
                        A[Audit Current Pitch] --> B[Identify Core Story]
                        B --> C[Map Emotional Journey]
                        C --> D[Select Key Data Points]
                        D --> E[Create Visual Framework]
                        E --> F[Develop Visual Assets]
                        F --> G[Test with Feedback]
                        G --> H[Refine & Iterate]
                        style E fill:#FF8000,stroke:#333,stroke-width:2px
                        style F fill:#FF8000,stroke:#333,stroke-width:2px
Testing and refining your visual story with real feedback is crucial. I recommend these practical exercises:
Practical Exercises
- The 30-Second Test: Show a single visual to someone unfamiliar with your startup for just 30 seconds, then ask them to explain what your company does. This tests the clarity and impact of your visual storytelling.
- The Narrative Thread Exercise: Present your visual story without any verbal explanation, then ask viewers to describe the narrative arc they perceived. This tests the logical flow of your visual elements.
- The Memory Recall Test: 24 hours after a presentation, ask viewers to recall the three most important points about your startup. This tests which visual elements create lasting impressions.
- The Objection Mapping Exercise: After presenting your visual story, ask viewers to identify any gaps or questions that weren't addressed. Use this feedback to create additional visual elements that address these concerns.
PageOn.ai's agentic capabilities have been game-changing for continuously improving my narrative. The platform analyzes audience engagement with different visual elements and suggests refinements based on what's most effective. This data-driven approach to visual storytelling has helped me optimize my pitch for maximum impact.
To implement visual storytelling in your next investor meeting, I recommend this action plan:
Your Visual Storytelling Action Plan
- Identify your singular, most compelling message (your "one thing")
- Create a visual metaphor that encapsulates this core message
- Map your current pitch to the narrative arc (setup, conflict, resolution)
- Transform your three most important data points into visual stories
- Develop a market positioning visual that shows your unique advantage
- Create a visual roadmap that connects your current traction to future milestones
- Test your visual narrative with a friendly investor and refine based on feedback
- Ensure visual consistency across all materials (pitch deck, one-pager, etc.)
- Practice delivering your visual story within different time constraints
- Continuously refine based on actual investor engagement
By implementing these visual storytelling techniques, you'll transform your startup pitch from a mere presentation of facts into a compelling narrative journey that investors can't forget. In my experience, this approach not only increases the likelihood of securing funding but also attracts investors who truly understand and believe in your vision—the kind of partners every startup needs for long-term success. Creating a visual personal brand story alongside your startup narrative can further strengthen your connection with investors, showing the authentic passion and purpose behind your business.
Transform Your Investor Narratives with PageOn.ai
Ready to create compelling visual stories that captivate investors and secure funding for your startup? PageOn.ai's intuitive platform helps you transform complex ideas into clear, engaging visual narratives without design experience.
The Power of Visual Storytelling
Throughout this guide, I've shared how visual storytelling can transform your investor pitches from forgettable presentations into compelling narratives that drive action. The journey from abstract concept to funded startup is challenging, but with the right visual storytelling techniques, you can make your vision clear, memorable, and inspiring.
Remember that investors fund stories they can believe in and retell. By crafting a visual narrative that speaks to both logic and emotion, you create the conditions for investment success. Your story isn't just about what your startup does—it's about the change you're creating in the world and why that matters.
As you implement these techniques, PageOn.ai can be your partner in creating professional, compelling visual narratives without the need for design expertise. The platform's intuitive tools make it easy to transform complex ideas into clear visual expressions that resonate with investors and drive your startup toward successful funding.
You Might Also Like
The Meta-Mind Advantage: How Self-Aware AI Strategy Defines Market Leadership in 2025
Discover why metacognitive AI strategy separates industry leaders from followers in 2025. Learn frameworks for building self-aware AI implementation that drives competitive advantage.
Strategic AI Marketing Investment Roadmap: Maximizing ROI from the $360 Billion Surge | 2025 Marketing Tech Budget Guide
Navigate the $360 billion AI investment surge with strategic marketing technology budget allocation. Discover proven frameworks for maximizing ROI from AI marketing tools in 2025.
Unleashing the Power of Agentic Workflows: Visual Clarity for Complex AI Processes
Discover how to transform complex agentic workflows into clear visual representations. Learn to design, implement and optimize AI agent processes with PageOn's visualization tools.
First Principles Framework for Building Powerful AI Commands | Master AI Prompt Engineering
Learn the first principles approach to crafting powerful AI commands. Master prompt engineering with proven frameworks, templates, and visualization techniques for optimal AI interaction.