Transforming Data Relationships: Effective Agent-to-Data Connection Mapping Templates
Reimagining how AI agents and data sources coexist in modern workflows
Discover how visual mapping frameworks can transform abstract data connections into intuitive, actionable intelligence systems. As AI agents become increasingly central to enterprise operations, the need for structured connection templates has never been more critical for successful implementation.
Understanding Agent-to-Data Connection Frameworks
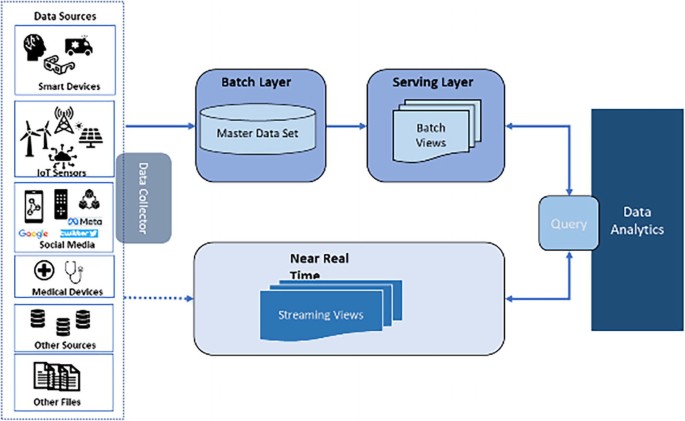
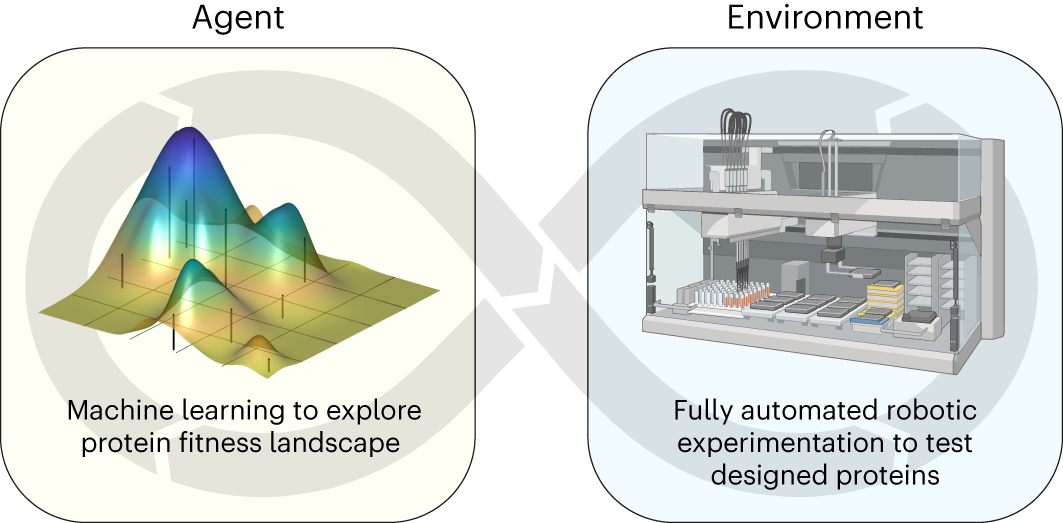
The relationship between AI agents and data sources has evolved dramatically in recent years. No longer do we simply have static data pipelines; instead, we're witnessing the emergence of dynamic, interactive ecosystems where agents actively engage with data sources to deliver insights and actions.
                    flowchart TD
                        A[AI Agent] --> B{Connection Framework}
                        B -->|Access Request| C[(Primary Data Source)]
                        B -->|Scheduled Pull| D[(Historical Data)]
                        B -->|Event Trigger| E[(Real-time Data Stream)]
                        C --> F[Data Processing]
                        D --> F
                        E --> F
                        F --> G[Response to Agent]
                        G --> A
Key Components of Successful Agent-Data Connections
- Access Protocols: Clearly defined pathways for agents to request and receive data
- Permission Structures: Granular control over what data each agent can access
- Query Translation: Systems that convert agent requests into appropriate data queries
- Response Formatting: Standardized ways to return data in agent-consumable formats
Visual mapping transforms abstract data relationships into actionable intelligence by making invisible connections visible. When data flows and access points are clearly visualized, both developers and business stakeholders gain a shared understanding of how agents interact with enterprise information systems.
The fundamental difference between traditional data pipelines and agent-interactive data ecosystems lies in directionality and initiative. While pipelines push pre-defined data in set patterns, agent-interactive systems respond to dynamic queries, adapting to changing information needs in real-time.
Core Building Blocks of Agent-Data Connection Templates
Effective connection mapping requires a foundation of essential building blocks that define how agents and data sources interact. These components create the structural framework that enables secure, efficient data exchange while maintaining appropriate oversight.
Establishing Clear Data Access Protocols
Visual frameworks provide an intuitive way to represent the rules governing how agents interact with data sources. These protocols define:
- Which data sources are accessible to specific agent types
- Authentication and authorization requirements
- Rate limiting and resource allocation
- Logging and audit trail requirements
Balancing Automation with Human Oversight
Effective agent-data relationship mapping must balance automated access with appropriate human governance. This can be achieved through:
Automation Elements
- Predefined query templates
- Automatic data format conversion
- Cached results for common queries
- Self-service access provisioning
Human Oversight Components
- Approval workflows for sensitive data
- Manual review thresholds
- Anomaly alerting systems
- Governance committees
Creating flexible permission structures within mapping templates enables organizations to implement the principle of least privilege while still allowing agents to access the data they need to be effective. These visual permission structures make complex access rules understandable at a glance, improving both security and operational efficiency.
When developing agent-data connection templates, consider how the intelligent agents industry ecosystem is evolving to understand how your templates will need to adapt to emerging standards and practices.
Designing Intuitive Agent-to-Data Connection Maps
Visual clarity in complex data relationship mapping is not merely aesthetic—it's essential for functionality. Well-designed maps enable both technical and non-technical stakeholders to understand and refine agent-data connections.
                    flowchart LR
                        subgraph "Agent Layer"
                            A1[Customer Service Agent]
                            A2[Analytics Agent]
                            A3[Compliance Agent]
                        end

                        subgraph "Connection Layer"
                            C1{Access Control}
                            C2{Query Translation}
                            C3{Response Formatting}
                        end

                        subgraph "Data Layer"
                            D1[(Customer Database)]:::criticalData
                            D2[(Transaction Records)]:::criticalData
                            D3[(Knowledge Base)]:::standardData
                            D4[(Compliance Docs)]:::restrictedData
                        end

                        A1 --> C1
                        A2 --> C1
                        A3 --> C1

                        C1 --> C2
                        C2 --> C3

                        C3 --> A1
                        C3 --> A2
                        C3 --> A3

                        C2 --> D1
                        C2 --> D2
                        C2 --> D3
                        C2 --> D4

                        classDef criticalData fill:#FF8000,stroke:#333,stroke-width:1px;
                        classDef standardData fill:#66BB6A,stroke:#333,stroke-width:1px;
                        classDef restrictedData fill:#EF5350,stroke:#333,stroke-width:1px;
Principles of Visual Clarity
Simplicity
Use the minimum necessary visual elements to convey relationships. Avoid cluttering maps with extraneous details that obscure key connections.
Consistency
Maintain consistent visual language across all connection maps. Use the same symbols, colors, and layouts for similar elements.
Hierarchy
Emphasize the most important connections visually. Critical data pathways should be immediately distinguishable from secondary connections.
Using Color-Coding and Symbolic Representation
Effective use of color and symbols creates intuitive visual languages that help users quickly understand complex relationships:
| Visual Element | Meaning | Application |
|---|---|---|
| Orange | Critical data sources | Customer data, financial records |
| Green | Standard access data | Knowledge bases, product information |
| Red | Restricted access | Compliance documents, personal data |
| Circles | Data sources | Databases, file systems, APIs |
| Squares | Agent entities | AI assistants, automation tools |
| Diamonds | Decision points | Access control, query routing |
Creating Hierarchical Structures
Hierarchical structures help prioritize critical data connections and clarify relationships between different types of data. When designing these structures, consider:
- Primary vs. secondary data sources
- Frequently vs. rarely accessed resources
- Direct vs. indirect connections
- Real-time vs. batch processing requirements
Templates that adapt to evolving data landscapes are essential in today's rapidly changing technological environment. Building flexibility into your visual mapping templates ensures they remain relevant as data sources, agents, and business requirements evolve.
From Conceptual to Practical: Implementing Connection Maps
Transforming abstract data relationship concepts into structured visual templates requires a systematic approach that bridges theoretical design with practical implementation.
                    graph TD
                        A[Identify Data Sources] --> B[Map Agent Requirements]
                        B --> C[Create Initial Connection Map]
                        C --> D[Test with Sample Queries]
                        D --> E{Successful?}
                        E -->|Yes| F[Document & Implement]
                        E -->|No| G[Refine Map]
                        G --> D
                        F --> H[Monitor & Optimize]
                        H --> I[Iterate Based on Feedback]
                        I --> C
Step-by-Step Process for Mapping Agent Queries to Data Sources
1. Audit Available Data Sources
Create a comprehensive inventory of all potential data sources, including their structure, access methods, and sensitivity levels.
2. Analyze Agent Query Patterns
Study how agents formulate queries and what types of information they typically request to identify common patterns.
3. Establish Connection Rules
Define the logic that determines which data sources should be consulted for different types of agent queries.
4. Create Visual Template
Develop the actual visual map that represents connections between agents and data sources, using consistent symbols and color codes.
5. Implement Technical Connections
Build the actual API connections, database queries, or other technical implementations that enable the mapped relationships.
6. Test and Refine
Validate the connection map with real-world queries and adjust based on performance and accuracy metrics.
Incorporating Feedback Mechanisms
Effective connection maps include feedback loops that provide data about connection success and usage patterns:
Case Studies: Organizations That Revolutionized Their Data Workflows
Financial Services Firm
Implemented agent-to-data connection maps to streamline customer service processes, resulting in 43% faster query resolution and 65% reduction in data access errors.
Healthcare Provider Network
Developed secure patient data access templates for AI assistants, improving diagnostic support while maintaining strict HIPAA compliance through visually managed permission structures.
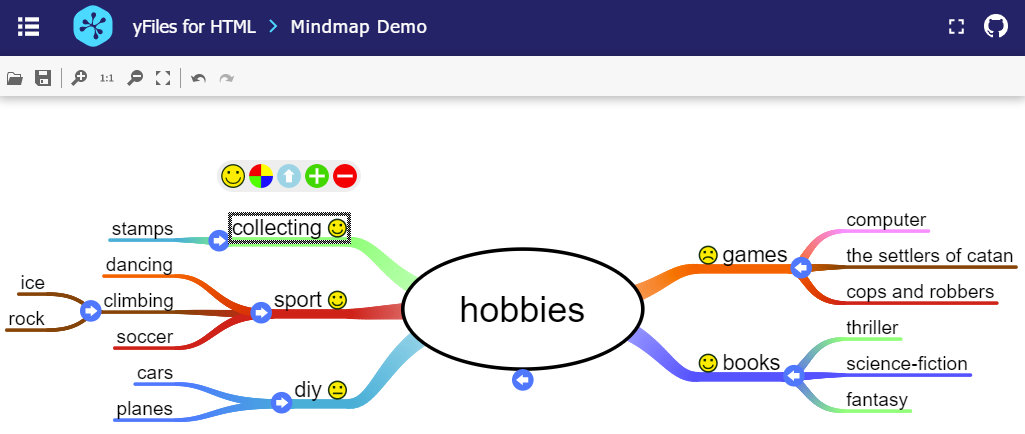
Mind Mapping Approaches for Agent-Data Integration
Mind mapping techniques offer powerful frameworks for visualizing and organizing complex agent-data relationships. By leveraging AI mind mapping tools, organizations can create intuitive visual representations that make data connections more comprehensible.
Techniques for Clustering Related Data Sources
Effective mind mapping for agent-data relationships often relies on intelligent clustering of related data sources:
- Domain-Based Clustering: Grouping data sources by business domain or function
- Agent-Centric Organization: Arranging data sources based on which agents typically need them
- Data Type Clustering: Grouping similar types of data (structured, unstructured, real-time, historical)
- Access Pattern Grouping: Organizing based on frequency and nature of access patterns
                    mindmap
                        root((Customer Service Agent))
                            Customer Data
                                Profile Information
                                Purchase History
                                Contact Records
                            Knowledge Base
                                Product Specifications
                                Common Issues
                                Resolution Guides
                            Internal Systems
                                Order Management
                                Returns Processing
                                Shipping Status
                            External Services
                                Payment Processors
                                Warranty Providers
                                Delivery Partners
Creating Intuitive Branching Structures
Branching structures in mind maps should match the natural inquiry patterns of agents, making it intuitive for both humans and AI to navigate the data landscape:
Hierarchical Branching
Creates parent-child relationships between data categories, starting with broad domains and branching into increasingly specific subcategories.
Radial Branching
Places the agent at the center with data sources radiating outward, organized by relationship proximity and access frequency.
Sequential Branching
Organizes data connections in the typical sequence they would be accessed during common agent workflows or user journeys.
Leveraging PageOn.ai for Complex Data Relationship Maps
PageOn.ai's AI Blocks feature significantly simplifies the construction of complex data relationship maps by providing:
- Drag-and-drop interface for creating visual data connection nodes
- Smart templates pre-configured for common agent-data relationships
- Dynamic linking capabilities that visualize data flow directions
- Auto-organization algorithms that optimize layout based on connection strength
With these tools, even complex multi-source data relationships can be visually mapped in a fraction of the time it would take using traditional diagramming software. The resulting maps are not only visually clear but also interactive, allowing users to explore different aspects of the connection framework.

By combining AI tools for mind mapping with domain expertise, organizations can create visual templates that make complex data relationships accessible to both technical and non-technical stakeholders.
Building Intelligence into Connection Templates
Intelligent agents require intelligent guidance to effectively navigate complex data ecosystems. By embedding intelligence directly into connection templates, organizations can dramatically improve how agents interact with enterprise data resources.
How Intelligent Agents Navigate Data Ecosystems
Intelligent agents use visual guidance to determine:
- Which data sources are likely to contain relevant information
- How to structure queries for different data repositories
- How to interpret and integrate results from multiple sources
- When to request human intervention or additional permissions
Visual mapping provides agents with critical contextual information about data sources, helping them make more informed decisions about where and how to search for information.

Incorporating Predictive Elements
Advanced agent-data connection templates include predictive elements that anticipate agent needs:
Usage Pattern Analysis
Templates that learn from historical query patterns to preemptively suggest likely data sources for common question types.
Context-Aware Routing
Connection maps that consider user context, time of day, current events, and other factors when determining optimal data paths.
Query Reformulation
Templates that help agents rephrase queries to better match the structure and terminology of target data sources.
Proactive Data Preparation
Maps that trigger preemptive data retrieval based on likely follow-up questions or related information needs.
Creating Self-Updating Templates
The most sophisticated connection templates evolve automatically as data structures change:
                    graph TD
                        A[Template Monitors Data Schema] -->|Detects Changes| B{Significant Change?}
                        B -->|Yes| C[Update Connection Map]
                        B -->|No| A
                        C --> D[Test Updated Connections]
                        D -->|Success| E[Deploy Updated Template]
                        D -->|Failure| F[Alert Admin]
                        F --> G[Manual Review]
                        G --> C
                        E --> H[Log Changes]
                        H --> A
This ability to adapt to changing data structures ensures that connection maps remain accurate and useful even as organizations evolve their data architecture.
Teaching Agents to Interpret Visual Frameworks
For agent-data connection maps to be truly effective, agents must be trained to understand and utilize them. This involves:
- Embedding mapping interpretation logic into agent architecture
- Creating standardized map formats that agents can programmatically process
- Developing feedback mechanisms that help agents learn from connection successes and failures
- Building simulation environments where agents can safely practice navigating complex data landscapes
Enterprise Data Integration Through Visual Mapping
Integrating large language models like ChatGPT with enterprise data resources represents one of the most powerful applications of agent-to-data connection mapping. Creating visual frameworks for these integrations ensures they are secure, compliant, and maximally effective.
Organizations looking to integrate ChatGPT with enterprise data need clear visual frameworks to guide implementation and ensure appropriate safeguards are in place.

Security Considerations in Connection Mapping
Effective visual mapping of security considerations helps organizations maintain robust protection while enabling productive agent-data interactions:
| Security Aspect | Visual Representation | Implementation Guidance |
|---|---|---|
| Authentication Requirements | Lock symbols with color-coded security levels | Implement OAuth 2.0 or similar industry-standard protocols for all connections |
| Data Classification | Color-coded data repositories by sensitivity level | Apply appropriate controls based on classification (public, internal, confidential, restricted) |
| Encryption Requirements | Shield icons on connection pathways | Enforce TLS 1.3+ for data in transit; AES-256 for data at rest |
| Access Logging | Document icons on connection lines | Implement comprehensive logging with tamper-evident storage |
| Data Minimization | Filter symbols at data exit points | Only return the minimum data necessary to fulfill the agent's request |
Compliance and Governance Frameworks
Visual mapping helps transform abstract compliance requirements into actionable connection rules:
                    flowchart TD
                        A[Agent Request] --> B{PII Detected?}
                        B -->|Yes| C{User Authorized?}
                        B -->|No| G[Standard Processing]
                        C -->|Yes| D{Logging Enabled?}
                        C -->|No| E[Access Denied]
                        D -->|Yes| F[Limited PII Access]
                        D -->|No| E
                        F --> H[Compliance Record Created]
                        G --> I[Data Returned to Agent]
                        H --> I

                        subgraph "GDPR Zone"
                            B
                            C
                            D
                            E
                        end

                        subgraph "Processing Zone"
                            F
                            G
                            H
                            I
                        end

                        classDef gdprZone fill:#f9f9f9,stroke:#FF8000,stroke-width:2px;
                        classDef procZone fill:#f9f9f9,stroke:#333,stroke-width:1px;

                        class GDPR gdprZone;
                        class Processing procZone;
This approach ensures that compliance requirements are visibly integrated into the connection architecture, making them easier to implement, audit, and maintain.
Creating Templates That Respect Data Boundaries
Effective templates must balance data accessibility with appropriate boundaries:
- Role-Based Access Control: Visually mapping which agent roles can access specific data types
- Purpose Limitation: Defining and visualizing allowed use cases for each data connection
- Geographical Restrictions: Mapping data sovereignty requirements into connection templates
- Temporal Limitations: Visualizing time-based access restrictions or data retention policies

Measuring and Optimizing Data Connection Efficiency
To ensure agent-data connection templates are delivering maximum value, organizations must establish clear metrics and continuous optimization processes.
Key Performance Indicators
The most important metrics for evaluating connection template effectiveness include:
Performance Metrics
- Query response time
- Throughput (queries/second)
- Resource utilization
- Cache hit ratio
Quality Metrics
- Relevance of returned data
- Completeness of results
- Data freshness
- Error rates
Efficiency Metrics
- Connection reuse ratio
- Query optimization level
- Data transfer volume
- Connection establishment time
Business Impact Metrics
- Time saved vs. manual methods
- User satisfaction ratings
- Problem resolution rates
- Decision quality improvement
Visual Analytics for Identifying Bottlenecks
Visual analytics tools help organizations identify and address bottlenecks in agent-data connections:
These visualizations help teams quickly identify problematic connections or inefficient data pathways, directing optimization efforts where they'll have the greatest impact.
A/B Testing Frameworks
Systematic A/B testing of connection templates helps organizations iteratively improve performance:
                    graph TD
                        A[Original Template] --> B[Create Variant]
                        B --> C[Define Success Metrics]
                        C --> D[Split Traffic]
                        D --> E[Monitor Performance]
                        E --> F{Winner Identified?}
                        F -->|Yes| G[Implement Winning Template]
                        F -->|No| H[Refine Variants]
                        H --> D
                        G --> I[Document Learnings]
                        I --> J[Start New Test Cycle]
Creating Continuous Improvement Cycles
The most successful organizations establish formalized continuous improvement cycles for their connection templates:
- Measure: Collect comprehensive metrics on connection performance
- Analyze: Identify patterns, bottlenecks, and opportunity areas
- Hypothesize: Develop theories about potential improvements
- Test: Implement changes in controlled environments
- Learn: Evaluate results and document findings
- Scale: Deploy successful improvements broadly
- Repeat: Return to measurement with the improved template
This structured approach ensures that connection templates continuously evolve and improve, delivering increasingly better results over time.
The Future of Agent-Data Relationships
As AI capabilities advance and data ecosystems grow increasingly complex, the future of agent-data relationships will be defined by several emerging trends.
Emerging Trends in Visual Representation
3D Data Landscapes
Moving beyond 2D maps to create navigable 3D representations of data relationships that better reflect complex interconnections.
Temporal Mapping
Adding time-based dimensions to connection maps, showing how data relationships evolve and change over different timeframes.
Augmented Reality Visualization
Using AR to create immersive data connection visualizations that teams can collaboratively explore and modify.
Adaptive Templates and Agent Autonomy
As agent capabilities advance, connection templates will become increasingly dynamic and self-adapting:
- Ambient Intelligence: Templates that sense and respond to changing data environments
- Self-Healing Connections: Maps that automatically repair broken data pathways
- Autonomous Discovery: Agents that can independently explore and map new data sources
- Collaborative Evolution: Templates that learn from the experience of multiple agents
Preparing for Advanced Agent-Data Synergies
Organizations can prepare for these future developments by taking several key steps today:
- Establish Data Governance Frameworks that can adapt to evolving agent capabilities
- Invest in Metadata Management to enhance discoverability and context
- Develop Skills in Visual Data Modeling among both technical and business teams
- Create Learning Environments where agents can safely explore data relationships
- Build Flexible Security Architectures that protect data while enabling innovation
By building these foundations now, organizations will be well-positioned to capitalize on the transformative potential of advanced agent-data relationships in the coming years.
The future of agent-data relationships will be characterized by increasing autonomy, intelligence, and adaptability. Organizations that embrace visual mapping frameworks today will be best positioned to harness these emerging capabilities.
Transform Your Agent-Data Connections with PageOn.ai
Create intuitive, powerful visual maps that revolutionize how your AI agents interact with enterprise data. PageOn.ai's intelligent visualization tools make complex data relationships clear and actionable.
Start Creating with PageOn.ai TodayMoving Forward with Agent-Data Connection Mapping
The relationship between AI agents and enterprise data continues to evolve rapidly, creating both challenges and opportunities for organizations across industries. By embracing visual mapping approaches to agent-data connections, organizations can:
- Create intuitive frameworks that make complex data relationships understandable
- Establish secure, governance-aware connection templates
- Optimize agent performance through better data access patterns
- Prepare for a future of increasingly autonomous and intelligent agent-data interactions
As you embark on your journey to improve agent-data relationships through visual mapping, remember that clarity, consistency, and adaptability are your most important design principles. Well-designed connection templates not only improve current performance but also create the foundation for future innovation.
The most successful organizations will be those that view agent-to-data connection mapping not as a one-time project but as an evolving capability that grows and matures alongside their data ecosystem and AI strategy.
You Might Also Like
How to Design Science Lesson Plans That Captivate Students
Create science lesson plans that captivate students with hands-on activities, clear objectives, and real-world applications to foster curiosity and critical thinking.
How to Write a Scientific Review Article Step by Step
Learn how to write a review article in science step by step. Define research questions, synthesize findings, and structure your article for clarity and impact.
How to Write a Self-Performance Review with Practical Examples
Learn how to write a self-performance review with examples and tips. Use an employee performance review work self evaluation sample essay to guide your process.
How to Write a Spec Sheet Like a Pro? [+Templates]
Learn how to create a professional spec sheet with key components, step-by-step guidance, and free templates to ensure clarity and accuracy.