Transforming Economic Forecasts: Visual Scenarios for 30% Productivity Growth Impact
Discover how dramatic productivity improvements could reshape economies worldwide through interactive visualizations and scenario planning.
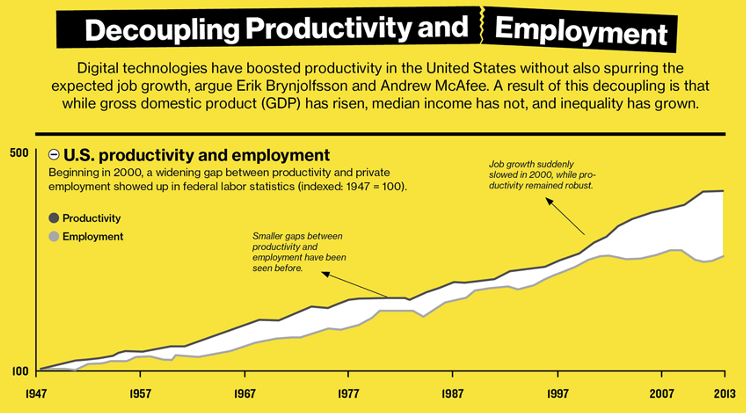
Decoding the Productivity Growth Landscape
The global economy stands at a critical inflection point where productivity growth could fundamentally reshape our economic future. Current productivity growth rates typically range from 1.5% to 3%, but recent research suggests the potential for much more dramatic improvements approaching 30% in certain sectors.
The dramatic difference between current productivity growth rates and the potential 30% leap represents not just an incremental improvement but a transformative shift in economic potential. According to recent research from the World Economic Forum and Accenture, banking could see as much as a 30% productivity improvement from AI adoption in just the next three years.
To properly understand these projections, we must establish clear baseline metrics across industries:
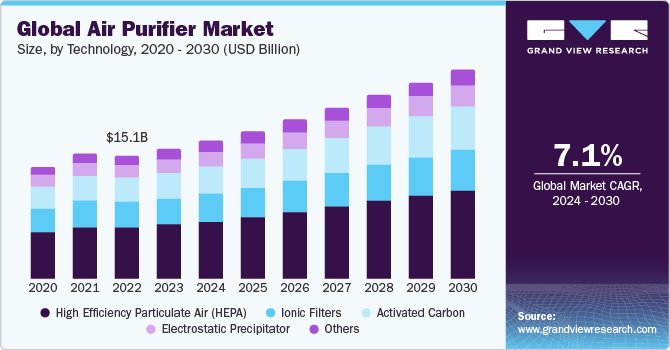
Current vs. Potential Productivity Growth by Sector
The following chart illustrates the gap between current and potential productivity growth rates across key economic sectors:
The relationship between productivity growth and economic prosperity cannot be overstated. When productivity rises, it creates a multiplier effect throughout the economy:
- Higher wages and improved living standards
- Increased corporate profits and investment
- Enhanced global competitiveness
- Reduced inflationary pressures
- Fiscal sustainability through expanded tax bases
Understanding these relationships is crucial for businesses and policymakers seeking to capitalize on the potential transformation ahead. The AI-powered growth charts increasingly demonstrate how technological adoption correlates directly with productivity acceleration.
The Four Economic Future Scenarios Visualized
Based on comprehensive research from the World Economic Forum and Accenture, four distinct economic future scenarios emerge. Each represents a different combination of technological development and human capital investment trajectories:
Productivity Leap Scenario
The Productivity Leap represents the most optimistic scenario, where technological development and human capital enhancement accelerate simultaneously. This scenario creates the perfect conditions for sustained 30% productivity growth across multiple sectors.

Key elements of this scenario include:
- Widespread AI adoption across industries with minimal disruption
- Effective upskilling and reskilling programs that match technological change
- Substantial GDP growth exceeding historical averages by 2-3x
- Rising wages across skill levels with moderate inequality
- Positive supply chain transformations that reduce bottlenecks
GDP Impact Under Productivity Leap Scenario
Projected GDP growth over time compared to baseline scenario:
Automation Overload Scenario
This scenario represents rapid technological acceleration without corresponding human capital development. While productivity increases, significant social and economic disruptions occur due to workforce displacement.
Job Displacement vs. Creation Rates
The diagram below illustrates the imbalance between job losses and new job creation in the Automation Overload scenario:
flowchart TD
    A[Current Workforce] --> B{Automation Impact}
    B -->|Displaced Jobs| C[15M Manufacturing]
    B -->|Displaced Jobs| D[12M Transportation]
    B -->|Displaced Jobs| E[10M Retail]
    B -->|Displaced Jobs| F[8M Administrative]
    B -->|New Jobs Created| G[6M Tech Development]
    B -->|New Jobs Created| H[5M Data Analysis]
    B -->|New Jobs Created| I[4M AI Management]
    B -->|Net Effect| J[30M Job Deficit]

    classDef displaced fill:#FF6666
    classDef created fill:#66BB6A
    classDef deficit fill:#FF8000

    class C,D,E,F displaced
    class G,H,I created
    class J deficit
Key challenges in this scenario include:
- Significant job displacement with inadequate retraining opportunities
- Growing inequality as technology owners capture most gains
- Geographic disparities based on industry concentration
- Political and social instability due to rapid economic disruption
- Potential for regulatory backlash against technology adoption
Human Advantage Scenario
The Human Advantage scenario represents substantial investment in education, training, and human capital development, even as technological adoption proceeds at a more moderate pace. This creates an economy where human skills and capabilities drive productivity improvements.
Industry Performance Under Human Advantage Scenario
Productivity growth rates by industry type:
This scenario particularly benefits:
- Service sectors requiring high emotional intelligence and creativity
- Healthcare, education, and elder care industries
- Customization-focused manufacturing and creative industries
- Regions and countries with strong educational institutions
- Workers who adapt through continuous learning and skill development
Productivity Drought Scenario
The most concerning scenario involves stunted growth in both technological development and human capital investment. This "productivity drought" scenario represents a failure to capitalize on available opportunities, leading to economic stagnation.
Economic Vulnerability Under Productivity Drought
Impact on key economic indicators compared to baseline:
Warning signs of this scenario include:
- Declining investment in R&D across public and private sectors
- Deteriorating educational outcomes and workforce skills
- Rising protectionism and declining global knowledge sharing
- Regulatory frameworks that stifle innovation
- Growing mismatch between available skills and economic needs
These four scenarios provide a framework for understanding potential productivity futures. Using line graphs to visualize trends across these scenarios helps economists and policymakers track real-world developments against these projected pathways.
Sector-Specific Impact Analysis
The potential 30% productivity growth will not affect all sectors equally. Some industries are positioned to capture outsized benefits, while others may experience more modest gains or even disruption.
Financial Services Transformation
The financial services sector stands to gain tremendously from AI-driven productivity improvements. Research from the World Economic Forum and Accenture suggests banking could see a 30% productivity boost from AI adoption in just the next three years.
Financial Services AI Productivity Gains
Key areas of transformation in the banking and financial services sector:
flowchart TD
    A[Financial Services] --> B[Customer Service]
    A --> C[Risk Assessment]
    A --> D[Trading & Investment]
    A --> E[Compliance & Reporting]

    B --> B1[AI Chatbots]
    B --> B2[Personalization]
    B1 --> BG[+35% Productivity]
    B2 --> BG

    C --> C1[Automated Underwriting]
    C --> C2[Fraud Detection]
    C1 --> CG[+40% Productivity]
    C2 --> CG

    D --> D1[Algorithm Trading]
    D --> D2[Market Analysis]
    D1 --> DG[+25% Productivity]
    D2 --> DG

    E --> E1[Automated Reporting]
    E --> E2[Regulatory Monitoring]
    E1 --> EG[+20% Productivity]
    E2 --> EG

    classDef default fill:#f9f9f9,stroke:#333,stroke-width:1px
    classDef gain fill:#FF8000,color:white
    class BG,CG,DG,EG gain
The dramatic productivity gains in financial services will transform everything from customer experiences to back-office operations. Implementing effective data visualization charts can help financial institutions track these transformation effects in real-time.
Technology and Digital Communications
As both the creator and implementer of productivity-enhancing tools, the technology sector stands to experience some of the most significant growth. Companies in cloud computing, AI development, and digital communications will see compound benefits from their own productivity improvements and rising demand.

Projected Tech Subsector Growth Rates
Productivity and revenue growth projections by technology subsector:
Manufacturing Transformation
Manufacturing stands at a crucial inflection point where automation, AI, and human skill enhancement could drive substantial productivity gains. The sector faces both tremendous opportunity and potential disruption depending on adaptation strategies.
Manufacturing Productivity Scenarios
Potential productivity outcomes under different economic scenarios:
Healthcare and Medical Services
Healthcare presents a complex productivity challenge. While the sector has historically seen lower productivity growth, the combination of AI diagnostics, telemedicine, and administrative automation could dramatically improve efficiency while enhancing patient outcomes.
Key healthcare productivity accelerators include:
- AI-assisted diagnostics reducing error rates by up to 40%
- Telemedicine increasing physician productivity by 25-30%
- Administrative automation reducing paperwork burden by 35%
- Predictive analytics improving resource allocation by 20%
- Remote monitoring reducing hospitalization rates by 15-20%
These sector-specific analyses demonstrate the uneven distribution of productivity impacts across the economy. Understanding these variations is critical for investors, policymakers, and business leaders planning for the future. Implementing interactive visualizations for data exploration can help stakeholders identify opportunities specific to their industry.
Critical Variables and Tipping Points
The path toward 30% productivity growth hinges on several critical variables that can dramatically shift outcomes. Small changes in these key factors can create outsized impacts, leading to tipping points that determine which economic scenario emerges.
Sensitivity Analysis: Small Changes, Big Impacts
The following chart illustrates how minor adjustments in key variables can dramatically alter productivity outcomes:
The radar chart demonstrates how even a 5-10% increase in critical variables like AI adoption rates or workforce training can multiply productivity impacts by 4-5x. This non-linear relationship explains why seemingly minor policy or investment decisions can have transformative economic effects.
Decision Trees for Policy and Business Strategy
Key decision points and their cascading effects determine which productivity scenario unfolds:
flowchart TD
    A[Productivity Growth Decision Points] --> B{AI Investment Level}
    B -->|High Investment| C{Workforce Training}
    B -->|Low Investment| D[Limited Productivity Growth]

    C -->|Strong Programs| E[Productivity Leap Scenario]
    C -->|Weak Programs| F[Automation Overload]

    A --> G{Education Policy}
    G -->|Enhanced Education| H{Tech Adoption}
    G -->|Status Quo Education| I[Skills Mismatch]

    H -->|Rapid Adoption| J[Productivity Leap Scenario]
    H -->|Slow Adoption| K[Human Advantage]

    A --> L{Regulatory Approach}
    L -->|Innovation-Friendly| M[Accelerated Growth]
    L -->|Restrictive| N[Innovation Bottlenecks]

    classDef default fill:#f9f9f9,stroke:#333,stroke-width:1px
    classDef positive fill:#66BB6A,color:white
    classDef negative fill:#FF6666,color:white
    classDef neutral fill:#42A5F5,color:white
    classDef highlight fill:#FF8000,color:white

    class E,J,M positive
    class D,F,I,N negative
    class K,H neutral
    class A highlight
Technology Adoption Curves and Productivity Outcomes
The rate and breadth of technological adoption determines how quickly productivity improvements materialize:
The adoption curves illustrate a critical insight: the difference between the rapid and slow adoption scenarios represents approximately $3-4 trillion in unrealized global economic output by 2030. Strategic data visualization for business intelligence allows leaders to track where their organizations fall on these adoption curves.
Understanding these critical variables and tipping points helps stakeholders identify leverage points where small interventions can create outsized productivity impacts. By monitoring key indicators against these models, organizations can adjust their strategies to capitalize on emerging opportunities.
From Data to Strategy: Actionable Insights
Transforming productivity scenario data into actionable strategies requires translating complex economic projections into clear pathways for businesses, governments, and individuals. The following strategic frameworks provide guidance for navigating the productivity revolution ahead.
Policy Framework for Productivity Enhancement

Effective government policy frameworks balance multiple objectives to create conditions for productivity growth while ensuring inclusive benefits:
- Education Reform: Modernize curricula to emphasize digital skills, creativity, and adaptability
- Regulatory Innovation: Create sandboxes for experimentation while maintaining appropriate safeguards
- Investment Incentives: Tax structures that reward productivity-enhancing capital investments
- Safety Net Modernization: Portable benefits, universal training accounts, and transition assistance
- Infrastructure Development: Ensure digital connectivity and technological foundations
Workforce Transition Pathways
Individuals and organizations need clear pathways for skill transition as productivity shifts transform job requirements:
The skills gap visualization highlights critical areas requiring focused development efforts. Organizations can use this framework to create targeted upskilling programs that align with productivity enhancement initiatives.
Translating economic scenarios into actionable strategies requires continuous monitoring of productivity indicators and flexible adaptation as conditions evolve. Organizations that successfully navigate this transition will not only survive but thrive in the transformed economic landscape.
Communicating Complex Economic Futures
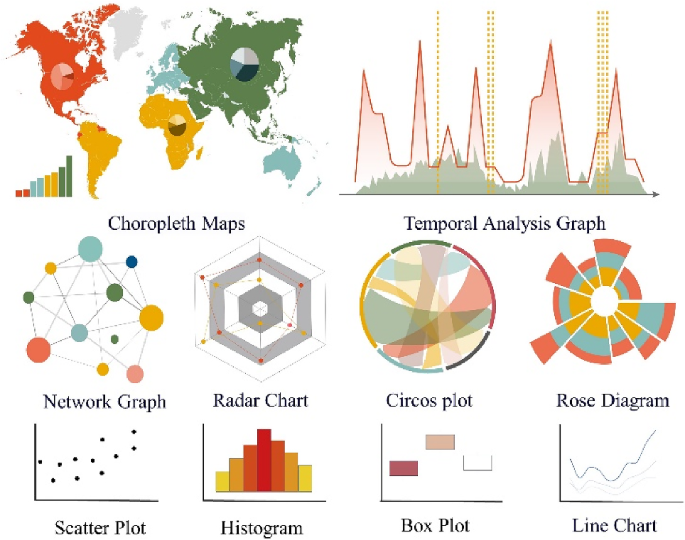
Effectively communicating productivity scenarios to diverse stakeholders requires strategic visualization approaches. The right visual tools can transform complex economic projections into intuitive, actionable insights.
Executive Summary Visualizations
Concise, high-impact visuals that distill complex scenarios for executive decision-makers:
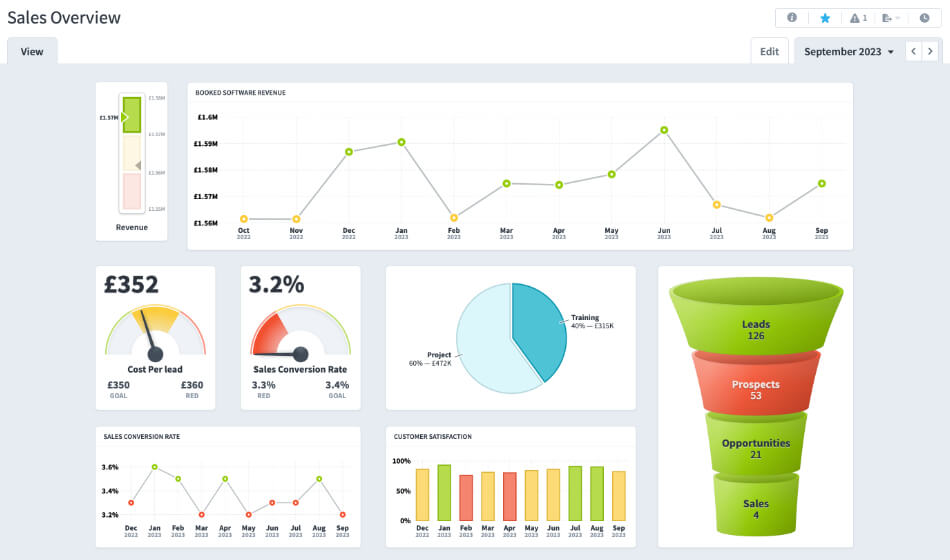
Executive summaries should focus on:
- Key performance indicators that track productivity evolution
- Critical decision points requiring immediate attention
- Competitive positioning relative to industry benchmarks
- Risk assessment with probability-weighted scenarios
- Estimated financial impacts under each productivity scenario
Narrative-Driven Visual Storytelling
For broader stakeholder communication, narrative visualization techniques create compelling, memorable stories around productivity scenarios:
Effective narrative visualization creates emotional connection and memorability by:
- Focusing on human impact stories alongside abstract economic data
- Using consistent visual metaphors across presentation materials
- Creating clear before/after comparisons that highlight transformation
- Employing interactive elements that encourage stakeholder engagement
- Building sequential reveals that develop understanding progressively
International Positioning Visualization
Contextualizing productivity scenarios within global competition helps stakeholders understand strategic implications:
Global comparisons highlight critical competitive considerations including:
- Relative investment levels in productivity-enhancing technologies
- Educational and workforce development advantages
- Policy environments that accelerate or impede productivity
- Sector-specific competitive positioning
- Technology adoption rates across international boundaries
Effectively communicating these complex economic scenarios requires thoughtful visual design that balances accuracy with clarity. PageOn.ai's visualization tools excel at transforming complex economic data into compelling visual narratives that drive understanding and action across diverse stakeholder groups.
Transform Your Economic Scenarios with PageOn.ai
Create stunning visualizations that make complex productivity data accessible and actionable. From executive dashboards to detailed scenario planning, PageOn.ai helps you communicate economic futures with clarity and impact.
Start Creating with PageOn.ai TodayVisualizing Our Productive Future
As we've explored throughout this analysis, the potential for 30% productivity growth represents a transformative economic opportunity. However, realizing this potential requires strategic planning, thoughtful policy frameworks, and effective communication across stakeholders.
The four economic scenarios—Productivity Leap, Automation Overload, Human Advantage, and Productivity Drought—provide a framework for understanding possible futures. By monitoring critical variables and tipping points, organizations can identify emerging trends and position themselves advantageously.
Effective visualization plays a crucial role in this process. By transforming complex economic data into intuitive, engaging visuals, leaders can drive understanding, alignment, and action. PageOn.ai's visualization tools provide the ideal platform for creating these impactful economic visualizations, helping organizations navigate the productivity revolution ahead.
You Might Also Like
How to Design Science Lesson Plans That Captivate Students
Create science lesson plans that captivate students with hands-on activities, clear objectives, and real-world applications to foster curiosity and critical thinking.
How to Write a Scientific Review Article Step by Step
Learn how to write a review article in science step by step. Define research questions, synthesize findings, and structure your article for clarity and impact.
How to Write a Self-Performance Review with Practical Examples
Learn how to write a self-performance review with examples and tips. Use an employee performance review work self evaluation sample essay to guide your process.
How to Write a Spec Sheet Like a Pro? [+Templates]
Learn how to create a professional spec sheet with key components, step-by-step guidance, and free templates to ensure clarity and accuracy.