Transforming Pharmaceutical Innovation: AI-Driven Visual Mapping for Modern Drug Discovery
Revolutionizing the pharmaceutical landscape through advanced visualization techniques
The Evolution of Drug Discovery Visualization
The pharmaceutical industry has undergone a profound transformation in how it represents and communicates the complex journey of drug development. What was once confined to static paper-based documentation has evolved into dynamic, interactive visual pipelines that capture the intricate nature of modern drug discovery.
Evolution of Drug Discovery Documentation
The shift from traditional paper-based approaches to interactive digital visualization:
The economic stakes in pharmaceutical development are staggering, with the average cost of bringing a new drug to market reaching approximately $2.6 billion. Visual clarity in pipeline management can significantly reduce these costs by identifying failures earlier, optimizing resource allocation, and accelerating decision-making processes throughout development.
Static vs. Interactive Visualization Comparison
| Feature | Static Visualization | Interactive Visualization |
|---|---|---|
| Data Depth | Limited to what fits on a single view | Multilayered with drill-down capabilities |
| Adaptability | Requires complete redesign for updates | Real-time data integration and adjustments |
| Stakeholder Engagement | Passive consumption | Active exploration and personalized views |
| Decision Support | Point-in-time reference | Dynamic scenario modeling and prediction |
PageOn.ai's conversation-based approach represents a significant breakthrough in this evolution, eliminating the traditional learning curve for scientists who need to create sophisticated visual representations. Instead of requiring expertise in design software, researchers can simply describe what they need in natural language, allowing them to focus on science while PageOn.ai handles the visualization complexity. This democratizes the creation of complex pipeline visualizations, making them accessible to the entire research team without specialized training in graphic design or data visualization tools.
Core Components of an AI-Enhanced Drug Discovery Pipeline
The integration of artificial intelligence has fundamentally transformed the traditional drug discovery process. According to recent research on AI applications in drug discovery, pharmaceutical companies can navigate this complex landscape more efficiently by leveraging machine learning algorithms to analyze vast databases and identify intricate patterns. Let's examine the critical stages where AI creates the most impact and the visualization needs at each phase.
AI-Enhanced Drug Discovery Pipeline
The major stages of modern pharmaceutical development with AI integration:
flowchart LR
    A[Target Identification] -->|AI Analysis| B[Hit Discovery]
    B -->|ML Prediction| C[Lead Optimization]
    C -->|AI Modeling| D[ADME Assessment]
    D -->|Data Analytics| E[Clinical Trials]
    E -->|Outcome Analysis| F[Regulatory Approval]

    style A fill:#FFE0B2,stroke:#FF8000
    style B fill:#FFE0B2,stroke:#FF8000
    style C fill:#FFE0B2,stroke:#FF8000
    style D fill:#FFE0B2,stroke:#FF8000
    style E fill:#FFE0B2,stroke:#FF8000
    style F fill:#FFE0B2,stroke:#FF8000
Visual Representation Needs by Pipeline Phase
Target Identification and Validation
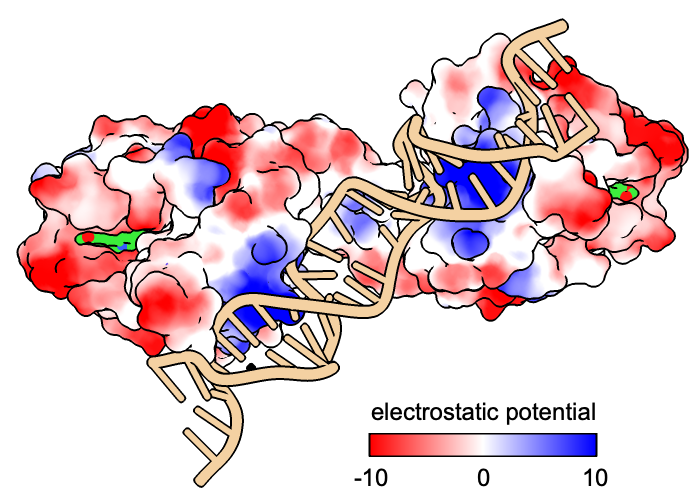
At this initial stage, scientists need to visualize complex molecular structures and protein-ligand interactions. These visualizations must represent three-dimensional protein structures, binding sites, and potential drug targets in an accessible format for both computational and experimental scientists.
Hit Discovery and Lead Optimization
Visualization interfaces for predictive modeling are essential here, allowing researchers to explore structure-activity relationships (SAR) and molecular modifications. Interactive dashboards that display compound libraries with filtering options based on predicted properties enhance decision-making during the hit-to-lead process.
Scientists using AI-powered flowchart tools can effectively map the decision trees that guide lead optimization, making complex decision processes more transparent and collaborative.
ADME Properties Assessment
Interactive dashboards that visualize absorption, distribution, metabolism, and excretion properties are critical at this stage. Radar charts and parallel coordinates plots help compare multiple compounds across various pharmacokinetic parameters simultaneously.
ADME Properties Comparison
Radar charts allow for multivariate visualization of compound properties:
Clinical Trial Design and Monitoring
Patient data visualization becomes paramount during clinical trials. Interactive dashboards that track enrollment, adverse events, efficacy endpoints, and demographic distributions are essential for real-time monitoring and decision-making.
Leveraging AI chart generators enables clinical teams to rapidly create visual reports from complex trial data, facilitating faster insights and more agile trial management.
PageOn.ai's AI Blocks feature revolutionizes how scientists assemble these complex pipeline components. Rather than requiring technical design knowledge, researchers can use natural language to describe the visual components they need, and PageOn.ai automatically generates modular diagrams that break down the complexity into understandable visual segments.
Key Visualization Challenges in Drug Discovery
Visualization Challenges by Complexity
Comparing the difficulty of different visualization types in drug discovery:
- Representing multi-dimensional molecular data requires innovative approaches beyond traditional 2D visualizations. Scientists must find ways to represent chemical structures, binding affinities, and conformational changes in accessible formats without losing critical details.
- Illustrating complex biological pathways presents unique challenges in showing interconnected networks while maintaining clarity. Effective pathway visualizations must balance detail with readability to communicate essential biological context.
- Visualizing predictive model outputs for non-technical stakeholders demands translating complex statistical concepts into intuitive visual formats that support confident decision-making without requiring deep data science expertise.
- Creating adaptable pipeline visualizations that evolve with project progress ensures that visual tools remain relevant throughout the drug discovery journey, reflecting current status while maintaining historical context.
The challenge of connecting disparate data sources into unified visual narratives is particularly acute in modern pharmaceutical research. Teams must integrate data from genomics, proteomics, high-throughput screening, clinical trials, and published literature into coherent visualizations that tell the complete story of a drug's development journey. This is where science slides with ai tools become invaluable for presenting unified narratives from diverse data sources.
Machine Learning Algorithms: Visualizing the Invisible Work
Machine learning algorithms are the invisible workhorses powering modern drug discovery, yet visualizing their operation and outputs presents unique challenges. Creating effective visual representations helps bridge the gap between computational complexity and human understanding, making AI-driven insights accessible to diverse stakeholders across the pharmaceutical development process.
ML Approaches in Drug Discovery Pipeline
Visual representation of how different ML techniques apply throughout discovery:
flowchart TD
    subgraph "Target Identification"
        A1[Genomic Data] -->|Graph Neural Networks| A2[Target Prediction]
        A3[Literature Mining] -->|NLP| A2
    end

    subgraph "Hit Discovery"
        B1[Virtual Screening] -->|Deep Learning| B2[Compound Ranking]
        B3[High Throughput Data] -->|Random Forests| B2
    end

    subgraph "Lead Optimization"
        C1[QSAR Models] -->|CNN/RNN| C2[Property Prediction]
        C3[Molecular Generation] -->|Reinforcement Learning| C4[Novel Compounds]
    end

    A2 --> B1
    B2 --> C1
    C2 --> D[Clinical Candidates]
    C4 --> D

    style A1 fill:#FFE0B2,stroke:#FF8000
    style A2 fill:#FFE0B2,stroke:#FF8000
    style A3 fill:#FFE0B2,stroke:#FF8000
    style B1 fill:#E3F2FD,stroke:#2196F3
    style B2 fill:#E3F2FD,stroke:#2196F3
    style B3 fill:#E3F2FD,stroke:#2196F3
    style C1 fill:#E8F5E9,stroke:#4CAF50
    style C2 fill:#E8F5E9,stroke:#4CAF50
    style C3 fill:#E8F5E9,stroke:#4CAF50
    style C4 fill:#E8F5E9,stroke:#4CAF50
    style D fill:#FFEBEE,stroke:#F44336
Deep Learning for Molecular Structure Prediction
Deep learning approaches, particularly convolutional neural networks (CNNs) and graph neural networks, excel at predicting molecular properties and structures from raw data. Visualizing these models requires representations that show both the network architecture and how molecular features are processed through different layers.

Natural Language Processing for Literature Analysis
NLP algorithms analyze vast repositories of scientific literature to extract relationships between genes, proteins, compounds, and diseases. Effective visualizations of these analyses often use network graphs that show entity relationships and connection strengths discovered through text mining.
Using navigate AI image generators can help create visual representations of complex NLP-derived relationship networks that are both informative and visually engaging for research presentations.
Reinforcement Learning for Drug Design Optimization
Reinforcement learning (RL) approaches guide the generation of novel molecular structures by optimizing for desired properties. Visualizing RL in drug design requires showing both the optimization process and the evolution of molecular candidates through successive iterations.
Reinforcement Learning Drug Design Process
flowchart LR
    A[Initial Molecule] --> B[Molecular Modifications]
    B --> C{Property Evaluation}
    C -->|Improved| D[Reward]
    C -->|Deteriorated| E[Penalty]
    D --> F[Update Policy]
    E --> F
    F --> B
    B -->|Optimized| G[Final Candidate]

    style A fill:#FFE0B2,stroke:#FF8000
    style B fill:#E3F2FD,stroke:#2196F3
    style C fill:#FFF9C4,stroke:#FFC107
    style D fill:#E8F5E9,stroke:#4CAF50
    style E fill:#FFEBEE,stroke:#F44336
    style F fill:#E3F2FD,stroke:#2196F3
    style G fill:#E1BEE7,stroke:#9C27B0
Visualization Techniques for High-Dimensional Data
Dimensionality Reduction Methods Comparison
Effectiveness of different techniques for visualizing high-dimensional chemical data:
High-dimensional data is ubiquitous in computational drug discovery, where molecules may be represented by hundreds or thousands of descriptors. Effective visualization techniques like t-SNE, UMAP, and PCA reduce this dimensionality while preserving important relationships, allowing scientists to identify patterns and clusters that would be invisible in the raw data.
PageOn.ai's Deep Search functionality transforms the integration of visual elements in drug discovery presentations. The system can automatically identify relevant chemical structures, pathway diagrams, and analytical visualizations based on the content being discussed, integrating them seamlessly into communications without requiring manual searches through scientific databases or image repositories. This capability dramatically reduces the time needed to create comprehensive visual narratives of complex drug discovery processes.
Regulatory Considerations in AI Pipeline Visualization
The intersection of artificial intelligence and pharmaceutical development brings unique regulatory challenges that must be addressed through thoughtful visualization approaches. Documentation for regulatory submissions must not only communicate scientific findings clearly but also demonstrate the validity, transparency, and explainability of AI methods used throughout the drug discovery process.
Regulatory Documentation Visualization Needs
Regulatory bodies require comprehensive documentation that clearly demonstrates how AI algorithms were developed, validated, and applied in the drug discovery process. Visual representations can help satisfy these requirements by:
- Illustrating model training processes and validation methods
- Visualizing data provenance and preprocessing workflows
- Depicting decision boundaries and confidence metrics for predictive models
- Showing comparative analyses between AI predictions and experimental validation
- Mapping the integration points of AI tools within traditional discovery workflows
Global Regulatory Landscape Variations
Different regulatory authorities worldwide maintain varied approaches to AI in healthcare and drug discovery. Recent mapping of the regulatory landscape for AI in healthcare across Africa has highlighted significant regional variations in regulatory frameworks, which is representative of global differences in approaches to AI oversight.
Global Regulatory Approaches to AI in Drug Discovery
flowchart LR
    A[Global Regulatory\nLandscape] --> B[FDA - USA]
    A --> C[EMA - Europe]
    A --> D[PMDA - Japan]
    A --> E[NMPA - China]
    A --> F[African Regulatory\nAuthorities]

    B --> B1[Framework for AI\nas Medical Device]
    B --> B2[AI/ML Action Plan]

    C --> C1[Reflection Paper\non Big Data]
    C --> C2[Good Machine\nLearning Practice]

    D --> D1[AI Medical Device\nRegulatory Changes]

    E --> E1[AI Application\nDevelopment Guidelines]

    F --> F1[Emerging Regulatory\nFrameworks]
    F --> F2[Capacity Building\nInitiatives]

    style A fill:#FFE0B2,stroke:#FF8000
    style B fill:#E3F2FD,stroke:#2196F3
    style C fill:#E8F5E9,stroke:#4CAF50
    style D fill:#FFF9C4,stroke:#FFC107
    style E fill:#F3E5F5,stroke:#9C27B0
    style F fill:#FFEBEE,stroke:#F44336
These regional variations present significant challenges for pharmaceutical companies operating globally. Visual communication of regulatory strategies must be adaptable to different regional requirements while maintaining consistency in how AI approaches are presented and documented.
Transparency and Explainability Visualization
As regulatory bodies increasingly demand explainable AI, visualization becomes a critical tool for demystifying complex algorithms. Effective visual approaches include:
- Feature importance visualizations that show which molecular or biological attributes most influenced an algorithm's predictions
- Attention maps highlighting regions of interest in molecular structures
- Decision tree representations of complex ensemble models
- Counterfactual visualizations showing how predictions would change with different inputs

Visualization Standards for Technical and Regulatory Stakeholders
Creating visualization standards that effectively bridge the communication gap between technical developers and regulatory reviewers is essential for successful AI implementation in drug discovery. These standards should:
- Establish consistent visual language for representing AI components across documentation
- Define appropriate levels of technical detail for different stakeholder groups
- Incorporate interactive elements that allow regulatory reviewers to explore model behavior
- Include clear visual indicators of validation status and uncertainty measures
Creating organizational structures that effectively communicate AI implementation can benefit from ai-powered organizational chart tools that visualize roles, responsibilities, and oversight for regulatory compliance.
Case Studies: Visualization Success Stories in Pharmaceutical AI
Leading pharmaceutical organizations have demonstrated remarkable success by implementing advanced visualization approaches in their AI-driven drug discovery pipelines. These case studies provide valuable insights into best practices and the tangible benefits of effective visual communication in accelerating pharmaceutical innovation.
Case Study 1: Accelerating Oncology Target Discovery
Challenge:
A major pharmaceutical company needed to analyze massive genomic datasets to identify novel cancer targets, but traditional visualization approaches couldn't effectively represent the complex network of genetic interactions.
Solution:
The team developed an interactive network visualization platform that combined AI-identified gene relationships with experimental validation data, allowing researchers to explore complex genetic interactions through an intuitive interface.
Results:
- Identification of 3 novel targets within 6 months (versus historical average of 12-18 months)
- 60% reduction in time spent analyzing genomic data relationships
- Cross-functional collaboration improvements reported by 85% of team members
Case Study 2: Optimizing Clinical Trial Design with Visual Analytics
Challenge:
A biotechnology company needed to optimize patient selection for a complex immunotherapy trial, balancing multiple biomarkers and patient characteristics to maximize chances of observing treatment effect.
Solution:
The team created an interactive dashboard that visually represented AI-predicted treatment responses based on patient characteristics, allowing clinical teams to explore different enrollment criteria and their impact on trial power.
Results:
- 30% reduction in required sample size while maintaining statistical power
- Identified optimal biomarker cut-off values for patient stratification
- Shortened enrollment period by 4 months through optimized site selection
Visualization Impact on Drug Discovery Metrics
Quantified improvements from advanced visualization implementation:
These case studies demonstrate that effective visualization isn't merely about creating attractive graphics—it's about fundamentally transforming how teams interact with complex data and make critical decisions throughout the drug discovery process. The quantifiable improvements in time-to-decision, resource utilization, and successful outcomes highlight the strategic importance of investing in advanced visualization capabilities.
PageOn.ai's conversational content generation approach could significantly streamline these visualization processes by allowing scientists and clinical teams to rapidly iterate on visual concepts through natural language descriptions. Rather than requiring specialized design skills or software proficiency, team members could describe the relationships or insights they want to visualize, and PageOn.ai could generate appropriate visual representations ready for refinement and implementation.
Building Your Own AI-Enhanced Drug Discovery Visual Pipeline
Creating an effective visual pipeline for AI-enhanced drug discovery requires thoughtful planning, appropriate tools, and a clear understanding of stakeholder needs. This step-by-step guide will help you develop visualizations that accelerate your discovery efforts while maintaining scientific accuracy and usability.
Visual Pipeline Development Process
A structured approach to creating effective discovery visualizations:
flowchart TD
    A[Assess Stakeholder Needs] --> B[Map Pipeline Components]
    B --> C[Select Visualization Types]
    C --> D[Prototype Core Visualizations]
    D --> E[Gather Feedback]
    E --> F{Refinement Needed?}
    F -->|Yes| D
    F -->|No| G[Implement Data Integration]
    G --> H[Deploy Visualization Tools]
    H --> I[Measure Impact]
    I --> J[Continuous Improvement]

    style A fill:#FFE0B2,stroke:#FF8000
    style B fill:#FFE0B2,stroke:#FF8000
    style C fill:#FFE0B2,stroke:#FF8000
    style D fill:#E3F2FD,stroke:#2196F3
    style E fill:#E3F2FD,stroke:#2196F3
    style F fill:#FFF9C4,stroke:#FFC107
    style G fill:#E8F5E9,stroke:#4CAF50
    style H fill:#E8F5E9,stroke:#4CAF50
    style I fill:#F3E5F5,stroke:#9C27B0
    style J fill:#F3E5F5,stroke:#9C27B0
Step 1: Assess Stakeholder Needs and Visual Literacy
Begin by identifying all stakeholders who will interact with your visualization pipeline and understand their specific needs:
- Scientists and researchers need detailed technical visualizations with accurate representation of chemical and biological data
- Project managers require progress tracking and decision point visualizations that highlight critical paths
- Executive leadership needs high-level summaries that communicate strategic value and resource requirements
- Regulatory affairs teams need compliance-oriented visualizations that demonstrate methodological rigor
Assess the visual literacy levels across these groups to ensure your visualizations are accessible without sacrificing scientific accuracy.
Step 2: Map Your Pipeline Components
Document the complete drug discovery workflow, identifying:
- Major stages in your discovery process
- Key decision points requiring visualization support
- Data sources and AI algorithms at each stage
- Handoff points between teams or departments
- Regulatory documentation requirements
This comprehensive mapping creates the foundation for your visualization strategy, ensuring no critical elements are overlooked.
Step 3: Select Appropriate Visualization Types
Choose visualization formats optimized for different data types and communication needs:
- 3D molecular visualizations for structural biology and chemistry teams
- Network graphs for biological pathways and target relationships
- Heatmaps for large-scale screening results or genomic data
- Decision trees for transparent representation of AI classification models
- Gantt charts for timeline visualization and resource allocation
- Interactive dashboards for cross-functional program management
Visualization Type Effectiveness by Purpose
Match the right visualization to each drug discovery need:
Step 4: Balance Technical Accuracy with Visual Clarity
Creating effective scientific visualizations requires finding the right balance between detailed accuracy and visual accessibility:
- Use visual hierarchies to highlight the most important information
- Apply consistent color schemes that convey meaning (e.g., activity levels, confidence scores)
- Create layered visualizations that allow users to drill down from high-level views to detailed data
- Provide appropriate context and annotations to make complex data interpretable
- Consider developing multiple views of the same data optimized for different stakeholders
Step 5: Integration Strategies for Real-time Data
Modern drug discovery pipelines generate continuous data streams that should be reflected in visualizations:
- Implement APIs that connect visualization tools to underlying data sources
- Create update mechanisms that refresh visualizations as new data becomes available
- Establish data validation processes to maintain visualization accuracy
- Design visualization systems that gracefully handle missing or preliminary data
- Include timestamp indicators to ensure users understand data currency
Step 6: Collaborative Approaches for Cross-functional Teams
Effective visualization pipelines support collaboration across diverse teams:
- Create shared visual vocabulary across departments (e.g., consistent symbols for targets, compounds)
- Implement annotation and commenting features within visualizations
- Design collaborative workspaces where multiple stakeholders can explore visualizations together
- Establish version control for visualizations to track evolution of understanding
- Create handoff processes that ensure visualization continuity across project phases
PageOn.ai transforms how scientists create and iterate on pipeline visualizations through natural conversation. Rather than struggling with complex design software, researchers can simply describe what they want to see, and PageOn.ai generates appropriate visualizations. This dramatically reduces the technical barriers to creating effective visual tools, allowing scientists to rapidly explore different visualization approaches through simple conversational updates and refinements. The result is more agile, responsive visualization development that keeps pace with the rapidly evolving insights of modern drug discovery programs.
Future Trends: The Evolving Visual Language of AI in Drug Discovery
The intersection of artificial intelligence and visualization in pharmaceutical research continues to evolve rapidly. Emerging technologies and approaches are reshaping how we visually communicate complex drug discovery processes, creating new paradigms for human-AI collaboration and scientific understanding.
Emerging Visualization Paradigms
The next generation of drug discovery visualization is being shaped by several cutting-edge approaches:
- Generative design interfaces that allow researchers to visually explore AI-created molecular variations in real-time
- Multimodal visualizations that integrate text, images, 3D structures, and data plots into unified exploratory environments
- Temporal visualizations that show the evolution of molecular designs or target hypotheses throughout the discovery process
- Uncertainty visualization techniques that explicitly represent confidence levels in AI predictions and model outputs
AR/VR for Immersive Pipeline Exploration
Augmented and virtual reality technologies are opening new frontiers for drug discovery visualization:
- Spatial exploration of complex molecular binding interactions using haptic feedback
- Collaborative VR environments where geographically distributed teams can jointly examine 3D protein structures
- AR overlays that provide real-time information during experimental procedures
- Immersive dashboards that surround users with multidimensional data visualizations

Emerging Visualization Trends Adoption Timeline
Projected industry adoption of major visualization innovations:
Human-AI Collaborative Interface Evolution
The progression of visual interfaces for human-AI collaboration in drug discovery:
flowchart TD
    A[Traditional Interface]
    B[AI Recommendation Systems]
    C[Interactive Co-Creation]
    D[Autonomous Exploration with\nHuman Guidance]
    E[Full Collaborative Partnership]

    A -->|Human directs AI| B
    B -->|Human selects from AI options| C
    C -->|Human-AI iterative design| D
    D -->|Dynamic goal-setting| E

    style A fill:#FFE0B2,stroke:#FF8000
    style B fill:#E3F2FD,stroke:#2196F3
    style C fill:#E8F5E9,stroke:#4CAF50
    style D fill:#F3E5F5,stroke:#9C27B0
    style E fill:#FFEBEE,stroke:#F44336
Visual Interfaces for Human-AI Collaboration
The future of drug discovery lies in effective human-AI collaborative systems with visualization as the critical interface:
- Explainable AI visualizations that make algorithmic reasoning transparent to human collaborators
- Human guidance interfaces that allow researchers to steer AI exploration in promising directions
- Feedback visualization systems that show how human input influences AI learning processes
- Collaborative filtering approaches that visually rank and prioritize AI-generated hypotheses based on human expertise
Standardization Efforts in Visual Communication
As AI-driven drug discovery matures, standardization of visual languages is becoming increasingly important:
- Industry consortia developing shared visual vocabularies for AI components in discovery pipelines
- Regulatory guidance emerging around visualization standards for AI documentation
- Open-source visualization libraries for consistent representation of common drug discovery elements
- Visual literacy training becoming standardized across pharmaceutical organizations
Cross-Industry Visualization Influences
Pharmaceutical visualization is increasingly being influenced by approaches from other fields:
- Gaming industry techniques for intuitive interaction with complex 3D environments
- Financial visualization approaches for representing risk and uncertainty in decision processes
- Urban planning methods for visualizing complex systems with multiple stakeholders
- Climate science techniques for representing multivariate data and scenario modeling
- Social network analysis visualization approaches for understanding relationship networks
As we look to the future, the visual language of AI in drug discovery will continue to evolve toward more intuitive, interactive, and integrative approaches. The most successful organizations will be those that effectively harness these emerging visualization paradigms to accelerate discovery, enhance collaboration, and maximize the complementary strengths of human expertise and artificial intelligence. PageOn.ai is positioned at the forefront of this evolution, offering conversation-driven visualization creation that adapts to these emerging trends without requiring users to master complex new tools or visual languages.
Transform Your Drug Discovery Visualizations with PageOn.ai
Harness the power of conversation-driven AI to create stunning, scientifically accurate visualizations without technical design skills. Turn complex pharmaceutical processes into clear visual expressions that accelerate discovery and improve collaboration.
Start Creating with PageOn.ai TodayYou Might Also Like
How to Design Science Lesson Plans That Captivate Students
Create science lesson plans that captivate students with hands-on activities, clear objectives, and real-world applications to foster curiosity and critical thinking.
How to Write a Scientific Review Article Step by Step
Learn how to write a review article in science step by step. Define research questions, synthesize findings, and structure your article for clarity and impact.
How to Write a Self-Performance Review with Practical Examples
Learn how to write a self-performance review with examples and tips. Use an employee performance review work self evaluation sample essay to guide your process.
How to Write a Spec Sheet Like a Pro? [+Templates]
Learn how to create a professional spec sheet with key components, step-by-step guidance, and free templates to ensure clarity and accuracy.