The Visual Evolution of American Infrastructure: From Canal Networks to Digital Highways
Understanding the transformative journey of America's connectivity backbone
Infrastructure development has been the foundation of American economic growth and national connectivity for over two centuries. From the early canal systems that first connected our waterways to today's sophisticated digital networks, each era has built upon the innovations of the past while fundamentally reshaping how we connect, trade, and communicate.
Introduction to Infrastructure Timelines and Their Importance
Infrastructure serves as the backbone of economic development and national connectivity, fundamentally shaping how societies function, trade, and communicate. Understanding the evolution of these systems provides critical insights into America's economic, social, and technological development over more than two centuries.
Visualizing this complex evolution presents significant challenges. Traditional static timelines often fail to capture the multifaceted relationships between different infrastructure systems and their impacts on economic and social development. This is where modern visualization tools demonstrate their value.

PageOn.ai transforms historical infrastructure data into compelling visual narratives that reveal patterns and connections not immediately apparent in textual descriptions or simple charts. By leveraging advanced visualization techniques, complex historical research topics become accessible and engaging.
Infrastructure development in America can be broadly categorized into three major phases, each representing a revolutionary leap in connectivity: the canal networks (1790s-1850s), the railway systems (1830s-1940s), the interstate highways (1950s-1990s), and finally, our current digital infrastructure networks (1990s-present). Each phase built upon previous systems while introducing transformative new capabilities.
The Four Major Phases of American Infrastructure
Timeline showing the overlapping development periods of each infrastructure type
                    gantt
                        dateFormat  YYYY
                        axisFormat  %Y
                        title American Infrastructure Evolution Timeline

                        section Canal Era
                        Canal Networks           :1790, 1860

                        section Railroad Era
                        Railway Systems          :1830, 1950

                        section Highway Era
                        Interstate Highways      :1950, 1990

                        section Digital Era
                        Digital Networks         :1990, 2023
America's Canal Era (1790s-1850s): Building the Nation's First Network
The vision behind America's early canal systems emerged from the young nation's need to establish reliable trade routes that could overcome geographical barriers and connect isolated communities. Prior to canals, overland transportation was prohibitively expensive—moving goods just 30 miles inland from coastal ports could double their cost.

Canal development represented America's first major construction company profile in infrastructure investment, with both public and private capital funding these ambitious projects. State governments recognized the economic potential of improved transportation and often provided financial backing that would be difficult to secure today.
The Erie Canal Revolution
The Erie Canal stands as the most transformative infrastructure project of this early era. Completed in 1825 after eight years of construction, this 363-mile waterway connected the Hudson River to Lake Erie, effectively linking the Atlantic Ocean to the Great Lakes system. The economic impact was immediate and profound.
Economic Impact of the Erie Canal: Shipping Costs per Ton
Dramatic reduction in transportation costs after canal completion (1825)
PageOn.ai's AI Blocks feature enables the construction of layered historical maps showing population growth along canal routes. These visualizations reveal how canal towns like Rochester, Syracuse, and Buffalo experienced explosive growth, transforming from small settlements into thriving commercial centers within a single generation.
By the 1840s, America had built over 3,000 miles of canals, creating a network that facilitated unprecedented economic growth. However, even as canal construction reached its peak, a new transportation technology was beginning to emerge that would eventually supersede waterways—the railroad.
The Railroad Transformation (1830s-1940s): Creating the Industrial Backbone
Railways represented a dramatic technological leap over canal systems, offering faster travel speeds, year-round operation (canals often froze in winter), and the ability to reach locations inaccessible to waterways. While canals and railways initially developed as complementary systems, the superior flexibility and efficiency of rail transport eventually established it as America's dominant transportation mode.
Growth of U.S. Railroad Network (1830-1920)
Exponential expansion of rail infrastructure during the industrial revolution

The Transcontinental Railroad: Unifying East and West
The completion of the First Transcontinental Railroad in 1869 marked a pivotal moment in American infrastructure development. This monumental project connected the existing eastern rail network with the Pacific coast, reducing coast-to-coast travel time from months to approximately one week.
Beyond the impressive engineering achievement, the transcontinental railroad fundamentally reshaped American society. The ability to move people and goods quickly across vast distances accelerated westward expansion, transformed agricultural practices by connecting farmers to distant markets, and contributed to the displacement of Native American populations across the western territories.
Transcontinental Railroad Construction Timeline
Key milestones in completing the historic rail connection
                    timeline
                        title Transcontinental Railroad Key Milestones
                        section Planning
                          1862 : Pacific Railroad Acts passed by Congress
                          1863 : Central Pacific begins construction in Sacramento
                          1865 : Union Pacific begins construction in Omaha
                        section Construction
                          1866 : CP overcomes Sierra Nevada challenges
                          1867 : UP completes 240 miles across Nebraska
                          1868 : UP crosses Wyoming, CP reaches Nevada
                        section Completion
                          May 10, 1869 : Golden Spike ceremony at Promontory Summit, Utah
                          1872 : Continuous rail connection from New York to San Francisco
                          1883 : Creation of standardized time zones for railroad schedules
PageOn.ai's Deep Search capability allows users to incorporate authentic historical photographs and engineering diagrams, enriching the visual narrative with period-specific materials that bring the railroad era to life. This technology industry insights feature enables a deeper understanding of how rail infrastructure shaped America's industrial development throughout the 19th century.
The Interstate Highway System (1950s-1990s): Democratizing Mobility
The post-World War II era saw America confronting new infrastructure challenges. The rapid increase in automobile ownership, suburban expansion, and Cold War defense concerns all contributed to the vision for a comprehensive national highway system. President Dwight D. Eisenhower, drawing on his experiences with Germany's autobahn network during the war, championed what would become the Interstate Highway System.

The Federal Aid Highway Act of 1956 authorized the construction of 41,000 miles of controlled-access highways, with the federal government covering 90% of the costs. This massive public works project would transform American mobility, commerce, and urban development patterns over the following decades.
Interstate Highway System Development Process
Key stages from planning to implementation of the national highway network
                    flowchart TD
                        A[Federal Planning & Funding\n1956 Highway Act] -->|90% Federal\n10% State| B[Route Selection]
                        B --> C[Land Acquisition]
                        C --> D[Engineering & Design]
                        D --> E[Construction Begins]
                        E --> F[Initial Segments Completed\n1950s-1960s]
                        F --> G[Major Urban Sections\n1960s-1970s]
                        G --> H[Rural Connections\n1970s-1980s]
                        H --> I[System Substantially\nComplete by 1990s]

                        style A fill:#FF8000,color:white
                        style I fill:#FF8000,color:white
This system of flowchart examples helps visualize the complex, decades-long process of implementing the Interstate Highway System, highlighting the coordination required between federal, state, and local authorities.
Geographic and Economic Impact Analysis
The interstate system radically transformed American geography, both physically and economically. Cities with favorable highway access experienced accelerated growth, while those bypassed often faced economic challenges. The system enabled the rise of suburban communities, transformed retail with the emergence of shopping malls, and created new dynamics in housing and employment patterns.
Economic Impact of the Interstate Highway System
Influence on job creation, mobility, and national productivity
PageOn.ai's visualization capabilities are particularly valuable when creating dynamic comparative visuals between pre-highway and post-highway America. These before/after visualizations highlight the dramatic reshaping of urban landscapes, the birth of edge cities, and the decline of traditional downtowns that characterized mid-to-late 20th century development patterns.
Digital Infrastructure Networks (1990s-Present): The Invisible Revolution
While previous infrastructure revolutions were highly visible in the physical landscape, digital infrastructure represents a partially invisible revolution. Despite its less obvious physical presence, this newest layer of national infrastructure has arguably transformed society more rapidly and fundamentally than any previous system.

Digital infrastructure evolved from the early ARPANET of the 1960s to the commercial internet of the 1990s, and then to today's high-speed fiber networks, cellular systems, and satellite constellations. This evolution represents a fascinating shift in how we conceptualize connectivity—from physical roads and rails to information pathways that enable instantaneous global communication.
The Physical Internet: Datacenters, Cables, and Satellites
Despite its seemingly virtual nature, the internet relies on an extensive physical infrastructure of fiber optic cables, data centers, cell towers, and satellites. Understanding these physical components is crucial to visualizing how digital networks function and where they may be vulnerable.
Components of Modern Digital Infrastructure
Distribution of physical elements supporting the internet
PageOn.ai's Vibe Creation feature excels at transforming these complex network maps into comprehensible visual stories. By applying intuitive visual metaphors, color coding, and strategic simplification, these tools make digital infrastructure concepts accessible even to non-technical audiences.
Perhaps most interestingly, digital networks often follow the geographical pathways established by previous infrastructure systems. Fiber optic cables frequently run alongside railroad tracks, utilizing existing right-of-way corridors. Similarly, data centers tend to cluster near power plants and major highway interchanges, demonstrating how each infrastructure layer builds upon and extends previous networks.
Comparative Analysis Across Infrastructure Eras
Examining America's major infrastructure systems side by side reveals fascinating patterns in development, technology adoption, and social impact. While each era introduced new capabilities and overcame previous limitations, certain consistent themes emerge across all periods.
| Infrastructure Type | Peak Development Period | Primary Funding Model | Key Innovation | Primary Economic Impact |
|---|---|---|---|---|
| Canal Networks | 1820s-1840s | State government bonds | Lock systems for elevation changes | 90% reduction in shipping costs |
| Railways | 1870s-1900s | Private investment with government land grants | Standardized gauge & network integration | Industrial expansion & national markets |
| Interstate Highways | 1950s-1970s | Federal gas tax (90% federal funding) | Limited access design standards | Suburban development & consumer mobility |
| Digital Networks | 1990s-Present | Mixed public/private with regulatory oversight | Packet-switching & distributed routing | Information economy & global connectivity |
One striking pattern is the accelerating pace of adoption across infrastructure eras. While canal systems took approximately 50 years to reach maturity, railways achieved similar penetration in about 40 years. Interstate highways reached completion in roughly 35 years, while core internet infrastructure was deployed nationwide in less than 20 years.
PageOn.ai's AI Blocks feature enables the creation of multi-layered maps showing all infrastructure systems simultaneously. This layered approach reveals how each system influenced subsequent development patterns, with newer networks often following routes established by previous infrastructure investments. This perspective on infrastructure as an evolving, cumulative system provides valuable insights for planners, historians, and policymakers alike.
Future Infrastructure Trajectories: 2025 and Beyond
As we look toward the future, several emerging technologies and concepts are poised to form the next layer of America's infrastructure systems. These developments will both build upon and transcend existing networks, potentially transforming mobility, connectivity, and resource distribution in the coming decades.
Analyzing trends in global economy 2025 projections helps identify the most promising areas for infrastructure investment. Advanced transportation systems, renewable energy networks, and enhanced digital connectivity represent particularly active fields of development.
Emerging Infrastructure Technologies (2025-2040)
Projected development timeline for next-generation infrastructure systems
Several key technologies stand out as potential transformative forces:
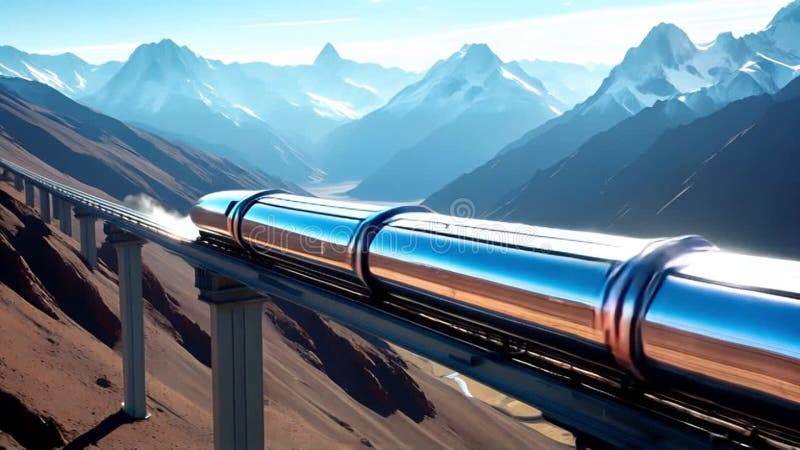
- Hyperloop Transportation: Vacuum tube transport systems promising speeds up to 700 mph could revolutionize inter-city travel, potentially making daily commutes feasible between cities hundreds of miles apart.
- Smart Highways: Embedding sensors, wireless charging capability, and real-time monitoring into roadway surfaces could enhance safety and enable more efficient autonomous vehicle operation.
- Quantum Internet: Utilizing quantum properties to create unhackable communication networks could fundamentally reform data security and transmission capabilities.
- Urban Air Mobility: Electric vertical takeoff and landing (eVTOL) aircraft systems for urban transportation could add an entirely new dimension to metropolitan mobility.
PageOn.ai's Agentic capabilities excel at generating visually compelling future infrastructure scenarios based on current development trends and technological projections. These visualizations help stakeholders conceptualize potential futures, facilitating more informed planning and investment decisions for next-generation infrastructure systems.
Conclusion: The Continuous Evolution of Connectivity
America's infrastructure story reveals a continuous pattern of evolution, with each new system building upon, extending, and eventually transcending its predecessors. From the water-based networks of the canal era to the invisible pathways of digital infrastructure, each transition has accelerated economic development while fundamentally reshaping society.

Several key patterns emerge from this visual journey through American infrastructure:
- Accelerating Innovation Cycles: The time between major infrastructure revolutions has consistently shortened, from ~60 years (canals to railways) to ~40 years (railways to highways) to ~30 years (highways to digital).
- Persistent Geographic Influence: Despite technological advances, geography continues to shape infrastructure deployment, with natural features like mountain ranges and waterways influencing route selection across all eras.
- Evolving Public-Private Partnership: The balance between government investment and private enterprise has shifted across eras, with each infrastructure type finding a different formula for development and maintenance.
- Layered Development: New infrastructure systems rarely replace previous networks entirely; instead, they form additional layers of connectivity that coexist and often physically overlap with established systems.
Infrastructure Layers Through American History
Visualization of how each system builds upon previous networks
                    flowchart TD
                        A[Natural Waterways\nPre-Industrial America] --> B[Canal Networks\n1790s-1850s]
                        B --> C[Railroad Systems\n1830s-1940s]
                        C --> D[Interstate Highways\n1950s-1990s]
                        D --> E[Digital Networks\n1990s-Present]
                        E --> F[Future Systems\n2025+]

                        style A fill:#BBEEBB,stroke:#009900
                        style B fill:#AADDEE,stroke:#0088CC
                        style C fill:#DDBBEE,stroke:#8800CC
                        style D fill:#EEBBAA,stroke:#CC4400
                        style E fill:#BBBBEE,stroke:#4444CC
                        style F fill:#FF8000,stroke:#CC4400
PageOn.ai provides the capabilities needed to create comprehensive, zoomable visualizations that encompass all infrastructure eras in a single cohesive presentation. These visual tools allow users to trace the continuous threads of innovation, geographic influence, and economic transformation that characterize America's infrastructure development over more than two centuries.
As we look to the future, visualizing these historical patterns provides valuable context for understanding how emerging technologies might reshape our physical and digital landscapes. By understanding the evolutionary nature of infrastructure systems, we gain insight into how today's investments will shape tomorrow's connectivity networks.
Transform Your Infrastructure Visualizations with PageOn.ai
Create stunning timelines, interactive maps, and compelling visual narratives that bring infrastructure evolution to life. From historical documentation to future planning, PageOn.ai's advanced visualization tools make complex infrastructure stories clear and engaging.
Start Creating with PageOn.ai TodayYou Might Also Like
How to Design Science Lesson Plans That Captivate Students
Create science lesson plans that captivate students with hands-on activities, clear objectives, and real-world applications to foster curiosity and critical thinking.
How to Write a Scientific Review Article Step by Step
Learn how to write a review article in science step by step. Define research questions, synthesize findings, and structure your article for clarity and impact.
How to Write a Self-Performance Review with Practical Examples
Learn how to write a self-performance review with examples and tips. Use an employee performance review work self evaluation sample essay to guide your process.
How to Write a Spec Sheet Like a Pro? [+Templates]
Learn how to create a professional spec sheet with key components, step-by-step guidance, and free templates to ensure clarity and accuracy.