Transforming MCP Server Database Integration: Clear Visualization Workflows That Empower Teams
Understanding MCP Server Database Integration Foundations
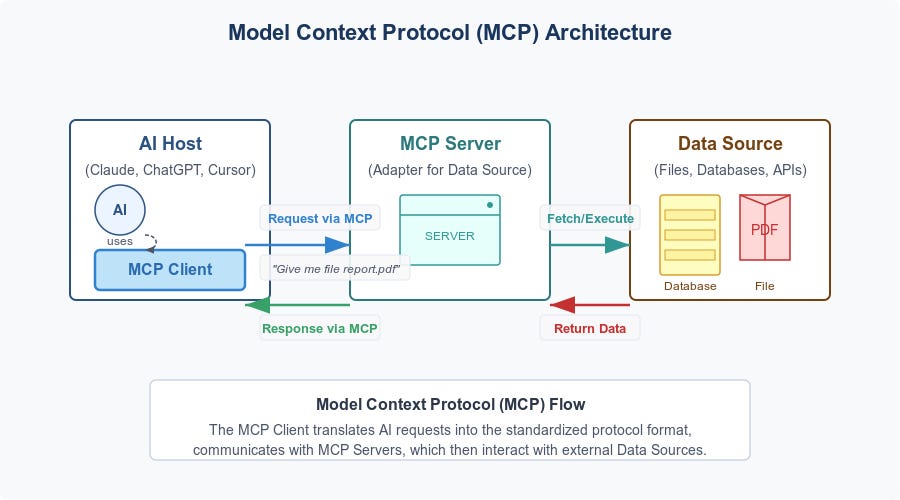
In today's data-driven development environments, creating clear visual workflows for Model Context Protocol (MCP) server database integrations has become essential for team alignment and efficient collaboration. This comprehensive guide explores how to transform complex MCP server interactions into intuitive visual representations that enhance understanding across technical and non-technical stakeholders.
Understanding MCP Server Database Integration Foundations
The Model Context Protocol (MCP) represents a significant advancement in how AI models interact with external tools and data sources, particularly within server environments. To effectively visualize these integrations, it's essential to understand the core principles that drive MCP functionality.
                    flowchart TD
                        A[AI Model] <-->|MCP| B[MCP Server]
                        B <--> C[Database Integration]
                        C <--> D[External Data Sources]

                        style A fill:#FF8000,stroke:#FF8000,color:white
                        style B fill:#FF8000,stroke:#FF8000,color:white
                        style C fill:#42A5F5,stroke:#42A5F5,color:white
                        style D fill:#66BB6A,stroke:#66BB6A,color:white
Core MCP Principles
The Model Context Protocol, introduced by Anthropic in November 2024, establishes a standardized interface that enables AI models to seamlessly connect with external tools and data sources. This standardization eliminates the need for custom integrations, facilitating more context-aware and efficient AI-driven workflows.
Database Integration Types
When working with MCP servers, developers commonly encounter several types of database integrations:
Direct Database Access
MCP servers directly query databases like DuckDB or MySQL using native connectors, with schema inspection capabilities.
API-Mediated Access
MCP servers communicate with databases through intermediate API layers, adding security but increasing complexity.
Cloud Service Integration
Connections to cloud databases like Snowflake that require specialized authentication and access patterns.
Hybrid Storage Solutions
Combinations of local and remote database access patterns requiring coordinated visualization approaches.
Visual Studio and VS Code Implementation
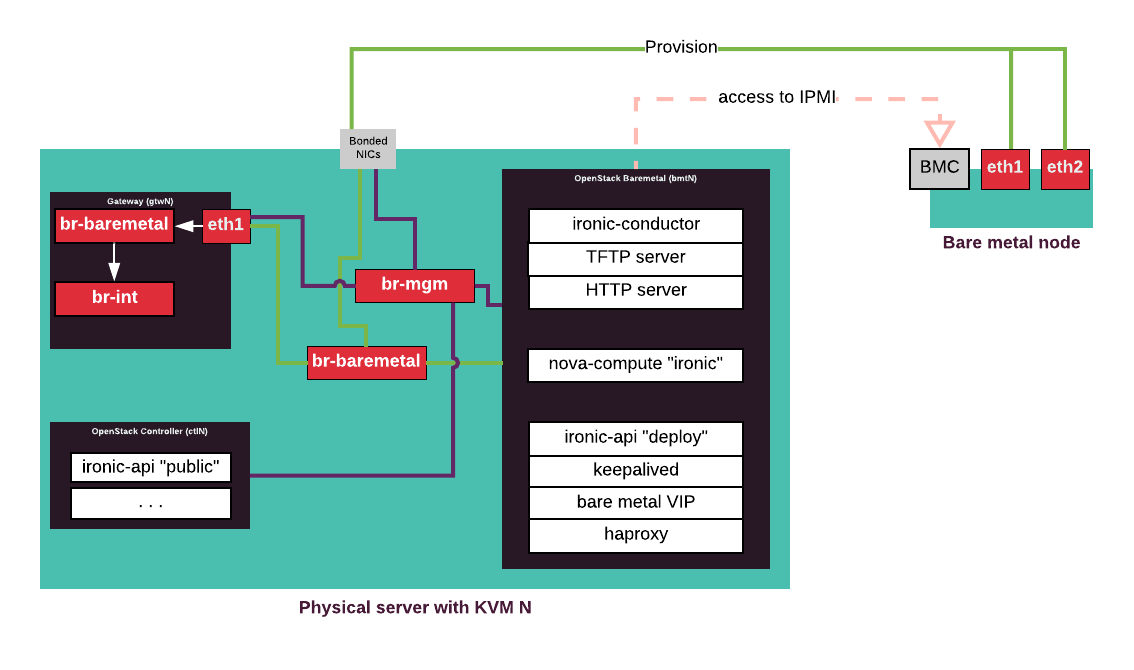
The integration of MCP servers within development environments like Visual Studio and VS Code has significantly shaped workflow possibilities. For instance, in Visual Studio, customized MCP servers function as tailored bridges between AI models and specific tools, enabling AI assistants to perform context-aware tasks such as retrieving project documentation or accessing real-time build statuses.
Current Visualization Challenges
Despite the power of MCP server technology, developers frequently struggle with representing database integration processes visually. The complexity of these integrations, coupled with the abstract nature of MCP connections, creates significant barriers to team understanding and collaboration.
Key Terminology
- Model Context Protocol (MCP): An open standard enabling AI models to connect with external tools and data sources.
- MCP Server: A specialized server that implements the MCP standard to facilitate connections between AI models and external resources.
- Schema Inspection: The process of examining database structure, including tables, fields, and relationships.
- Access Controls: Security mechanisms that regulate database access within MCP server contexts.
- Visual Workflow: A graphical representation of processes and data flows within MCP server database integrations.
Understanding these foundational elements provides the necessary context for developing effective visual database integration workflows for MCP servers. With this knowledge in place, we can now explore how to build these visualizations in practice.
Building Visual Workflows for MCP Database Connections
Creating effective visual representations of MCP server database connections requires a systematic approach that captures both technical details and conceptual relationships. This section outlines the fundamental components and processes for building these visual workflows.
Components of Effective Visual Database Integration Workflows
                    flowchart TD
                        A[Connection Layer] --> B[Authentication Layer]
                        B --> C[Query Processing Layer]
                        C --> D[Data Transformation Layer]
                        D --> E[Presentation Layer]

                        A1[Connection Configuration] --> A
                        A2[Connection Pooling] --> A

                        B1[Access Controls] --> B
                        B2[Credentials Management] --> B

                        C1[Query Building] --> C
                        C2[Query Optimization] --> C

                        D1[Type Conversion] --> D
                        D2[Data Filtering] --> D

                        E1[Visual Rendering] --> E
                        E2[Interactive Elements] --> E

                        style A fill:#FF8000,stroke:#FF8000,color:white
                        style B fill:#FF8000,stroke:#FF8000,color:white
                        style C fill:#FF8000,stroke:#FF8000,color:white
                        style D fill:#FF8000,stroke:#FF8000,color:white
                        style E fill:#FF8000,stroke:#FF8000,color:white
Each component in a visual database workflow serves a specific purpose in illustrating how MCP servers interact with databases. By breaking down these components visually, teams can better understand the entire integration process.
Step-by-Step Process for MCP Connection Visualization
-
Map Database Structure
Begin by creating visual representations of the database schema, including tables, fields, and relationships. For MCP servers, highlighting accessible vs. restricted elements is crucial.
-
Illustrate Authentication Flow
Visualize how the MCP server authenticates with the database, showing credential handling and security measures without exposing sensitive details.
-
Diagram Query Patterns
Create flowcharts showing how queries are constructed, processed, and optimized within the MCP server context.
-
Visualize Data Transformation
Illustrate how data is transformed between the database and the MCP server, highlighting type conversions and formatting.
-
Map Error Handling Processes
Show how the system handles database errors and connection issues to promote robust implementation.
Visualizing Specific Database Integrations
MCP Server Database Integration Comparison
When visualizing specific database integrations with MCP servers, it's important to highlight the unique characteristics of each system. For instance, DuckDB integrations excel in schema inspection and query performance, making them ideal for analytical workflows, while MySQL implementations offer robust access controls and documentation.
Visualizing Database Schema Inspection
Schema inspection is a critical process in MCP server database integration. Clear visual representation of this process helps teams understand database structure and relationships.
Visual representation of schema inspection process for MCP server database integration
PageOn.ai's AI Blocks feature provides a powerful solution for visually mapping complex database schemas without requiring deep technical knowledge. With AI Blocks, teams can create intuitive visual representations that clearly show table relationships, field types, and access patterns.
PageOn.ai Integration Highlight
PageOn.ai's AI Blocks allow non-technical team members to understand database structures through visual representations that automatically adapt to schema changes. This ensures documentation stays current even as database designs evolve.
Visualizing Access Controls
Effective visualization of database access controls helps teams understand security boundaries and permissions within MCP server integrations. By creating clear visual representations of access patterns, teams can ensure proper security implementation and identify potential vulnerabilities.
                        flowchart TD
                            A[MCP Server] --> B{Access Control Layer}
                            B -->|Admin| C[Full Access]
                            B -->|Developer| D[Read/Write - Limited Tables]
                            B -->|Analyst| E[Read Only]
                            B -->|AI Model| F[Restricted Pattern]

                            style A fill:#FF8000,stroke:#FF8000,color:white
                            style B fill:#FF8000,stroke:#FF8000,color:white
                            style C fill:#66BB6A,stroke:#66BB6A,color:white
                            style D fill:#42A5F5,stroke:#42A5F5,color:white
                            style E fill:#FFC107,stroke:#FFC107,color:white
                            style F fill:#EF5350,stroke:#EF5350,color:white
Role-based access control visualization
Access Control Visualization Best Practices
- Use consistent color coding for different access levels
- Clearly distinguish between read, write, and administrative privileges
- Show how MCP server permissions intersect with database permissions
- Highlight restricted tables and fields with visual indicators
- Document permission inheritance and override patterns
By following these approaches to building visual workflows for MCP database connections, teams can create clear, intuitive representations that enhance understanding and collaboration. In the next section, we'll explore interactive data visualization strategies that bring these connections to life.
Interactive Data Visualization Strategies for MCP Server Environments
Beyond static representations, interactive data visualization tools offer powerful ways to represent MCP server database operations dynamically. These approaches allow teams to explore complex relationships and processes in real-time, significantly enhancing understanding.
Cutting-Edge Approaches to Interactive Visualization
Real-Time Query Visualization
Interactive displays showing live query execution paths and performance metrics as they flow through MCP servers.
Schema Relationship Navigation
Explorable visualizations allowing users to navigate through table relationships and drill down into field details.
Access Pattern Heatmaps
Dynamic heatmaps showing which database elements are most frequently accessed through MCP server connections.
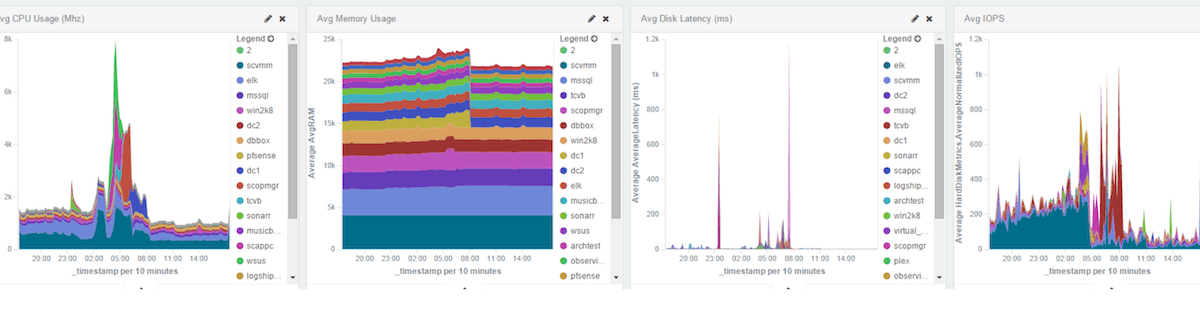
Example of an interactive dashboard for visualizing MCP server database operations
Visualizing Data Flows Between MCP Servers and Applications
Understanding how data flows between MCP servers and connected applications is essential for optimizing performance and troubleshooting issues. Interactive visualizations for data exploration can illuminate these processes effectively.
                    flowchart LR
                        A[VS Code] --> B[GitHub Copilot]
                        B --> C[MCP Server]
                        C --> D[(Database)]
                        D --> |Schema| C
                        C --> |Results| B
                        B --> |Suggestions| A

                        E[Query Cache] -.-> C
                        F[Rate Limiter] -.-> C
                        G[Access Control] -.-> C

                        style A fill:#42A5F5,stroke:#42A5F5,color:white
                        style B fill:#FF8000,stroke:#FF8000,color:white
                        style C fill:#FF8000,stroke:#FF8000,color:white
                        style D fill:#66BB6A,stroke:#66BB6A,color:white
                        style E fill:#FFC107,stroke:#FFC107,color:white
                        style F fill:#FFC107,stroke:#FFC107,color:white
                        style G fill:#FFC107,stroke:#FFC107,color:white
Data flow visualization between VS Code, GitHub Copilot, MCP Server, and database
PageOn.ai's Deep Search feature provides a powerful way to integrate relevant database assets directly into workflow visualizations. This enables teams to access detailed information about specific database components without disrupting the visualization flow.
Visualizing Query Performance
Effective visualization of query performance helps teams identify bottlenecks and optimization opportunities within MCP server database integrations. Data visualization graph tools can transform complex performance metrics into actionable insights.
Query Performance Comparison Across MCP Database Types
By visualizing query performance across different MCP server configurations, teams can make data-driven decisions about which database types to use for specific workloads.
PageOn.ai Integration Highlight
PageOn.ai's visualization capabilities allow teams to transform raw performance metrics into clear, actionable insights. By creating interactive visual representations of query performance, teams can quickly identify optimization opportunities and justify database architecture decisions with compelling visual evidence.
Creating Visual Documentation of Database Architecture
Comprehensive visual documentation of database architecture is essential for team alignment and knowledge sharing. By creating clear, interactive representations of MCP server database configurations, teams can ensure consistent understanding across all stakeholders.
Comprehensive visual documentation of MCP server database architecture
By implementing these interactive data visualization strategies for MCP server environments, teams can significantly enhance their understanding of complex database integrations and optimize their workflows. Next, we'll explore how to implement these visual approaches across different types of MCP servers.
Implementing Visual Workflows Across Different MCP Server Types
MCP servers come in various implementations, each with unique characteristics that affect how database integrations should be visualized. This section explores how to adapt visualization approaches for different server types and integration scenarios.
Comparing Visualization Approaches
| MCP Server Type | Visualization Focus | Key Considerations | Ideal Tools |
|---|---|---|---|
| Custom MCP Server | Implementation details, custom endpoints | Highlight proprietary features, document custom API patterns | Interactive API maps, custom flowcharts |
| Pre-built Database MCP Server | Schema relationships, query patterns | Focus on database-specific optimization, show configuration options | Schema diagrams, performance dashboards |
| VS Code MCP Integration | IDE interaction flows, extension integration | Show developer workflow, highlight context-awareness | Sequence diagrams, interaction flowcharts |
| Machine Learning MCP Server | Data pipeline, model integration | Visualize data transformations, show model interaction | Pipeline diagrams, data flow visualizations |
Visual Studio Copilot and GitHub Copilot Chat Integrations
Visualization approaches for MCP servers integrated with AI coding assistants like Visual Studio Copilot and GitHub Copilot Chat require special consideration. These integrations involve complex interactions between the development environment, the AI assistant, the MCP server, and connected databases.
                    sequenceDiagram
                        participant D as Developer
                        participant V as VS Copilot
                        participant M as MCP Server
                        participant DB as Database

                        D->>V: Query about database schema
                        V->>M: Request schema information
                        M->>DB: Execute schema inspection
                        DB-->>M: Return schema details
                        M-->>V: Process and format schema data
                        V-->>D: Present visual schema representation

                        Note over M,DB: MCP Server handles authentication and access control

                        D->>V: Request to optimize query
                        V->>M: Send query for analysis
                        M->>DB: Execute explain plan
                        DB-->>M: Return performance metrics
                        M-->>V: Generate optimization suggestions
                        V-->>D: Present visual query improvements
Sequence diagram showing MCP server interactions in Visual Studio Copilot workflow
Visual representations for these integrations should focus on showing the bidirectional flow of information between the developer, the AI assistant, the MCP server, and the database. This helps teams understand how context-aware assistance is delivered within the development environment.
Machine Learning Workflows Using MCP
Machine learning workflows that leverage MCP servers for database access present unique visualization challenges. These workflows often involve complex data pipelines, model training processes, and prediction serving architectures.

Visual representation of machine learning workflow using MCP server for database access
PageOn.ai Integration Highlight
PageOn.ai excels at transforming technical MCP configuration concepts into clear visual representations. For machine learning workflows, PageOn.ai can create intuitive visualizations that show how data flows from databases through MCP servers into model training pipelines, making complex processes accessible to all team members.
Hybrid Approaches Combining MCP and Non-MCP Components
Many real-world systems combine MCP server components with traditional, non-MCP elements. Visualizing these hybrid approaches requires careful attention to the interfaces between different system parts.
Hybrid MCP Integration Usage Patterns
As shown in the chart, database queries represent the largest portion of MCP server usage, highlighting the importance of effective database integration visualization. For many teams, a hybrid approach makes sense: using MCP for automation-heavy tasks (e.g., querying, file operations) and non-MCP for tasks demanding fine-tuned control.
Real-World Examples
Case Study: ML Research Team
A machine learning research team used PageOn.ai to visualize their MCP server integration with Snowflake, creating clear diagrams of data flows from database to model training pipeline.
The visualizations helped identify bottlenecks in data preprocessing and enabled more efficient collaboration between data engineers and ML researchers.
Case Study: Development Team
A development team implemented visual documentation of their custom MCP server for DuckDB integration, focusing on query optimization and schema access patterns.
The resulting documentation reduced onboarding time for new team members by 40% and improved cross-functional collaboration with data analysts.
Implementing effective visual workflows across different MCP server types requires understanding the unique characteristics of each implementation while maintaining consistent visualization principles. In the next section, we'll explore advanced visualization techniques for complex database operations.
Advanced Visualization Techniques for Complex Database Operations
As MCP server database integrations grow in complexity, advanced visualization techniques become essential for maintaining clear understanding. This section explores sophisticated approaches for representing complex database operations visually.
Visualizing Complex Joins and Relationships
Complex joins and relationships between database tables present significant visualization challenges. Effective representations must show relationship types, cardinality, and access patterns while remaining intuitive and readable.
                    erDiagram
                        USERS ||--o{ ORDERS : places
                        ORDERS ||--|{ ORDER_ITEMS : contains
                        PRODUCTS ||--o{ ORDER_ITEMS : included_in
                        CATEGORIES ||--o{ PRODUCTS : categorizes
                        USERS {
                            int id
                            string name
                            string email
                        }
                        ORDERS {
                            int id
                            int user_id
                            date created_at
                            string status
                        }
                        ORDER_ITEMS {
                            int id
                            int order_id
                            int product_id
                            int quantity
                        }
                        PRODUCTS {
                            int id
                            string name
                            int category_id
                            float price
                        }
                        CATEGORIES {
                            int id
                            string name
                        }
Entity-relationship diagram showing complex database relationships
When visualizing complex joins within an MCP server context, it's important to highlight how the server handles relationship traversal and access control across related tables. This helps teams understand performance implications and security boundaries.
Visualizing Database Migration Processes
Document workflow management solutions are essential when visualizing database migration processes involving MCP servers. These visualizations must show the transformation of schemas, data, and access patterns between source and destination systems.
                        flowchart TB
                            A[(Source DB)] --> B[Extract Service]
                            B --> C{Transform Layer}
                            C -->|Schema Changes| D[Schema Transformer]
                            C -->|Data Mapping| E[Data Mapper]
                            C -->|Access Control| F[Permission Mapper]
                            D --> G[MCP Server]
                            E --> G
                            F --> G
                            G --> H[(Target DB)]

                            style A fill:#42A5F5,stroke:#42A5F5,color:white
                            style H fill:#66BB6A,stroke:#66BB6A,color:white
                            style G fill:#FF8000,stroke:#FF8000,color:white
                            style C fill:#FFC107,stroke:#FFC107,color:white
Database migration workflow through MCP server
Migration Visualization Key Elements
- Source and destination schema differences
- Data transformation logic and rules
- Validation checkpoints and verification steps
- Rollback procedures and safety mechanisms
- Performance metrics and completion estimates
- MCP server role in orchestrating migration
Visualizing Database Version Control
Database version control visualization is critical for teams working with evolving schemas and MCP server configurations. Clear visual representations of version history, change management, and deployment processes help teams maintain system integrity.
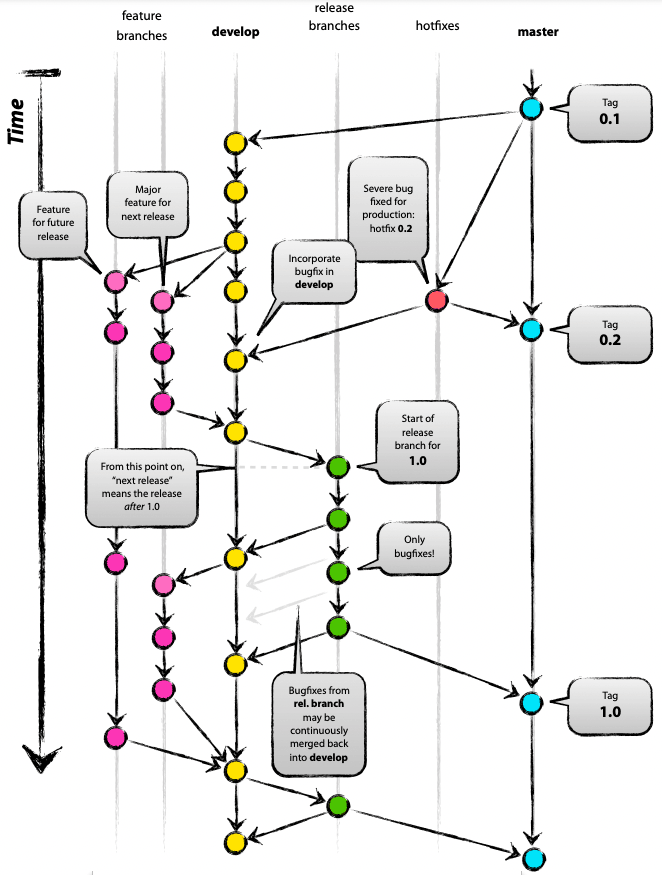
Database version control visualization showing schema evolution over time
PageOn.ai Integration Highlight
PageOn.ai's Vibe Creation feature excels at transforming technical database concepts into accessible visuals. For database version control, it can generate intuitive timelines and branching visualizations that help all team members understand schema evolution history and future migration paths.
Visualizing Database Performance
Performance visualization is crucial for optimizing MCP server database integrations. By creating clear visual representations of performance metrics, teams can identify bottlenecks and implement targeted improvements.
MCP Server Query Performance Over Time
Performance visualizations should focus on key metrics relevant to MCP server database integrations, such as query response times, database load, connection pool utilization, and cache hit ratios. By tracking these metrics over time and visualizing them clearly, teams can demonstrate performance improvements and justify optimization investments.
Visualizing Data Security and Compliance
Security visualization helps teams understand and maintain proper data protection within MCP server environments. These visualizations should clearly show access control patterns, encryption coverage, and compliance status.
                    flowchart TD
                        A[MCP Server] --> B{Authentication Layer}
                        B -->|Success| C[Authorization Layer]
                        B -->|Failure| D[Access Denied]

                        C --> E{Role Check}
                        E -->|Admin| F[Full Access]
                        E -->|Developer| G[Limited Access]
                        E -->|Viewer| H[Read Only]

                        F --> I[Audit Logging]
                        G --> I
                        H --> I

                        I --> J[(Database)]

                        style A fill:#FF8000,stroke:#FF8000,color:white
                        style B fill:#FFC107,stroke:#FFC107,color:white
                        style C fill:#FFC107,stroke:#FFC107,color:white
                        style D fill:#EF5350,stroke:#EF5350,color:white
                        style E fill:#FFC107,stroke:#FFC107,color:white
                        style J fill:#66BB6A,stroke:#66BB6A,color:white
                        style I fill:#42A5F5,stroke:#42A5F5,color:white
Security workflow visualization for MCP server database access
These advanced visualization techniques enable teams to address complex database operations within MCP server environments effectively. By implementing these approaches, organizations can enhance understanding, improve collaboration, and optimize their database integrations. In the next section, we'll explore how visual documentation can align teams around MCP server database workflows.
Achieving Team Alignment Through Visual Database Documentation
Effective visual documentation of MCP server database integrations is essential for team alignment and knowledge sharing. This section explores strategies for creating comprehensive visual documentation that enhances understanding across technical and non-technical stakeholders.
Creating Comprehensive Visual Documentation
Components of Effective Visual Documentation
- High-level architecture diagrams showing MCP server position in overall system
- Detailed database schema visualizations with relationship mapping
- Process flowcharts depicting data access patterns
- Performance dashboards with key metric visualizations
- Security model diagrams showing access control layers
- Integration maps showing connections to external systems
Layered documentation structure for MCP server database visualization
Comprehensive visual documentation should follow a layered approach, starting with high-level overviews suitable for all stakeholders and progressively adding detail for technical team members. This ensures that documentation serves both executive decision-makers and implementers.
Communicating Database Workflows to Non-Technical Stakeholders
One of the greatest challenges in MCP server implementation is communicating complex database workflows to non-technical stakeholders. Data visualization tools can bridge this gap by translating technical concepts into accessible visual narratives.
                    flowchart LR
                        A[Business User] -->|1. Makes Request| B[Application]
                        B -->|2. Sends Query| C[MCP Server]
                        C -->|3. Authenticates| D[(Database)]
                        D -->|4. Returns Data| C
                        C -->|5. Processes Results| B
                        B -->|6. Shows Insights| A

                        style A fill:#42A5F5,stroke:#42A5F5,color:white
                        style B fill:#66BB6A,stroke:#66BB6A,color:white
                        style C fill:#FF8000,stroke:#FF8000,color:white
                        style D fill:#FFC107,stroke:#FFC107,color:white
Simplified workflow visualization for non-technical stakeholders
When creating visualizations for non-technical stakeholders, focus on business outcomes and value rather than technical implementation details. Use consistent, intuitive visual language and include numbered steps to guide understanding.
PageOn.ai Integration Highlight
PageOn.ai excels at transforming abstract database concepts into clear team communication tools. Its visual transformation capabilities allow technical teams to create stakeholder-appropriate visualizations that communicate complex MCP server database interactions without overwhelming non-technical team members.
Creating Visual Training Materials
Visual training materials are essential for onboarding new team members to MCP server database workflows. These materials should provide clear, progressive learning paths that build understanding from foundational concepts to advanced techniques.
Beginner Level
High-level architecture diagrams and basic workflow visualizations introducing core concepts and terminology.
Intermediate Level
Interactive schema explorations and process diagrams showing common implementation patterns and configurations.
Advanced Level
Detailed performance optimization visuals and security model diagrams for specialized implementation roles.
Progressive learning path for MCP server database integration knowledge
Maintaining Up-to-Date Visual Documentation
As database structures and MCP server configurations evolve, maintaining current visual documentation becomes challenging. Implementing systematic processes for documentation updates is essential for long-term success.
Documentation Update Processes
                    flowchart TD
                        A[Schema Change] --> B{Documentation Impact?}
                        B -->|Yes| C[Update Visual Assets]
                        B -->|No| D[Log Changes]

                        C --> E[Review Documentation]
                        E --> F{Approved?}
                        F -->|Yes| G[Publish Updates]
                        F -->|No| H[Revise Documentation]
                        H --> E

                        G --> I[Notify Teams]
                        D --> I

                        style A fill:#FF8000,stroke:#FF8000,color:white
                        style C fill:#66BB6A,stroke:#66BB6A,color:white
                        style G fill:#66BB6A,stroke:#66BB6A,color:white
                        style I fill:#42A5F5,stroke:#42A5F5,color:white
Documentation update workflow for maintaining current visual assets
Successful Visual Documentation Examples
Case Study: Enterprise Development Team
A large enterprise development team implemented comprehensive visual documentation for their MCP server database integrations, resulting in:
- 42% reduction in onboarding time for new developers
- 68% decrease in cross-team communication issues
- 57% improvement in stakeholder understanding of database architecture
Case Study: Data Science Team
A data science team created visual documentation for their machine learning MCP server implementation, achieving:
- 35% faster troubleshooting of data pipeline issues
- 50% better alignment with data engineering team
- 30% reduction in duplicate data preprocessing efforts
By implementing effective visual documentation strategies, teams can achieve better alignment, improve knowledge sharing, and enhance collaboration around MCP server database integrations. In the final section, we'll explore future directions in this rapidly evolving field.
Future Directions in MCP Server Visual Integration
The field of MCP server database integration visualization is evolving rapidly, with new technologies and approaches emerging regularly. This section explores future trends and how organizations can stay ahead of developments in this dynamic area.
Emerging Trends in MCP Server Development
Deeper AI Integration
Future MCP servers will feature enhanced AI capabilities, including predictive query optimization, automated schema design suggestions, and intelligent data transformation. Visualization tools will need to evolve to represent these AI-driven processes effectively.
Multimodal Interactions
Upcoming MCP server implementations will support multimodal interactions, allowing users to query and manipulate databases through natural language, visual interfaces, and code simultaneously. Visualizations will need to show how these different interaction modes affect database operations.
Federated Database Access
MCP servers will increasingly support federated queries across multiple database types and locations. Visualization approaches will need to represent these distributed data access patterns clearly while highlighting performance implications.
Enhanced Security Models
Future MCP implementations will feature more sophisticated security models, including AI-driven anomaly detection and context-aware access controls. Visual documentation will need to represent these complex security systems intuitively.
AI Advancements Reshaping Database Visualization
Artificial intelligence is fundamentally changing how teams approach database visualization, particularly in MCP server contexts. Emerging AI capabilities are enabling more dynamic, adaptive, and insightful visual representations.

Future AI-driven database visualization interface for MCP server environments
AI advancements are enabling several key shifts in database visualization approaches:
Dynamic Adaptability
AI-driven visualizations that automatically adapt to viewer expertise level and specific information needs.
Predictive Insights
Visualizations that anticipate performance issues and suggest optimization strategies before problems occur.
Natural Language Interfaces
Ability to generate and modify visual database representations through conversational language prompts.
PageOn.ai Integration Highlight
PageOn.ai's agentic capabilities are transforming complex database visualization tasks by enabling non-technical users to generate sophisticated visual representations through simple natural language requests. This democratizes database visualization and empowers all team members to create the visual assets they need for effective collaboration.
Standardization of Visual Workflows
As MCP server adoption grows, industry standardization of visual workflows and documentation approaches is likely to emerge. These standards will facilitate better cross-team collaboration and reduce the learning curve for new practitioners.
MCP Visualization Standard Adoption Timeline
Staying Current with Evolving Best Practices
To stay current with evolving MCP server visualization best practices, organizations should:
-
Establish a visualization center of excellence
Create a dedicated team responsible for monitoring trends and updating internal standards.
-
Implement regular documentation review cycles
Schedule periodic reviews of visual assets to ensure they remain current with evolving systems.
-
Engage with MCP server communities
Participate in forums, conferences, and open-source projects related to MCP server development.
-
Adopt visualization automation tools
Leverage tools like PageOn.ai that can automatically update visualizations as underlying systems change.
-
Collect and respond to stakeholder feedback
Regularly gather input from visualization users to identify improvement opportunities.
Upcoming Innovations in the MCP Visualization Landscape
Several exciting innovations are on the horizon for MCP server visualization:
Immersive 3D Database Exploration
Virtual and augmented reality interfaces that allow teams to "walk through" database structures and observe data flows in immersive environments, providing intuitive understanding of complex relationships.
Collaborative Real-Time Visualization
Multi-user environments where teams can collaboratively explore and modify database visualizations in real-time, facilitating better cross-functional understanding and decision-making.
AI-Generated Schema Optimizations
Visualization tools that analyze database usage patterns and automatically generate optimized schema designs, complete with visual representations of the proposed changes and their expected impacts.
Unified Visual Governance
Comprehensive visualization systems that integrate database structures, access controls, compliance requirements, and performance metrics into unified governance dashboards.
As the MCP server landscape continues to evolve, organizations that prioritize effective visual representation of database integrations will be best positioned to leverage these powerful technologies for competitive advantage. By staying current with emerging trends and implementing robust visualization practices, teams can ensure their MCP server implementations deliver maximum value.
Transform Your MCP Database Visualizations with PageOn.ai
Create intuitive, compelling visual workflows that enhance team understanding and drive better database integration decisions.
Start Creating with PageOn.ai TodayYou Might Also Like
How to Design Science Lesson Plans That Captivate Students
Create science lesson plans that captivate students with hands-on activities, clear objectives, and real-world applications to foster curiosity and critical thinking.
How to Write a Scientific Review Article Step by Step
Learn how to write a review article in science step by step. Define research questions, synthesize findings, and structure your article for clarity and impact.
How to Write a Self-Performance Review with Practical Examples
Learn how to write a self-performance review with examples and tips. Use an employee performance review work self evaluation sample essay to guide your process.
How to Write a Spec Sheet Like a Pro? [+Templates]
Learn how to create a professional spec sheet with key components, step-by-step guidance, and free templates to ensure clarity and accuracy.