Visualizing Your Path to Personal Success: How to Map and Measure What Truly Matters
Understanding Personal Success Metrics Beyond Standard Definitions
Traditional success markers like wealth, impressive titles, and material possessions often fail to deliver the lasting fulfillment we seek. By creating personalized success metrics aligned with your authentic values, you can redefine achievement on your own terms and visualize a path that truly resonates with what matters most to you.
Understanding Personal Success Metrics
In a world that often equates success with material wealth, prestigious titles, or social status, many people find themselves achieving these traditional markers only to discover they still feel unfulfilled. This disconnect occurs because true success is deeply personal and should align with your authentic values rather than societal expectations.

The Psychology of Personalized Metrics
When success metrics align with your internal values, they trigger intrinsic motivation – the most powerful and sustainable form of motivation. Research shows that intrinsically motivated individuals demonstrate greater persistence, creativity, and overall satisfaction. By contrast, pursuing externally defined success often leads to what psychologists call the "hedonic treadmill" – a constant chase for happiness that remains perpetually out of reach.
Motivation Types and Their Effects on Long-Term Fulfillment
Success Alignment
Success alignment refers to the harmony between what you measure as success and what genuinely matters to you. When your metrics reflect your authentic values, you experience greater congruence between your actions and your sense of self. This alignment creates a powerful feedback loop where achievement naturally leads to fulfillment rather than emptiness.
The Power of Visualization
Transforming abstract concepts of success into visual representations helps bridge the gap between intentions and actions. Visual processing engages different neural pathways than verbal processing alone, making your success metrics more memorable, emotionally resonant, and actionable. PageOn.ai's conversational approach helps you articulate deeply personal definitions of success and then transform them into compelling visual frameworks that inspire daily action.
When you can create goal-setting worksheets that represent your personal metrics visually, you activate more of your brain's resources toward achieving those goals. This visualization advantage is the difference between vague aspirations and crystal-clear pathways to meaningful achievement.
Crafting Your Success Visualization Framework
Identifying Core Values as Foundation
The foundation of meaningful success metrics starts with clearly identifying your core values – those principles that matter most deeply to you regardless of external recognition or reward. These values act as your internal compass, helping you determine which achievements will genuinely fulfill you versus those that might impress others but leave you feeling empty.
Values Discovery Process
flowchart TD
    A[Self-Reflection] --> B[Values Identification]
    B --> C[Values Prioritization]
    C --> D[Observable Behaviors]
    D --> E[Visual Representation]
    E --> F[Metrics Creation]

    style A fill:#FEF5E7,stroke:#FF8000
    style B fill:#FEF5E7,stroke:#FF8000
    style C fill:#FEF5E7,stroke:#FF8000
    style D fill:#FEF5E7,stroke:#FF8000
    style E fill:#FEF5E7,stroke:#FF8000
    style F fill:#FEF5E7,stroke:#FF8000
To discover your genuine personal values, consider moments in your life when you felt most proud, fulfilled, or energized. What principles were you honoring in those moments? Alternatively, think about times when you felt conflicted or drained – you may have been acting against your core values. PageOn.ai helps visualize these reflections, creating a values hierarchy unique to you.
Once identified, translate abstract values like integrity, courage, or mindfulness into observable behaviors. For example, if "continuous learning" is a core value, observable metrics might include books read, courses completed, or skills practiced. This translation process transforms abstract principles into concrete actions you can track.
Value Translation Exercise
| Core Value | Observable Behaviors | Possible Metrics |
|---|---|---|
| Mindfulness | Meditation, present-moment awareness, reduced reactivity | Minutes meditated daily, mindfulness journal entries, stress level ratings |
| Courage | Stepping outside comfort zone, speaking truth, trying new things | Comfort zone challenges accepted, difficult conversations initiated |
| Connection | Deep conversations, active listening, quality time | Meaningful interactions per week, promises kept, relationship feedback |
Categorizing Life Domains for Balanced Metrics
A comprehensive success framework requires metrics across different life domains to ensure holistic fulfillment. Consider these key areas when developing your personal KPI system:
Professional Domain
Beyond salary and titles, consider measuring career advancement through skill development, knowledge acquisition, relationship quality, and impact metrics. For example, instead of just targeting a promotion, you might measure the number of colleagues you've mentored, complex problems you've solved, or innovations you've contributed.
When setting work goals, focus on quality and impact over quantity. Track how your work aligns with your values rather than just your output or recognition.
Personal Well-being Domain
Your well-being comprises mental, physical, financial, and temporal dimensions. Consider tracking meditation consistency, stress reduction techniques, exercise habits, nutritional choices, sleep quality, financial stability measures, and time abundance metrics. These indicators provide a comprehensive picture of how well you're nurturing yourself.
Relationship Domain
Relationship metrics might include connection depth, authenticity measurements, and promise fulfillment tracking. As highlighted by some researchers, tracking outstanding promises can dramatically improve relationship reliability. Consider measuring community contribution, belonging indicators, and the legacy you're creating through your interactions with others.
Use SMART goals for work techniques to ensure your relationship metrics are as specific and measurable as your professional ones. This structured approach prevents vague aspirations from replacing concrete action in your personal connections.
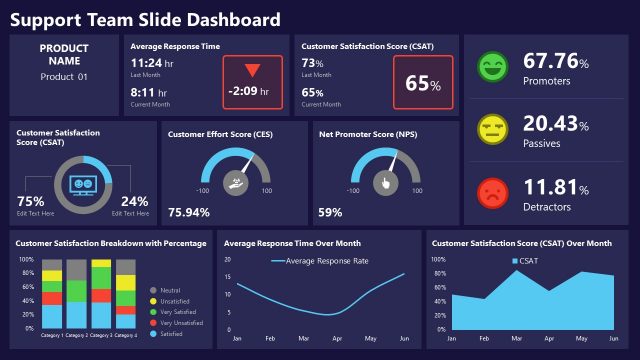
Visualizing Your Metrics System
Once you've identified your values and corresponding metrics across different life domains, creating visual representations transforms abstract concepts into tangible targets. Visual dashboards make your progress visible, creating immediate feedback loops that reinforce positive behaviors.
PageOn.ai's AI Blocks feature allows you to design custom tracking templates that represent your success metrics in visually compelling ways. These customized visualizations make complex patterns of behavior immediately apparent, helping you identify both progress and areas needing attention.
Designing Effective Progress Indicators
The most effective visual metrics systems balance detail with simplicity. Too many metrics create overwhelm, while too few provide insufficient guidance. Consider these principles when designing your visual dashboard:
- Focus on leading indicators (behaviors within your control) rather than lagging indicators (outcomes)
- Use color coding for intuitive processing (green for on-track, yellow for caution, red for attention needed)
- Incorporate visual metaphors that resonate emotionally (growing trees, rising sun, flowing river)
- Include trend lines to show progress over time rather than isolated data points
- Group related metrics visually to reveal patterns and relationships between different areas
Visual Metaphors in Success Tracking
Visual metaphors create powerful emotional connections to your metrics. For instance, you might visualize your meditation practice as a growing tree, with each session adding new leaves or branches. Your professional impact could be represented as ripples expanding across a pond, while relationship depth might appear as bridges connecting islands. These metaphors engage the brain's visual processing centers, making abstract concepts more concrete and memorable.
PageOn.ai's visualization capabilities allow you to represent the relationships between different metrics, revealing how improvements in one area often catalyze growth in others. This interconnected view prevents siloed thinking and helps you leverage the synergistic nature of personal development.
Implementing Your Personal KPI System
Translating your visualized metrics into daily life requires thoughtful systems and rituals. The goal is to create measurement practices that enhance rather than distract from living authentically.
Creating Measurement Rituals
Effective tracking rituals become meaningful practices in themselves rather than administrative burdens. Consider establishing:
Recommended Review Cadence
- Daily Micro-Reviews: 2-3 minute reflections on key metrics that require daily attention (meditation, exercise, learning)
- Weekly Check-ins: 15-20 minute reviews of progress, patterns, and adjustments needed
- Monthly Deep Dives: 45-60 minute comprehensive analysis of all metrics and their interconnections
- Quarterly Recalibrations: 2-hour sessions to assess metric relevance and adjust targets as needed
- Annual Vision Renewal: Half-day reflection on your entire system, ensuring alignment with evolving values
Measurement Ritual Integration Flow
flowchart TD
    A[Morning Intention Setting] --> B[Day Engagement with Awareness]
    B --> C[Evening Reflection & Recording]
    C --> D[Weekly Integration Review]
    D --> E[Monthly Pattern Analysis]
    E --> F[Quarterly System Adjustment]
    F --> G[Annual Vision Renewal]
    G -- Informs --> A

    style A fill:#FEF5E7,stroke:#FF8000
    style B fill:#FEF5E7,stroke:#FF8000
    style C fill:#FEF5E7,stroke:#FF8000
    style D fill:#FEF5E7,stroke:#FF8000
    style E fill:#FEF5E7,stroke:#FF8000
    style F fill:#FEF5E7,stroke:#FF8000
    style G fill:#FEF5E7,stroke:#FF8000
Balancing Quantitative and Qualitative Measures
While numbers provide clarity, not everything meaningful can be quantified. Create a balanced system that includes both quantitative metrics (e.g., meditation minutes, promises kept) and qualitative reflections (depth of connection, quality of work). PageOn.ai's flexible visualization tools accommodate both types of data, allowing you to create rich representations of your holistic progress.
For qualitative assessments, consider scalar representations (1-10 ratings) or descriptive categories that can be tracked over time. The self-performance review writing approach can be adapted for personal domain assessments, creating a structured yet nuanced framework for evaluating qualitative aspects of success.
Automation and Integration
PageOn.ai can automate data visualization from your existing tracking systems, eliminating duplicate data entry and making your metrics system more sustainable. Consider integrating:
- Meditation apps for mindfulness tracking
- Fitness wearables for physical metrics
- Calendar data for time allocation analysis
- Task management tools for productivity metrics
- Journaling platforms for qualitative reflections
PageOn.ai's Deep Search feature helps you discover research-backed measurement approaches for specific life domains, ensuring your tracking methods are both personally meaningful and scientifically sound. This combination of personalization and evidence-based practice creates a robust framework for authentic success tracking.
Success Mapping in Action: Case Studies and Applications
Real-world examples demonstrate how personalized success metrics transform lives and create sustainable fulfillment. Consider these diverse case studies:
Career Transition Case Study
"For years, I measured success by my salary and title. I had both, but felt empty. By redefining my metrics around impact, learning, and alignment with my values, I made the leap to a more meaningful career that actually pays less—but I've never been happier or felt more successful. My visualized metrics dashboard keeps me focused on what truly matters."
— Jamie P., Former Finance Executive, Now Non-Profit Leader
Navigating Metric Conflicts
Success metrics sometimes conflict, requiring thoughtful prioritization. For example, career advancement might temporarily reduce time available for relationships or health. When conflicts arise, your visualized value hierarchy helps you make conscious trade-offs rather than defaulting to societal expectations.
Effective conflict navigation involves:
- Acknowledging the tension between competing metrics
- Consulting your values hierarchy to determine priority
- Looking for creative solutions that honor multiple values
- Setting clear timeframes for temporary imbalances
- Creating compensatory practices when certain domains must receive less attention
Accountability Systems
While internal motivation drives sustainable change, external accountability adds valuable structure. Consider creating an accountability system that honors your intrinsic motivation while providing external support.
PageOn.ai generates shareable visual reports that communicate your progress with accountability partners without requiring lengthy explanations. These clean, compelling visualizations make periodic check-ins more effective and less time-consuming, focusing attention on patterns and insights rather than data collection.

Effective presentation success principles can be applied when sharing your metrics with accountability partners, ensuring your visual reports communicate your progress clearly and compellingly.
Evolving Your Success Metrics Over Time
Your success metrics should evolve as you grow and your life circumstances change. Static metrics risk becoming outdated as your values mature and your understanding of fulfillment deepens.
Signs Your Metrics Need Refinement
Watch for these indicators that your success measurement system needs updating:
Metric Evolution Triggers
flowchart TD
    A[Diminished Motivation] -->|Reassess| G[Metric Evolution]
    B[Achieving Goals Without Fulfillment] -->|Deepen| G
    C[Life Transition or Role Change] -->|Adapt| G
    D[New Knowledge or Perspective] -->|Integrate| G
    E[Metrics Feel Like Obligation] -->|Reconnect| G
    F[Values Shift or Mature] -->|Realign| G

    style A fill:#FEF5E7,stroke:#FF8000
    style B fill:#FEF5E7,stroke:#FF8000
    style C fill:#FEF5E7,stroke:#FF8000
    style D fill:#FEF5E7,stroke:#FF8000
    style E fill:#FEF5E7,stroke:#FF8000
    style F fill:#FEF5E7,stroke:#FF8000
    style G fill:#FF8000,stroke:#FF8000,color:#FFFFFF
Conducting Periodic Reviews
Schedule regular system reviews to ensure your metrics remain aligned with your evolving authentic self. During these reviews, consider:
- Which metrics energize you and which feel like obligations?
- Are your measurements capturing what truly matters, or just what's easy to track?
- Have recent experiences revealed new values or priorities?
- Are there metrics you've consistently achieved but don't feel fulfilled by?
- Do your visual representations still resonate emotionally?
Creating Visual Evolution Records
PageOn.ai helps you create visual before/after comparisons of your evolving success definitions, revealing your growth journey over time. These visual records show not just progress toward goals, but the evolution of the goals themselves – a powerful testament to your personal growth.

Maintain a living document of your success journey using PageOn.ai's dynamic visualization capabilities. This evolving record becomes a powerful reminder of your growth path and helps you spot patterns in how your definition of meaningful achievement changes over time.
From Metrics to Mastery: The Visualization Advantage
The ultimate goal of success metrics isn't just measurement but mastery – developing the mental clarity to consistently focus on what truly matters and make choices aligned with your authentic values.
The Neuroscience of Visual Processing
Visual processing engages approximately 30% of the brain's cortex, compared to just 8% for touch and 3% for hearing. This neurological advantage means that visual representations of your success metrics create stronger neural pathways and more immediate emotional connections than text-based tracking alone.
Narrative Transformation
Visual metrics help transform abstract numbers into meaningful narratives about your life. Rather than seeing isolated data points, you begin to recognize patterns and stories – the journey of your growth, challenges overcome, and progress toward what matters most.
PageOn.ai's visualization tools transform your metrics into inspiring visual reminders that keep you focused on your authentic definition of success. These visuals become touchstones throughout your day, gently redirecting your attention and energy toward your highest priorities.
The Clarity Advantage
The ultimate benefit of visualized success metrics is mental clarity – the ability to quickly distinguish between activities that move you toward meaningful fulfillment and those that merely keep you busy. This clarity reduces decision fatigue and increases confidence in your choices, even when they differ from conventional definitions of success.

With consistent use of your visual metrics system, you'll develop what might be called "success intuition" – an internalized sense of which actions and choices align with your authentic values. This intuition doesn't eliminate the need for conscious tracking but complements it, creating a powerful synergy between measurement and mastery.
Transform Your Success Visualization with PageOn.ai
Ready to create powerful visual representations of your personal success metrics? PageOn.ai gives you the tools to transform abstract concepts into clear, motivating visuals that keep you aligned with what truly matters.
Start Mapping Your Success TodayYour Journey to Visualized Success
Mapping your personal success metrics begins with deep reflection on what truly matters to you, continues with creating visual representations that inspire consistent action, and culminates in the mental clarity to stay focused on authentic fulfillment rather than external validation.
As you embark on this journey, remember that the goal isn't perfect tracking but progressively deeper alignment between how you live and what you value. Your success metrics aren't static judgments but dynamic tools that evolve as you grow.
PageOn.ai provides the visualization capabilities to transform abstract success concepts into compelling visual frameworks that inspire daily action. By leveraging the brain's preference for visual processing, you create stronger neural pathways to sustainable fulfillment.
You Might Also Like
How to Design Science Lesson Plans That Captivate Students
Create science lesson plans that captivate students with hands-on activities, clear objectives, and real-world applications to foster curiosity and critical thinking.
How to Write a Scientific Review Article Step by Step
Learn how to write a review article in science step by step. Define research questions, synthesize findings, and structure your article for clarity and impact.
How to Write a Self-Performance Review with Practical Examples
Learn how to write a self-performance review with examples and tips. Use an employee performance review work self evaluation sample essay to guide your process.
How to Write a Spec Sheet Like a Pro? [+Templates]
Learn how to create a professional spec sheet with key components, step-by-step guidance, and free templates to ensure clarity and accuracy.