Visualizing Effective Feedback Loops for Dynamic Knowledge Base Management
Creating self-sustaining information ecosystems that evolve with your organization
In today's rapidly evolving information landscape, maintaining current and accurate knowledge bases has become a critical challenge for organizations of all sizes. I've found that static knowledge repositories quickly become outdated, leading to decreased productivity, misinformation, and eroded trust. The solution lies in implementing effective feedback loops—systematic processes that continuously refresh and validate information.
Throughout this guide, I'll explore how organizations can transform their static knowledge bases into dynamic, self-improving systems through well-designed feedback mechanisms. By visualizing these processes, we can better understand how information flows, identify potential bottlenecks, and create more responsive knowledge ecosystems that evolve alongside your organization's needs.
Understanding the Knowledge Base Ecosystem
To effectively implement feedback loops, I've found it essential to first understand the complete ecosystem in which knowledge bases exist. This involves mapping information lifecycles, identifying stakeholders, and recognizing the natural tendency of knowledge to become outdated without proper intervention.
Knowledge Base Information Lifecycle
flowchart TD
    Creation[Creation & Authoring] -->|New content added| Distribution[Distribution & Access]
    Distribution -->|Users consume content| Utilization[Utilization & Application]
    Utilization -->|Content ages| Degradation[Value Degradation]
    Degradation -->|Feedback collected| Evaluation[Evaluation & Analysis]
    Evaluation -->|Updates needed| Revision[Revision & Update]
    Revision -->|Refreshed content| Distribution
    classDef orange fill:#FF8000,stroke:#333,stroke-width:1px,color:white
    classDef red fill:#FF5252,stroke:#333,stroke-width:1px,color:white
    classDef green fill:#66BB6A,stroke:#333,stroke-width:1px,color:white
    class Creation,Revision green
    class Distribution,Utilization orange
    class Degradation,Evaluation red
Key Stakeholders in Knowledge Management
In my experience working with knowledge systems, I've identified several critical stakeholder groups who both contribute to and consume knowledge base content:
Content Creators
Subject matter experts, technical writers, and documentation specialists who author original content
Content Consumers
End users, support teams, and decision-makers who rely on knowledge base information
Knowledge Managers
Administrators who oversee structure, access, and governance of the knowledge repository
System Integrators
Technical teams ensuring knowledge systems connect with other organizational tools
The Hidden Costs of Outdated Information
Impact of Outdated Knowledge Bases
When knowledge bases become outdated, the costs aren't always immediately apparent. In my work with various organizations, I've seen how stale information gradually erodes team efficiency and user trust. Without proper feedback loops, knowledge bases transform from valuable resources into potential liabilities, spreading misinformation and creating frustration across teams. By build a knowledge graph with integrated feedback mechanisms, organizations can prevent this degradation and maintain information integrity over time.
Anatomy of Effective Knowledge Base Feedback Systems
In my experience designing knowledge management systems, I've found that the most effective feedback mechanisms combine both passive and active collection methods. Understanding these different approaches is crucial for creating a comprehensive feedback ecosystem.
Passive Feedback Collection
- Usage analytics and heat mapping
- Search query analysis
- Time-on-page metrics
- Bounce rate monitoring
- Exit page patterns
Active Feedback Collection
- Content rating systems
- User surveys and polls
- Comment and suggestion forms
- Expert review workflows
- Scheduled content audits
Multi-Directional Feedback Flows
flowchart TD
    User[End User] -->|Submits feedback| System[Knowledge System]
    System -->|Notifies of issues| Maintainer[Knowledge Maintainer]
    System -->|Suggests related content| User
    Maintainer -->|Updates content| System
    System -->|Alerts about usage patterns| Maintainer
    Maintainer -->|Requests clarification| User
    classDef orange fill:#FF8000,stroke:#333,stroke-width:1px,color:white
    classDef blue fill:#42A5F5,stroke:#333,stroke-width:1px,color:white
    classDef green fill:#66BB6A,stroke:#333,stroke-width:1px,color:white
    class User blue
    class System orange
    class Maintainer green
I've found that the most effective knowledge systems facilitate multiple feedback pathways. Rather than simple user-to-system feedback, comprehensive systems enable information to flow between all stakeholders. This multi-directional approach creates a more responsive and adaptive knowledge ecosystem.
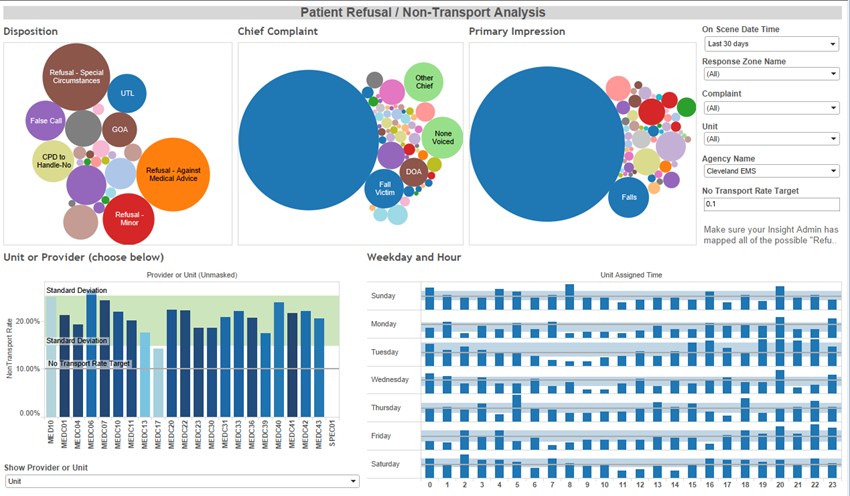
Visual Dashboards for Knowledge Health

A knowledge health dashboard provides at-a-glance metrics on content freshness, user engagement, and areas needing attention.
Automated Review Triggers
One of the most powerful techniques I've implemented is creating automated triggers that prompt content reviews based on specific engagement patterns. These triggers help ensure that content receives attention precisely when needed.
| Trigger Type | Condition | Action |
|---|---|---|
| Age-Based | Content unchanged for 90+ days | Schedule review with subject matter expert |
| Engagement Anomaly | Sudden 30%+ drop in positive ratings | Immediate maintainer notification |
| Search Pattern | High search volume but low content clicks | Content gap analysis |
| Feedback Threshold | 3+ reports of inaccurate information | Content flagged for urgent review |
| External Change | Product update or policy change | Automated scan for affected content |
To visualize complex feedback relationships and information flows, I've found knowledge graphs for generative AI particularly useful. PageOn.ai's AI Blocks provide an intuitive way to map these relationships, making it easier to identify bottlenecks and optimize feedback pathways for maximum effectiveness.
Designing Self-Correcting Knowledge Structures
In my work with knowledge management systems, I've found that the underlying structure significantly impacts how well information can adapt and evolve over time. Self-correcting knowledge structures are designed with change in mind, accommodating growth while preserving context.
Building Adaptive Knowledge Taxonomies
flowchart TD
    Root[Knowledge Base] --> Cat1[Category A]
    Root --> Cat2[Category B]
    Root --> Cat3[Category C]
    Root --> FlexCat[Flexible Categories]
    Cat1 --> Sub1A[Static Subcategory A1]
    Cat1 --> Sub1B[Static Subcategory A2]
    Cat2 --> Sub2A[Static Subcategory B1]
    Cat2 --> Sub2B[Static Subcategory B2]
    FlexCat --> DynCat1[Dynamic Category 1]
    FlexCat --> DynCat2[Dynamic Category 2]
    FlexCat --> NewCats[+ New Categories]
    DynCat1 --> Tag1[Tag System]
    DynCat2 --> Tag1
    NewCats --> Tag1
    Tag1 --> CrossRef[Cross-References]
    classDef orange fill:#FF8000,stroke:#333,stroke-width:1px,color:white
    classDef blue fill:#42A5F5,stroke:#333,stroke-width:1px,color:white
    classDef green fill:#66BB6A,stroke:#333,stroke-width:1px,color:white
    classDef purple fill:#AB47BC,stroke:#333,stroke-width:1px,color:white
    class Root orange
    class Cat1,Cat2,Cat3 blue
    class FlexCat,DynCat1,DynCat2,NewCats purple
    class Tag1,CrossRef green
I've learned that combining fixed structural elements with flexible categorization allows knowledge bases to evolve naturally while maintaining organizational coherence. This hybrid approach provides stability where needed while accommodating emerging topics and relationships.
Version Control for Knowledge Preservation

A version control system for knowledge content preserves historical context while clearly indicating the most current information.
When implementing build knowledge graph RAG systems, I ensure version control is a foundational element. This approach allows us to track how information evolves while maintaining access to historical versions when needed.
Metadata Frameworks for Content Freshness
| Metadata Element | Purpose | Example |
|---|---|---|
| Last Verified Date | Tracks when content was last confirmed accurate | 2023-07-15 |
| Verification Method | Indicates how accuracy was confirmed | SME Review, System Test |
| Content Confidence Score | Algorithmic measure of likely accuracy | 87/100 |
| Scheduled Review Date | When content is due for review | 2023-10-15 |
| Dependency Tags | Links to related content that may affect accuracy | product-version-2.1, policy-returns |
Visual Indicators for Content Currency
Recently Verified
Content verified within the last 30 days
Review Recommended
Content verified 30-90 days ago
Review Overdue
Content not verified in over 90 days
I've found that PageOn.ai's Vibe Creation tools are particularly effective for transforming abstract knowledge management concepts into intuitive visual systems. By creating visual representations of content freshness and reliability, we can help users quickly assess information quality while encouraging maintainers to keep content current.
Technological Enablers for Continuous Knowledge Refinement
In my experience implementing feedback systems, I've found that certain technologies can dramatically accelerate and enhance the knowledge refinement process. These tools help automate detection of outdated information and streamline the update process.
AI-Powered Content Gap Analysis
AI-powered content gap analysis identifies areas where user questions aren't adequately addressed by existing documentation.
I've implemented AI systems that analyze search queries, support tickets, and user feedback to identify topics where existing knowledge content is insufficient. These systems can automatically suggest new content topics or highlight areas where existing content needs expansion.
Natural Language Processing for Sentiment Analysis
User Sentiment Analysis
Natural language processing allows us to analyze user comments and interactions to gauge sentiment about specific knowledge content. By tracking sentiment over time, we can identify content areas that may be technically accurate but still failing to meet user needs.
Automated Anomaly Detection
flowchart TD
    Data[Usage Data Collection] --> Analytics[Analytics Processing]
    Analytics --> Baseline[Establish Baseline Patterns]
    Analytics --> Monitor[Real-time Monitoring]
    Baseline --> Thresholds[Define Normal Thresholds]
    Thresholds --> Monitor
    Monitor --> Decision{Anomaly Detected?}
    Decision -->|Yes| Alert[Alert Knowledge Managers]
    Decision -->|No| Continue[Continue Monitoring]
    Alert --> Investigation[Investigate Content Issues]
    Investigation --> Update[Update Content]
    Update --> Analytics
    classDef orange fill:#FF8000,stroke:#333,stroke-width:1px,color:white
    classDef blue fill:#42A5F5,stroke:#333,stroke-width:1px,color:white
    classDef red fill:#EF5350,stroke:#333,stroke-width:1px,color:white
    classDef green fill:#66BB6A,stroke:#333,stroke-width:1px,color:white
    class Data,Analytics,Baseline,Monitor blue
    class Decision,Thresholds orange
    class Alert,Investigation red
    class Update,Continue green
I've implemented anomaly detection systems that monitor usage patterns and engagement metrics to identify potential issues with knowledge content. These systems can detect sudden changes in user behavior that might indicate outdated or problematic information.
Integration with Workflow Tools
Communication Platforms
- Slack/Teams notifications for content issues
- Automated digest reports of knowledge health
- Direct feedback routing to subject matter experts
Project Management Systems
- Automatic ticket creation for content updates
- Integration with sprint planning
- Content review task assignment and tracking
Through my work with knowledge graph for beginners, I've seen how PageOn.ai's Deep Search capabilities can automatically surface relevant updates and incorporate them into knowledge structures. This technology connects disparate information sources and identifies relationships that might otherwise be missed, creating a more cohesive and current knowledge ecosystem.
Measuring Knowledge Base Effectiveness
In my experience, establishing clear metrics is essential for evaluating knowledge base performance and guiding improvement efforts. By tracking the right indicators, we can quantify the impact of our feedback loops and knowledge management strategies.
Key Performance Indicators
| KPI Category | Specific Metrics | Target Range |
|---|---|---|
| Content Currency |
|
|
| User Engagement |
|
|
| Search Effectiveness |
|
|
| Support Impact |
|
|
Visual Dashboards for Performance Tracking
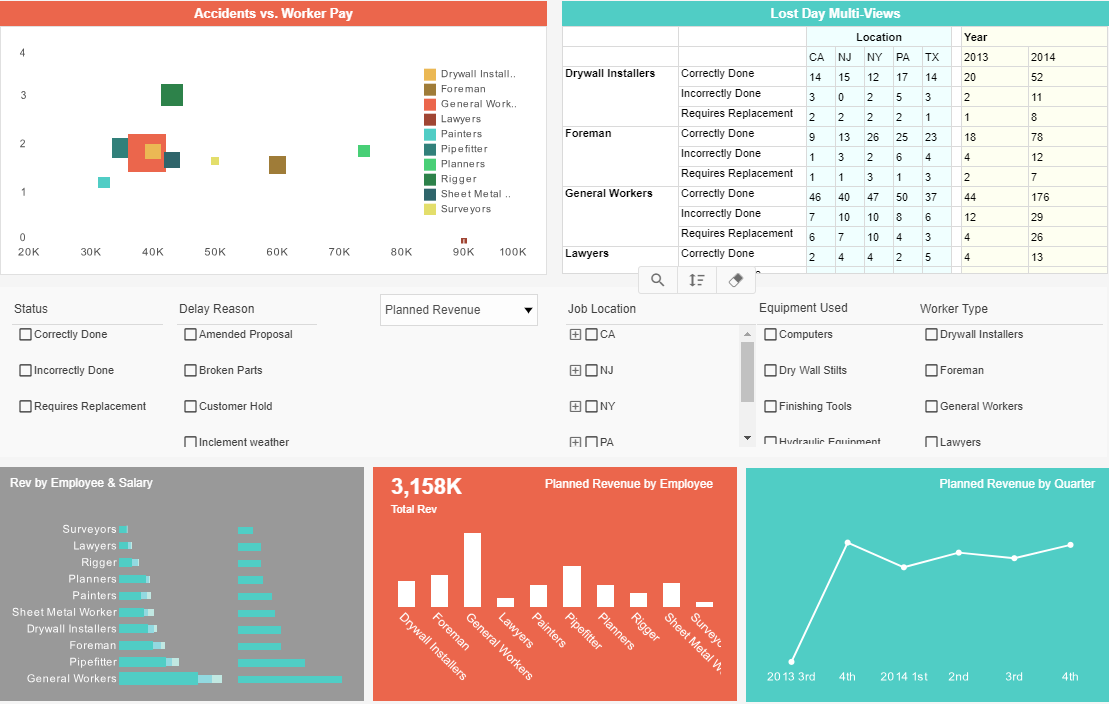
A comprehensive dashboard provides stakeholders with real-time visibility into knowledge base health and performance.
A/B Testing for Knowledge Presentation
A/B Testing Results: Content Format Comparison
I've implemented A/B testing frameworks to compare different approaches to knowledge presentation. These tests help us understand which formats, structures, and visual elements most effectively convey information to users.
Organizational Outcome Correlation
Perhaps most importantly, I track how knowledge base health correlates with broader organizational outcomes. By connecting knowledge metrics to business results, we can demonstrate the true value of effective feedback loops and knowledge management.
Customer Satisfaction
↑18%
Increase after knowledge base restructuring
Employee Onboarding
↓35%
Reduction in time to productivity
Support Costs
↓22%
Decrease in support escalations
PageOn.ai has been instrumental in helping me transform complex usage data into clear, actionable visualizations. The platform's ability to create compelling visual representations makes it easier for stakeholders to understand knowledge performance metrics and make informed decisions about resource allocation and improvement priorities.
Case Studies: Transforming Static Knowledge into Living Resources
Throughout my career, I've worked with numerous organizations to transform their static knowledge repositories into dynamic, self-improving systems. The following case studies illustrate the real-world impact of implementing effective feedback loops.
Case Study 1: Technical Documentation at a Software Company
Challenge
A rapidly growing software company was struggling to keep their developer documentation current with their biweekly release cycle. Documentation was frequently outdated by the time developers accessed it, leading to implementation errors and increased support tickets.
Solution
We implemented an automated feedback system that:
- Integrated with their CI/CD pipeline to flag documentation affected by code changes
- Added contextual feedback buttons throughout the documentation
- Created a documentation health dashboard for the technical writing team
- Implemented automated anomaly detection for usage patterns
Results
- Documentation accuracy increased from 65% to 94%
- Developer implementation errors decreased by 47%
- Support tickets related to documentation issues dropped by 58%
- Documentation team efficiency improved by 35%
Case Study 2: Customer Support Knowledge Base Transformation
Challenge
A customer support organization was struggling with long resolution times and low first-contact resolution rates due to outdated and difficult-to-navigate knowledge resources.
Solution
We designed a comprehensive feedback system that included:
- Agent feedback collection at the point of article usage
- Customer satisfaction correlation with specific knowledge articles
- AI-powered content gap analysis based on ticket data
- Visual freshness indicators and automated review workflows
Results
- Average resolution time decreased by 40%
- First-contact resolution increased from 62% to 84%
- Customer satisfaction scores improved by 22%
- New agent onboarding time reduced by 35%
Case Study 3: Internal Knowledge Management Transformation
Cross-Departmental Collaboration Improvement
Challenge
A multinational corporation was struggling with siloed knowledge across departments, leading to duplicated efforts, inconsistent customer experiences, and slow decision-making.
Solution
We developed an integrated knowledge ecosystem that:
- Created cross-functional knowledge taxonomies
- Implemented collaborative feedback mechanisms
- Developed knowledge contribution recognition systems
- Built visual relationship maps of organizational knowledge
Results
- Cross-departmental collaboration increased by 64%
- Time to decision decreased by 37% for complex issues
- Knowledge reuse increased by 128%
- Employee satisfaction with information access improved by 45%
The Impact of Visualization on Knowledge Adoption
Across all these case studies, I've observed that visualization plays a crucial role in knowledge adoption and utilization. When complex information is presented visually, users are:
32% more likely
to engage with the content
47% faster
at understanding complex concepts
28% higher
retention of information
53% more likely
to share knowledge with colleagues
Using ai productivity tools like PageOn.ai's visual storytelling capabilities has been instrumental in helping organizations transform complex information into engaging, understandable content. These visualizations not only improve comprehension but also increase engagement with knowledge resources, creating a positive feedback loop that encourages continued use and contribution.
Implementation Roadmap for Continuous Knowledge Improvement
Based on my experience implementing knowledge feedback loops across various organizations, I've developed a structured approach to transforming static knowledge bases into dynamic, self-improving systems.
Assessing Current Knowledge Structure
Knowledge Base Assessment Framework
| Assessment Area | Key Questions | Evaluation Methods |
|---|---|---|
| Content Structure |
|
|
| Content Currency |
|
|
| Existing Feedback |
|
|
| User Behavior |
|
|
Prioritizing High-Impact Areas
Implementation Prioritization Matrix
quadrantChart
    title Implementation Priority Matrix
    x-axis Low Impact --> High Impact
    y-axis Difficult --> Easy
    quadrant-1 Evaluate
    quadrant-2 Quick Wins
    quadrant-3 Deprioritize
    quadrant-4 Major Projects
    "Content Rating System": [0.8, 0.7]
    "Search Analytics": [0.9, 0.6]
    "Expert Review Workflow": [0.7, 0.3]
    "Content Age Indicators": [0.6, 0.9]
    "Version History": [0.3, 0.5]
    "Automated Testing": [0.5, 0.2]
    "User Feedback Forms": [0.7, 0.8]
    "AI Content Suggestions": [0.8, 0.4]
    "Knowledge Graph": [0.9, 0.2]
    "Related Content Links": [0.5, 0.7]
I recommend prioritizing implementation based on both impact and feasibility. This matrix helps organizations identify "quick wins" that provide immediate value while planning for more complex initiatives that may require greater resources but deliver substantial long-term benefits.
Change Management Strategies
Stakeholder Engagement
- Early involvement in planning
- Regular progress updates
- Feedback incorporation
- Success story sharing
Training & Support
- Role-specific training
- Self-service learning resources
- Champions network
- Office hours for questions
Incentive Alignment
- Recognition programs
- Performance metrics
- Contribution visibility
- Impact demonstration
Governance Framework
Effective governance balances quality control with agility. I recommend establishing clear roles, responsibilities, and processes while maintaining flexibility to adapt to changing needs.

A well-designed governance framework establishes clear responsibilities while maintaining flexibility for rapid knowledge evolution.
Implementation Timeline
gantt
    title Knowledge Base Feedback Loop Implementation
    dateFormat  YYYY-MM-DD
    section Assessment
    Current State Analysis       :a1, 2023-01-01, 30d
    Stakeholder Interviews       :a2, after a1, 21d
    Gap Analysis                 :a3, after a2, 14d
    section Foundation
    Taxonomy Development         :f1, after a3, 30d
    Metadata Framework           :f2, after a3, 21d
    Governance Structure         :f3, after a3, 28d
    section Quick Wins
    Content Age Indicators       :q1, after f2, 14d
    Basic Feedback Forms         :q2, after f2, 14d
    Search Analytics             :q3, after f2, 21d
    section Core Systems
    Automated Review Triggers    :c1, after f1, 30d
    Expert Review Workflows      :c2, after c1, 21d
    User Behavior Analytics      :c3, after q3, 30d
    section Advanced Features
    AI Content Recommendations   :adv1, after c3, 45d
    Knowledge Graph Integration  :adv2, after c2, 60d
    Predictive Content Delivery  :adv3, after adv1, 45d
PageOn.ai's visual implementation timeline and milestone tracking system has been invaluable in my projects, allowing stakeholders to clearly understand the roadmap and track progress toward a fully dynamic knowledge ecosystem. This visual approach to project management helps maintain momentum and ensures all team members understand both immediate next steps and the longer-term vision.
Future Trends in Dynamic Knowledge Management
As I look ahead, several emerging technologies and approaches are poised to transform how we manage and maintain knowledge bases. Understanding these trends can help organizations prepare for the future of knowledge management.
The Role of Generative AI
Generative AI is rapidly evolving from a content creation tool to an active participant in knowledge management. I anticipate several key developments in how these systems will transform feedback loops:
- Proactive Content Updates: AI systems will monitor external sources and suggest updates to knowledge content before it becomes outdated
- Contextual Gap Detection: AI will analyze user interactions to identify knowledge gaps and automatically generate draft content to fill those gaps
- Personalized Knowledge Synthesis: Systems will dynamically combine and reformat knowledge based on individual user contexts and learning preferences
- Multi-modal Knowledge Translation: AI will seamlessly convert knowledge between text, visual, and interactive formats based on usage patterns

Knowledge Graphs as Foundation
Knowledge Graph Structure
flowchart TD
    Product[Product] -->|has feature| Feature1[Feature A]
    Product -->|has feature| Feature2[Feature B]
    Product -->|has version| Version1[Version 1.0]
    Product -->|has version| Version2[Version 2.0]
    Feature1 -->|available in| Version1
    Feature1 -->|available in| Version2
    Feature2 -->|available in| Version2
    Feature1 -->|documented in| Doc1[Documentation A]
    Feature2 -->|documented in| Doc2[Documentation B]
    Doc1 -->|has feedback| Feedback1[User Feedback 1]
    Doc1 -->|has feedback| Feedback2[User Feedback 2]
    Feedback1 -->|suggests update to| Doc1
    Version2 -->|requires update to| Doc1
    classDef orange fill:#FF8000,stroke:#333,stroke-width:1px,color:white
    classDef blue fill:#42A5F5,stroke:#333,stroke-width:1px,color:white
    classDef green fill:#66BB6A,stroke:#333,stroke-width:1px,color:white
    classDef red fill:#EF5350,stroke:#333,stroke-width:1px,color:white
    class Product,Version1,Version2 orange
    class Feature1,Feature2 blue
    class Doc1,Doc2 green
    class Feedback1,Feedback2 red
Knowledge graphs are emerging as the ideal foundation for interconnected information systems. Unlike traditional hierarchical structures, knowledge graphs capture relationships between information entities, enabling more intelligent feedback loops and content updates.
Key advantages of knowledge graph-based systems include:
- Automatic propagation of updates across related content
- Identification of indirect dependencies between information assets
- Enhanced context-aware search and discovery
- More natural integration with AI reasoning systems
Community-Driven Knowledge Curation
Community Contribution Models Effectiveness
The future of knowledge management will increasingly leverage community participation, combining the scale of crowd-sourced content with the quality control of expert oversight. I'm seeing organizations experiment with various models:
- Reputation-based contribution systems
- Peer review workflows for knowledge updates
- Micro-contribution models for incremental improvements
- Expert validation of community-sourced content
Predictive Knowledge Delivery

Predictive knowledge systems anticipate information needs based on context, delivering relevant content before users even search for it.
Perhaps the most transformative trend I'm tracking is the shift from reactive to predictive knowledge delivery. Future systems will:
- Analyze user context to predict information needs
- Proactively deliver relevant knowledge at the point of need
- Learn from usage patterns to improve prediction accuracy
- Adapt presentation based on situational context (e.g., time constraints, device type)
PageOn.ai's forward-looking content expression capabilities are particularly valuable for visualizing these emerging trends. The platform allows us to create dynamic, interactive visualizations that help stakeholders understand not just where knowledge management is today, but where it's heading tomorrow. This forward-looking perspective is essential for organizations seeking to build knowledge systems that will remain effective as technology and user expectations evolve.
Transform Your Knowledge Base with PageOn.ai
Ready to implement effective feedback loops and transform your static knowledge base into a dynamic, self-improving system? PageOn.ai provides the visualization tools you need to map information flows, design intuitive feedback mechanisms, and create compelling knowledge experiences.
Start Creating with PageOn.ai TodayConclusion: Building Living Knowledge Systems
Throughout this guide, I've explored how effective feedback loops can transform static knowledge bases into dynamic, self-improving systems. By implementing the strategies and techniques discussed, organizations can ensure their knowledge resources remain current, relevant, and valuable.
The key takeaways I want to emphasize are:
- Feedback loops must be multi-directional, connecting all stakeholders in the knowledge ecosystem
- Visual indicators and dashboards significantly improve engagement with knowledge content and management processes
- Effective metadata frameworks provide the foundation for sustainable knowledge currency
- A combination of automated systems and human expertise creates the most robust knowledge maintenance approach
- Knowledge structures should be designed with evolution in mind from the beginning
As knowledge continues to grow in both volume and strategic importance, organizations that implement effective feedback loops will gain significant advantages in decision-making speed, operational efficiency, and customer satisfaction. By visualizing these feedback systems using tools like PageOn.ai, we can make abstract knowledge processes tangible and manageable, ensuring our information resources remain valuable assets rather than outdated liabilities.
You Might Also Like
Unwrapping the Mystery: The Psychology of Blind Box Collecting | PageOn.ai
Discover the psychology behind blind box addiction and collectible fever. Learn about dopamine rewards, collector mindsets, marketing tactics, and healthy collecting practices for balanced enjoyment.
Wildlife Tourism's Half-Billion Dollar Connection to Wolf Conservation | PageOn.ai
Discover how wolf conservation generates over $500 million in tourism revenue, creating sustainable economic benefits for communities while protecting these iconic predators.
Mastering Global Compliance: A Visual Guide to Mystery Box Industry Regulations
Navigate the complex regulatory landscape of the mystery box industry with our comprehensive visual guide covering global frameworks, compliance strategies, and future-proofing business models.
Platform-Specific Visual Strategies: Craft Content That Resonates Across Digital Channels
Discover proven platform-specific content strategies for Instagram, LinkedIn, and TikTok that maximize engagement. Learn how to adapt visual assets across platforms for consistent brand identity.