Visualizing Growth Strategies: A Guide to Hacking Growth Principles
Transform abstract growth concepts into clear, actionable visual models
Explore how to leverage PageOn.ai's visualization capabilities to bring the revolutionary growth hacking methodology from Sean Ellis & Morgan Brown's bestselling book to life through compelling visual models, interactive dashboards, and data-driven storytelling.
Understanding the Hacking Growth Framework
The revolutionary methodology introduced by Sean Ellis and Morgan Brown in "Hacking Growth" has transformed how businesses approach growth. With over 700,000 copies sold globally, this framework has become essential for companies seeking sustainable expansion in the digital age.
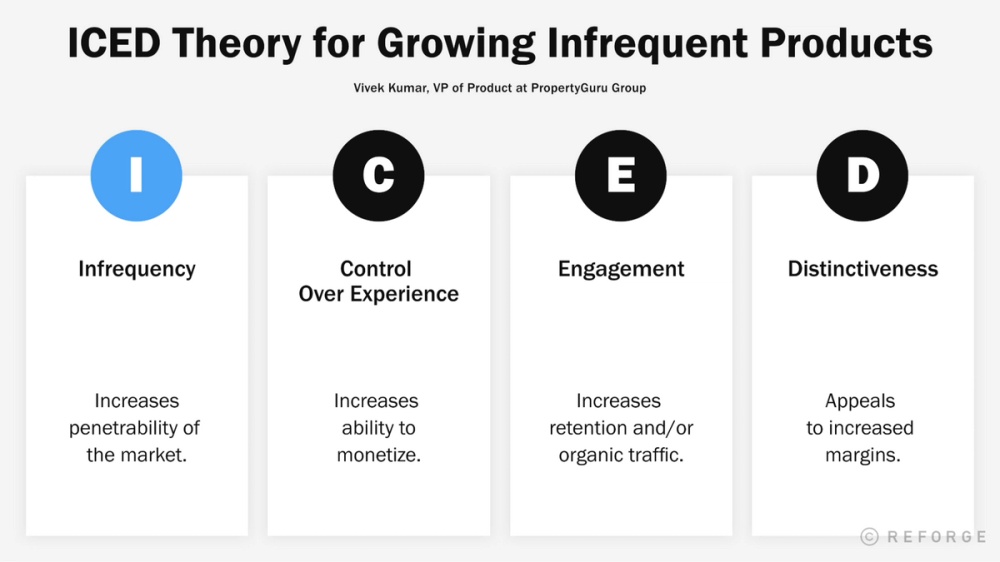
The four pillars of growth hacking as presented in Sean Ellis & Morgan Brown's methodology
Core Philosophy & Key Pillars
At its essence, growth hacking rejects traditional marketing's big-budget, low-measurement approach in favor of data-driven, iterative experimentation. The framework stands on four key pillars:
                    flowchart LR
                        GH[Growth Hacking]
                        A[Acquisition]
                        R[Retention]
                        E[Engagement]
                        RF[Referral]

                        GH --> A
                        GH --> R
                        GH --> E
                        GH --> RF

                        style GH fill:#FF8000,color:white
                        style A fill:#42A5F5,color:white
                        style R fill:#66BB6A,color:white
                        style E fill:#FFA726,color:white
                        style RF fill:#EC407A,color:white
- Acquisition: Attracting new users through channels that are testable, trackable, and scalable.
- Retention: Keeping users engaged and active within your product ecosystem.
- Engagement: Deepening user interaction with your product's core features and value.
- Referral: Motivating existing users to bring new ones into your product.
Growth Hacking vs. Traditional Marketing
| Aspect | Traditional Marketing | Growth Hacking |
|---|---|---|
| Budget Approach | Large upfront investments | Small, incremental tests |
| Measurement | Post-campaign analysis | Continuous data collection |
| Team Structure | Siloed departments | Cross-functional collaboration |
| Iteration Speed | Quarterly/annual cycles | Weekly/daily experiments |
| Success Metrics | Brand awareness, reach | Growth rate, retention, revenue |
Visualizing Abstract Growth Concepts
One of the challenges in implementing growth hacking is translating abstract concepts into actionable strategies. PageOn.ai's AI Blocks functionality transforms these concepts into clear visual models that teams can easily understand and execute.

By using PageOn.ai's visualization capabilities, teams can:
- Transform abstract growth concepts into tangible visual models
- Create collaborative dashboards that align cross-functional teams
- Design experiment frameworks that clearly communicate hypotheses
- Build data visualization hierarchies that highlight critical KPIs
With over 700,000 copies of "Hacking Growth" sold globally, the methodology's impact is undeniable. Companies like Dropbox, Airbnb, and Instagram have leveraged these principles to achieve extraordinary growth with minimal traditional marketing spend, demonstrating the effectiveness of this approach. PageOn.ai helps teams visualize and implement these same principles in their own growth strategies.
Building Your Growth Engine Visualization
Converting the theoretical growth hacking framework into a functional system requires clear visualization. PageOn.ai provides the tools to build comprehensive visual representations of your growth engine, making abstract concepts tangible for your entire organization.
Creating Your Custom Growth Dashboard
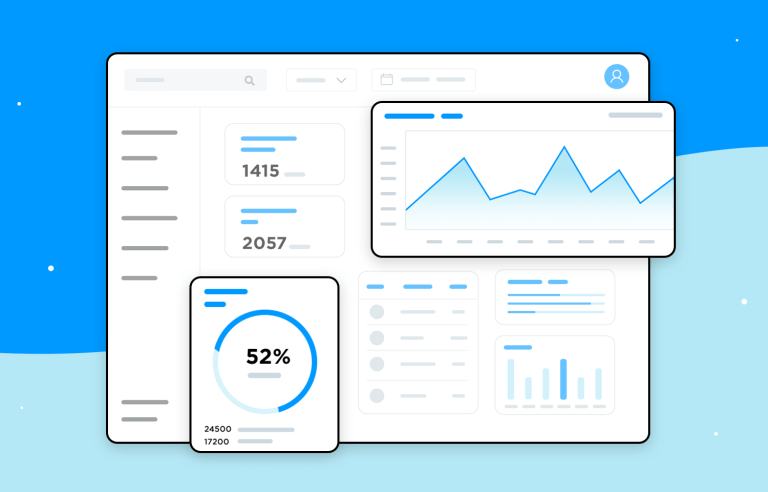
A well-designed growth dashboard serves as the command center for your growth initiatives. Using PageOn.ai's visual building blocks, you can create dashboards that:
- Centralize key performance indicators in a visually intuitive layout
- Provide real-time visibility into growth experiments and their results
- Enable quick identification of trends, opportunities, and bottlenecks
- Facilitate data-informed decision making across teams
Visualizing Your North Star Metric
The North Star Metric is a central concept in growth hacking – a single metric that best captures your product's core value. Using AI-powered growth charts, you can create compelling visualizations that keep your North Star front and center.
Example: North Star Metric Visualization
Monthly Active Users (MAU) growing over time with key growth initiatives highlighted
Your North Star Metric visualization should:
- Be prominently displayed and immediately understandable
- Show historical trends and progress toward goals
- Highlight key growth initiatives and their impact
- Align with your company's core value proposition
Designing Experiment Frameworks
Growth hacking thrives on continuous experimentation. PageOn.ai helps you create visual experiment frameworks that tell the story of your growth hypotheses and results.
                    flowchart TD
                        A[Identify Growth Opportunity] --> B[Form Hypothesis]
                        B --> C[Design Experiment]
                        C --> D[Set Success Metrics]
                        D --> E[Implement Test]
                        E --> F[Analyze Results]
                        F --> G{Success?}
                        G -->|Yes| H[Scale Implementation]
                        G -->|No| I[Document Learnings]
                        I --> A
                        H --> A

                        style A fill:#FF8000,color:white
                        style G fill:#66BB6A,color:white
Effective experiment frameworks visualized through PageOn.ai allow teams to:
- Document hypotheses in a structured, visual format
- Track the status and results of multiple experiments simultaneously
- Share learnings across the organization
- Build on previous experiments for continuous improvement
Mapping Interdepartmental Collaboration
Growth hacking requires breaking down silos between departments. PageOn.ai helps visualize how different teams can collaborate toward common growth goals.

By leveraging PageOn.ai's Deep Search functionality, you can integrate real-world examples from companies like Dropbox, Instagram, and Airbnb to inform your own growth models and visualization strategies. This helps teams understand not just theoretical approaches but proven methods that have driven exceptional growth for industry leaders.
Data-Driven Decision Making Visualized
At the heart of growth hacking lies data-driven decision making. The challenge is transforming complex data into accessible insights that drive action. PageOn.ai's visualization tools bridge this gap, converting raw analytics into compelling visual narratives.
Creating Dynamic Funnel Visualizations
Conversion funnels are critical for identifying where users drop off in your product journey. PageOn.ai helps create clear, dynamic funnel visualizations that reveal conversion bottlenecks.
Conversion Funnel Analysis
Visualizing user drop-off points in the customer journey
Effective funnel visualizations allow growth teams to:
- Identify specific stages where users drop off
- Prioritize optimization efforts on the most critical conversion points
- Track improvements over time as experiments are implemented
- Compare conversion rates across different user segments or channels
Designing Cohort Analysis Dashboards
Cohort analysis reveals how user behavior changes over time. PageOn.ai helps create dashboards that illuminate these patterns in clear, visual terms.

With PageOn.ai's visualization tools, you can create cohort analysis dashboards that:
- Track retention rates across different user cohorts
- Compare the impact of product changes on user behavior over time
- Identify which acquisition channels produce the most loyal users
- Recognize patterns in user behavior that might otherwise remain hidden
From Raw Data to Visual Insight
Growth hackers often work with complex data from various sources, including Google Analytics, Excel, SQL, and Python outputs. PageOn.ai helps transform this raw data into compelling visualizations that non-technical stakeholders can understand and act upon.
                    flowchart LR
                        A1[Google Analytics] --> B[Data Collection]
                        A2[SQL Queries] --> B
                        A3[Excel/Spreadsheets] --> B
                        A4[Python Analysis] --> B
                        B --> C[Data Processing]
                        C --> D[Visualization Creation]
                        D --> E1[Executive Dashboards]
                        D --> E2[Team Reports]
                        D --> E3[Public Metrics]

                        style B fill:#FF8000,color:white
                        style D fill:#FF8000,color:white
PageOn.ai streamlines this process by:
- Providing templates for common data visualization needs
- Offering AI-driven recommendations for the most effective visualization types
- Creating visual hierarchies that highlight critical KPIs while providing context
- Designing automated reporting templates that update with fresh growth data
By using AI-powered growth charts, teams can also identify emerging trends and opportunities that might not be immediately obvious in raw data. This enables proactive decision-making rather than reactive responses to changing market conditions.

The most effective growth teams create data visualization strategies that:
- Make insights accessible to stakeholders at all technical levels
- Focus attention on the metrics that truly drive business growth
- Update automatically to ensure decisions are made with current information
- Tell a coherent story about user behavior and business performance
Growth Experiment Design Studio
Systematic experimentation is the engine that drives growth hacking success. PageOn.ai provides a visual design studio approach to create, document, and analyze growth experiments in a structured, collaborative way.
Visualizing the Build-Measure-Learn Cycle
The build-measure-learn cycle is central to growth hacking. PageOn.ai helps visualize this iterative process to keep teams aligned and focused.
                    flowchart TB
                        A[Build] -->|Implement Experiment| B[Measure]
                        B -->|Collect & Analyze Data| C[Learn]
                        C -->|Apply Insights| A

                        style A fill:#FF8000,color:white
                        style B fill:#66BB6A,color:white
                        style C fill:#42A5F5,color:white
This cycle visualization helps teams:
- Maintain momentum through rapid iteration
- Document the progression from idea to implementation to insight
- Ensure learning from each experiment informs the next
- Keep the focus on continuous improvement rather than one-off efforts
Creating Visual A/B Testing Documentation
A/B testing is a fundamental growth hacking technique. PageOn.ai helps create visual documentation that communicates complex test variants simply and clearly.
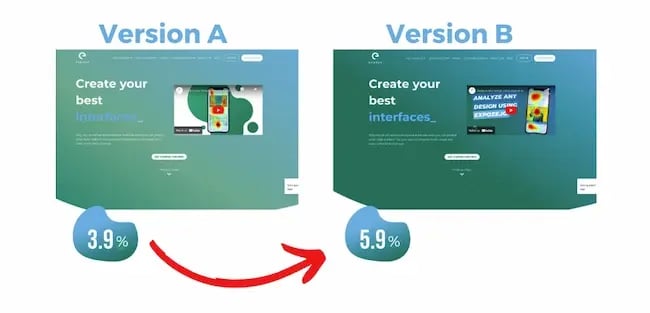
Visual A/B test documentation provides several benefits:
- Clear communication of what's being tested and why
- Easy comparison of variants for stakeholder review
- Visual representation of results for faster decision-making
- Historical record of experiments for institutional knowledge
Designing Growth Opportunity Matrices
With limited resources, prioritizing growth experiments is crucial. PageOn.ai helps design visual matrices to identify high-impact opportunities.
Growth Opportunity Matrix
Visualizing potential growth experiments by impact and effort
Growth opportunity matrices help teams:
- Visualize the potential impact versus effort for various initiatives
- Prioritize "quick wins" (high impact, low effort)
- Plan resources for longer-term, higher-effort projects
- Communicate strategic priorities to stakeholders
Conversational Approach to Hypothesis Design
PageOn.ai uses a unique conversational approach to help teams articulate and visualize testing hypotheses. This makes it easier to transform intuition and ideas into structured experiments.
Example Hypothesis Template
We believe that [making this change]
For [these users]
Will result in [this outcome]
We'll measure this using [these metrics]
PageOn.ai guides teams through this structure with prompts and suggestions, then creates visual documentation of the hypothesis.
PageOn.ai also provides templates for visualizing experiment results across different channels and touchpoints, allowing teams to:
- Compare performance across multiple experiments
- Identify which channels respond best to which types of experiments
- Track the cumulative impact of multiple experiments over time
- Share learnings with stakeholders in an accessible visual format
By using these visualization tools, growth teams can create a culture of experimentation that is systematic, transparent, and focused on continuous improvement. This approach has been central to the success stories documented in "Hacking Growth" and can be customized to fit any organization's specific goals and constraints.
Case Studies: Growth Hacking Visualized
The most powerful way to understand growth hacking principles is to see them in action. Using PageOn.ai, we can create visual breakdowns of famous growth hacking success stories mentioned in "Hacking Growth" and apply these lessons to your own strategies.
Dropbox's Referral Program

Dropbox's famous referral program incentivized users with extra storage space for inviting friends, creating a viral growth loop that drove explosive user acquisition with minimal marketing spend.
                    flowchart LR
                        A[User Signs Up] --> B[User Invites Friends]
                        B --> C[Friends Join]
                        C --> D[Both Get Storage Bonus]
                        D --> E[Increased Product Value]
                        E --> B

                        style B fill:#FF8000,color:white
                        style E fill:#42A5F5,color:white
Key elements of Dropbox's growth strategy:
- Double-sided incentive structure (both inviter and invitee benefit)
- Reward directly enhances the core product value (more storage)
- Simple, clear messaging and user experience
- Viral coefficient greater than 1 (each user brings in more than one new user on average)
Instagram's Strategic Pivot
Instagram began as Burbn, a complex check-in app with multiple features. Using growth hacking principles, the founders analyzed user data, identified the most compelling feature (photo sharing), and ruthlessly simplified the product.

This strategic pivot exemplifies key growth principles:
- Using data to identify what users actually value
- Focusing on one core feature that delivers exceptional value
- Optimizing the onboarding flow for that specific experience
- Creating network effects through social sharing
Airbnb's Cross-Platform Approach
Airbnb used creative growth tactics like their famous Craigslist integration to leverage existing platforms and build initial traction.
Airbnb's Multi-Channel Growth Strategy
Visualization of user acquisition sources over time
Key elements of Airbnb's growth approach:
- Identifying and integrating with platforms where their target users already existed
- Systematically testing and improving listing quality (professional photography)
- Creating referral incentives to encourage hosts and guests to spread the word
- Balancing demand and supply sides of their marketplace
Minimal Traditional Marketing
What's striking about these success stories is that companies like Dropbox, Instagram, and Airbnb achieved explosive growth with minimal traditional marketing spend. Instead, they focused on:
Product-Led Growth
Making the product itself the primary driver of user acquisition through sharing and network effects.
Data-Informed Decisions
Using metrics to identify what works and doubling down on successful approaches.
Iterative Experimentation
Constantly testing new growth ideas, learning, and improving based on results.
Using PageOn.ai, you can create your own case study visualizations based on these principles, customized to your business model and growth goals. This helps teams understand not just what these companies did but how similar approaches might apply to their unique situations.

By visualizing these case studies, teams can:
- Extract actionable principles from successful growth stories
- Identify which strategies might be most relevant to their context
- Create hypotheses for their own growth experiments
- Build a shared understanding of growth principles across the organization
Implementing the Four Layers of Growth Hacking
At the 2017 GrowthHackers Conference, Sean Ellis outlined the four essential layers of growth hacking. PageOn.ai helps visualize this framework to ensure comprehensive implementation across your organization.

                    flowchart TB
                        A[1. User & Product Thinking] --> B[2. Data-Driven Approach]
                        B --> C[3. Core Business Growth Focus]
                        C --> D[4. Multi-Skilled Team Development]

                        style A fill:#FF8000,color:white
                        style B fill:#42A5F5,color:white
                        style C fill:#66BB6A,color:white
                        style D fill:#EC407A,color:white
User-Centric vs. Product-Centric Thinking
The first layer balances user needs with product capabilities. PageOn.ai helps create balanced scorecards that visualize this critical perspective.
User-Product Balance Scorecard
Assessing alignment between user needs and product capabilities
This balanced scorecard approach helps teams:
- Identify gaps between product capabilities and user expectations
- Prioritize product improvements that align with user needs
- Track progress in closing experience gaps over time
- Maintain focus on both product excellence and user satisfaction
Data Communication Dashboards
The second layer focuses on "speaking with data." PageOn.ai helps design dashboards that communicate data insights clearly across the organization.

Effective data communication dashboards:
- Present complex data in visually intuitive formats
- Highlight trends and patterns that might otherwise be missed
- Connect metrics to business outcomes
- Enable data-informed decisions at all levels of the organization
Core Business Growth Drivers
The third layer emphasizes focusing on what truly drives core business growth. PageOn.ai helps create visual priority matrices to identify and focus on these key drivers.
Growth Driver Prioritization Matrix
Mapping growth initiatives by business impact and implementation complexity
This prioritization approach helps teams:
- Focus resources on high-impact, manageable initiatives
- Avoid being distracted by low-impact "busywork"
- Visualize the trade-offs between impact and complexity
- Build consensus around strategic priorities
Multi-Skilled Team Development
The fourth layer focuses on developing team members with diverse skills. PageOn.ai helps visualize skill development paths for growth team members.
Effective growth teams develop skills across several domains:
- Data analysis using tools like Google Analytics, Excel, SQL, and Python
- Digital marketing across websites and social media platforms
- Basic programming with HTML, CSS, and other languages
- UI/UX design principles and practices
PageOn.ai's visualization tools help growth leaders assess team capabilities and identify skill gaps that need to be addressed, either through training or strategic hiring.
From Strategy to Execution: Visual Implementation Plans
Even the best growth strategies fail without effective execution. PageOn.ai helps translate growth strategies into visually mapped execution plans that align teams and drive results.
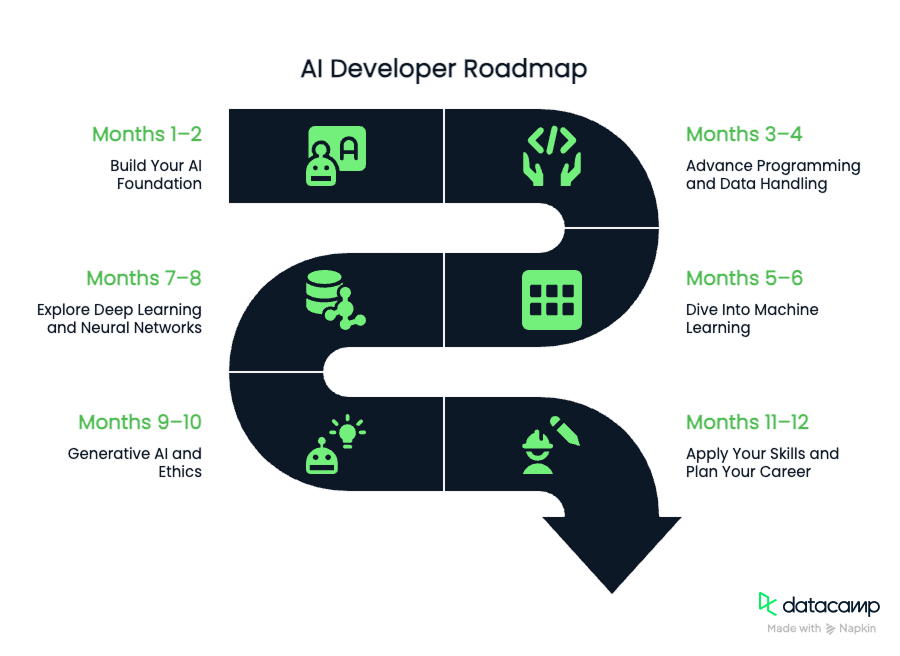
Creating Visual Timelines
Visual timelines help teams understand the sequence and dependencies of growth initiatives, keeping everyone aligned on priorities and deadlines.
                    gantt
                        title Growth Initiative Timeline
                        dateFormat  YYYY-MM-DD

                        section Acquisition
                        SEO Optimization     :a1, 2023-07-01, 30d
                        New Landing Pages    :a2, after a1, 21d
                        Content Campaign     :a3, after a2, 45d

                        section Activation
                        Onboarding Redesign  :b1, 2023-07-15, 45d
                        Feature Tutorials    :b2, after b1, 30d

                        section Retention
                        Email Sequence       :c1, 2023-08-01, 30d
                        Loyalty Program      :c2, after c1, 60d

                        section Referral
                        Incentive Design     :d1, 2023-09-01, 21d
                        Program Launch       :d2, after d1, 14d
                        Optimization         :d3, after d2, 60d
Visual timelines provide several benefits:
- Clear visualization of project dependencies and critical paths
- Alignment of cross-functional team efforts
- Early identification of potential bottlenecks or conflicts
- Transparent communication of priorities and progress
Designing Review Processes
Regular review processes are essential for highlighting successes and learning opportunities. PageOn.ai helps design visual review frameworks that keep teams accountable and focused on continuous improvement.
Effective review processes include:
- Regular cadence (weekly, bi-weekly, or monthly)
- Clear metrics and goals for each initiative
- Documentation of learnings, both successes and failures
- Action items for the next iteration
Visual Stakeholder Communication
Communicating growth plans to stakeholders is crucial for securing buy-in and resources. PageOn.ai generates visual presentations that make complex growth strategies easy to understand and support.
When creating these presentations, teams can leverage tools like Tome AI to enhance their visual storytelling capabilities, making complex growth concepts accessible to all stakeholders.

Effective stakeholder communications:
- Focus on results and business impact
- Present data in clear, visually appealing formats
- Connect growth initiatives to strategic business goals
- Include both wins and learnings from setbacks
Templates for Growth Team Meetings
Effective meetings are essential for growth team collaboration. PageOn.ai provides templates for different types of growth team meetings, ensuring productive sessions that drive progress.
                    flowchart TB
                        A[Weekly Growth Stand-up] --> B[Bi-weekly Experiment Review]
                        B --> C[Monthly Metrics Deep Dive]
                        C --> D[Quarterly Strategy Session]

                        style A fill:#FF8000,color:white
                        style B fill:#42A5F5,color:white
                        style C fill:#66BB6A,color:white
                        style D fill:#EC407A,color:white
Each meeting type serves a specific purpose:
- Weekly Stand-up: Quick updates on current experiments and blockers
- Bi-weekly Experiment Review: Detailed analysis of recent experiment results
- Monthly Metrics Deep Dive: Comprehensive review of key growth metrics
- Quarterly Strategy Session: Reflection on progress and planning for the next quarter
PageOn.ai helps create visual templates for each meeting type, ensuring consistency and focus.
By implementing these visual execution plans, teams can bridge the gap between strategy and results, ensuring that growth hacking principles are effectively applied in practice. This systematic approach has been instrumental in the success stories documented in "Hacking Growth" and can be customized to any organization's specific context and goals.
Avoiding Vanity Metrics Through Visual Clarity
One of the most important lessons from "Hacking Growth" is the danger of vanity metrics — numbers that look impressive but don't actually reflect business health or growth. PageOn.ai helps teams create dashboards that distinguish between vanity metrics and true growth indicators.
Designing True Growth Dashboards
Visual hierarchies can help prioritize meaningful metrics over superficial ones. PageOn.ai helps create dashboards that put the focus on metrics that truly matter.
Vanity vs. True Growth Metrics
Comparing surface-level metrics with those that indicate true business health
Examples of vanity metrics vs. true growth indicators:
| Vanity Metric | True Growth Indicator |
|---|---|
| Page Views | Conversion Rate |
| Social Media Followers | Engagement Rate & Referrals |
| Downloads/Installs | Active Users & Retention |
| Email List Size | Open, Click & Conversion Rates |
| Registered Users | Activated & Paying Users |
Prioritizing Retention Over Hollow Acquisition
A key insight from "Hacking Growth" is that retention often matters more than acquisition. PageOn.ai helps create visual hierarchies that emphasize this priority.
                    graph TD
                        A[Growth Strategy] --> B[Retention]
                        A --> C[Engagement]
                        A --> D[Monetization]
                        A --> E[Acquisition]

                        B --> F[Cohort Retention Analysis]
                        B --> G[Churn Prevention]
                        B --> H[Reactivation Campaigns]

                        style B fill:#FF8000,color:white,stroke:#FF8000,stroke-width:4px
When creating visual dashboards that prioritize retention:
- Place retention metrics in the most prominent position
- Use color and size to emphasize retention-related KPIs
- Include cohort analysis to show how retention changes over time
- Highlight the connection between retention and lifetime value
Mapping the True User Journey
To distinguish between superficial interactions and true engagement, teams need to map the entire user journey. PageOn.ai helps create comprehensive journey maps that identify key engagement points.
Effective user journey maps highlight:
- Key touchpoints where users experience core product value
- Emotional states throughout the journey
- Potential drop-off points that need optimization
- Opportunities to deepen engagement and create habits
Honest Visual Growth Assessments
PageOn.ai helps teams create honest visual assessments of growth performance, avoiding the trap of celebrating vanity metrics while underlying business health suffers.
For teams looking to implement a more systematic approach to creating AI book report generators can help distill complex growth methodologies from sources like "Hacking Growth" into actionable frameworks tailored to your specific business context.
Growth Reality Check
Comparing surface growth to actual business impact
This chart visualizes a common scenario mentioned in "Hacking Growth": the danger of focusing on gross acquisition numbers (10,000 app downloads) while ignoring the reality that 9,900 users quickly uninstall. The true measure of growth is active users and revenue, not superficial acquisition metrics.
Sustainable Growth vs. Growth Hacking Myths
While many consultants and "growth ninjas" promise overnight success, the principles in "Hacking Growth" emphasize sustainable, methodical approaches. PageOn.ai helps visualize the difference between genuine growth strategies and hollow promises.
Growth Hacking Myths
- One magic tactic will solve everything
- Growth comes from marketing tricks, not product value
- Vanity metrics equal business success
- Growth hacking is separate from product development
- Rapid acquisition is more important than retention
True Growth Principles
- Systematic experimentation across multiple channels
- Product-market fit is the foundation of sustainable growth
- Focus on metrics that reflect real business value
- Cross-functional collaboration between product and marketing
- Retention and engagement drive long-term success
By using PageOn.ai to create clear visual distinctions between vanity metrics and true growth indicators, teams can avoid common pitfalls and focus on strategies that drive sustainable business success. This honest approach is central to the methodology outlined in "Hacking Growth" and essential for long-term results.
Transform Your Growth Strategy Visualizations with PageOn.ai
Apply the powerful principles from "Hacking Growth" to your business using PageOn.ai's intuitive AI-driven visualization tools. Create compelling dashboards, experiment frameworks, and growth models that drive real results.
Turning Growth Concepts into Visual Action
The methodologies presented in "Hacking Growth" by Sean Ellis and Morgan Brown have transformed how successful companies approach growth, creating a systematic framework for sustainable expansion without relying on traditional marketing approaches.
With over 700,000 copies sold globally, the book's impact is undeniable. The principles have helped companies like Dropbox, Instagram, and Airbnb achieve extraordinary growth with minimal traditional marketing spend. Now, PageOn.ai makes these same principles accessible through powerful visualization capabilities.
By creating visual models of growth processes, teams can:
- Transform abstract growth concepts into tangible, actionable plans
- Align cross-functional teams around common growth goals
- Design and document experiments in a systematic, transparent way
- Distinguish between vanity metrics and true business impact
- Create compelling visualizations that drive stakeholder buy-in
As you implement your own growth strategies, PageOn.ai's visualization tools can help transform complex concepts from "Hacking Growth" into clear visual expressions that drive understanding, alignment, and results. Whether you're just starting your growth journey or looking to optimize existing processes, PageOn.ai provides the visual framework to turn growth theory into practical action.
You Might Also Like
How to Design Science Lesson Plans That Captivate Students
Create science lesson plans that captivate students with hands-on activities, clear objectives, and real-world applications to foster curiosity and critical thinking.
How to Write a Scientific Review Article Step by Step
Learn how to write a review article in science step by step. Define research questions, synthesize findings, and structure your article for clarity and impact.
How to Write a Self-Performance Review with Practical Examples
Learn how to write a self-performance review with examples and tips. Use an employee performance review work self evaluation sample essay to guide your process.
How to Write a Spec Sheet Like a Pro? [+Templates]
Learn how to create a professional spec sheet with key components, step-by-step guidance, and free templates to ensure clarity and accuracy.