Asia Pacific's 46.3% AI Agent Boom
Mapping the Region's Digital Transformation Leadership
Discover how Asia Pacific has emerged as the global frontrunner in AI agent adoption, with Japan's market exploding from $253.3 million to $2.43 billion by 2030. This comprehensive analysis reveals the strategic drivers, technological innovations, and competitive advantages positioning APAC at the forefront of intelligent automation.
The APAC AI Agent Revolution: Understanding the Numbers Behind the Growth
The Asia Pacific region has emerged as an undisputed leader in AI agents adoption, demonstrating remarkable growth that outpaces global averages across multiple metrics. Japan's AI agents market serves as a prime example of this regional explosion, with projections showing a dramatic expansion from $253.3 million in 2024 to an impressive $2.43 billion by 2030.
Japan's Market Trajectory
Regional Leadership Statistics
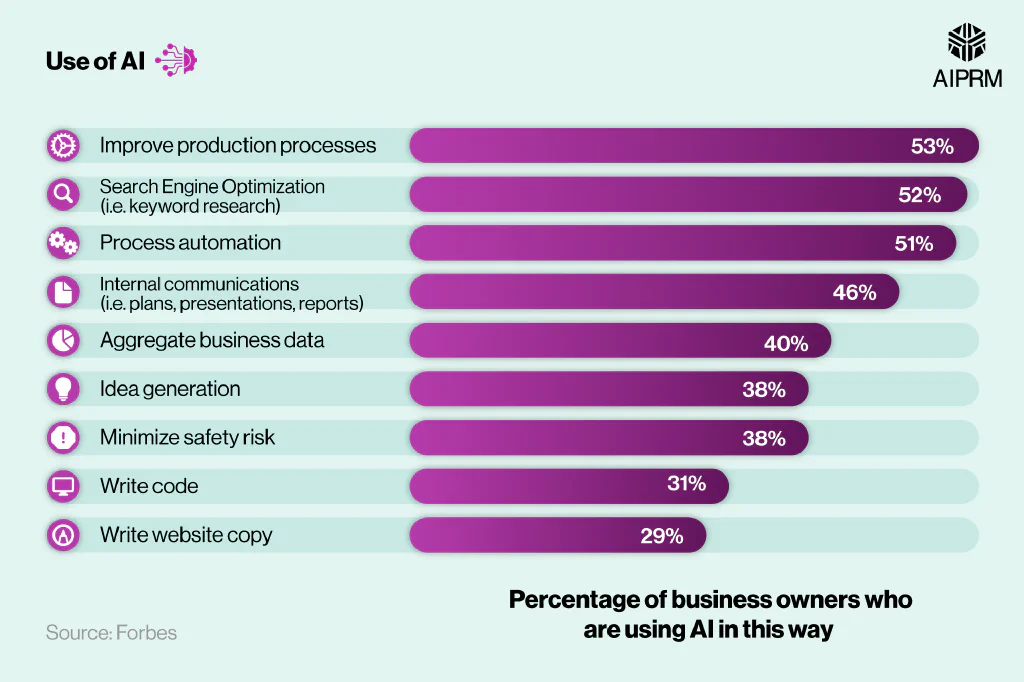
APAC businesses lead globally with 53% already automating full workstreams compared to the 46% global average, demonstrating the region's commitment to intelligent automation.
This extraordinary 46.3% CAGR growth is driven by multiple converging factors. Recent market analysis indicates that technological advancement, digital transformation initiatives, and substantial R&D investment surge across both private and public sectors are the primary catalysts. The market segmentation reveals Machine Learning as the dominant segment, while Deep Learning emerges as the fastest-growing component, reflecting the sophisticated evolution of AI capabilities in the region.
Leveraging PageOn.ai for Market Visualization
To effectively communicate these complex market dynamics, PageOn.ai's data visualization capabilities enable the creation of interactive charts and comparative growth trajectories. The platform's intuitive interface allows analysts and strategists to transform raw market data into compelling visual narratives that clearly illustrate APAC's dominance in the AI agent landscape.
Strategic Market Dynamics Fueling APAC's AI Agent Dominance
The foundation of APAC's leadership in AI agent adoption lies in the sophisticated integration of foundation models that enable autonomous multi-step task execution far beyond traditional rule-based systems. This technological leap represents a fundamental shift in how businesses approach automation and intelligent agents industry ecosystem development.
Foundation Model Integration Architecture
                        flowchart TD
                            A[Foundation Models] --> B[Multi-Step Task Processing]
                            B --> C[Autonomous Decision Making]
                            C --> D[Industry Applications]
                            D --> E[Manufacturing]
                            D --> F[Healthcare]
                            D --> G[Finance]
                            D --> H[Retail]

                            I[Traditional Rule-Based Systems] --> J[Limited Task Scope]
                            J --> K[Manual Intervention Required]

                            style A fill:#FF8000,stroke:#333,stroke-width:3px,color:#fff
                            style D fill:#42A5F5,stroke:#333,stroke-width:2px,color:#fff
                            style I fill:#ffcccc,stroke:#333,stroke-width:2px
Leadership adoption patterns reveal a significant shift in organizational dynamics. According to Microsoft's regional analysis, 74% of APAC leaders report being highly familiar with AI agents, positioning them ahead of employee adoption curves. This top-down familiarity creates a conducive environment for strategic implementation and organizational transformation.
Regional Pioneers by Market Share
Industry Deployment Patterns
China, Japan, and South Korea lead regional adoption across manufacturing, healthcare, finance, and retail sectors, establishing comprehensive AI agent integration strategies.
Creating Market Ecosystem Maps with PageOn.ai
PageOn.ai's AI Blocks feature provides an ideal solution for structuring complex market relationships and ecosystem dynamics. By leveraging modular diagram components, analysts can create comprehensive visual representations of how foundation models, industry applications, and regional adoption patterns interconnect to drive the APAC AI agent revolution.
Transforming Business Operations: From Automation to Intelligent Partnerships
The evolution of AI assistants into sophisticated agents represents a fundamental shift in how organizations approach operational efficiency. Rather than simple task automation, these intelligent systems now function as research assistants, analysts, and creative partners, enabling companies to deploy lean, high-impact teams on demand while maintaining exceptional output quality.
Agent-Human Collaboration Workflow
                        sequenceDiagram
                            participant H as Human Manager
                            participant A as AI Agent
                            participant S as Systems
                            participant D as Data Sources

                            H ->> A: Define objectives and parameters
                            A ->> D: Gather relevant data
                            D ->> A: Provide real-time information
                            A ->> S: Execute multi-step processes
                            S ->> A: Return process results
                            A ->> A: Analyze and synthesize findings
                            A ->> H: Present insights and recommendations
                            H ->> A: Approve or refine approach
                            A ->> S: Implement approved actions
                            S ->> H: Deliver final outcomes
The statistics reveal the profound impact of this transformation. More than half of APAC leaders (53%) are already using agents to fully automate workstreams or business processes, significantly higher than any other region and well above the global average of 46%. This adoption rate demonstrates not just technological capability but strategic commitment to reimagining organizational structures around intelligent automation.
Research Assistants

AI agents process vast datasets, identify patterns, and generate comprehensive research reports in fraction of traditional timeframes.
Strategic Analysts
Advanced analytical capabilities enable real-time market assessment, competitive analysis, and strategic recommendation generation.
Creative Partners

Creative AI agents contribute to content generation, design processes, and innovative problem-solving across industries.
Workstream Automation Implementation Rates
Interactive Workflow Design with PageOn.ai
PageOn.ai's Vibe Creation feature excels at designing interactive workflow visualizations that clearly show agent integration points within existing business processes. This capability enables organizations to map their transformation journey and identify optimal areas for AI agent deployment, ensuring maximum impact and seamless integration.
Technology Infrastructure and Innovation Ecosystem
The technological foundation enabling APAC's AI agent dominance rests on sophisticated foundation model capabilities that drive multi-step autonomous operations. These systems represent a quantum leap beyond traditional automation, incorporating advanced natural language processing, computer vision, and machine learning algorithms that enable contextual understanding and adaptive decision-making across complex business scenarios.
Technology Stack Architecture
                        graph TD
                            subgraph "Foundation Layer"
                                A[Large Language Models]
                                B[Computer Vision Systems]
                                C[Machine Learning Frameworks]
                            end

                            subgraph "Integration Layer"
                                D[API Management]
                                E[Data Pipeline Orchestration]
                                F[Security & Compliance]
                            end

                            subgraph "Application Layer"
                                G[Agent Deployment Platform]
                                H[Workflow Automation Engine]
                                I[Real-time Analytics Dashboard]
                            end

                            subgraph "Industry Applications"
                                J[Manufacturing Optimization]
                                K[Healthcare Diagnostics]
                                L[Financial Analysis]
                                M[Retail Personalization]
                            end

                            A --> D
                            B --> E
                            C --> F
                            D --> G
                            E --> H
                            F --> I
                            G --> J
                            H --> K
                            I --> L
                            G --> M

                            style A fill:#FF8000,stroke:#333,stroke-width:2px,color:#fff
                            style G fill:#42A5F5,stroke:#333,stroke-width:2px,color:#fff
R&D spending patterns across APAC reveal a strategic commitment to maintaining technological leadership. Both public and private sectors are investing heavily in AI infrastructure, with governments implementing supportive policy frameworks while corporations allocate substantial resources to company ai transformation roadmap development and implementation.
R&D Investment by Sector (2024)
Integration Challenges & Solutions

Multi-step autonomous operations require sophisticated integration solutions addressing data security, workflow compatibility, and scalability challenges.
Real-time Technology Integration with PageOn.ai
PageOn.ai's Deep Search functionality enables organizations to integrate real-time technology trend data and innovation metrics into their strategic planning processes. This capability ensures that infrastructure decisions are based on the most current market intelligence and technological developments, maintaining competitive advantage in the rapidly evolving AI landscape.
Strategic Implications for Global AI Competition
APAC's commanding position in AI agent adoption creates significant strategic implications for global competition. The region's 46.3% CAGR growth rate and superior implementation statistics establish a competitive moat that influences international technology transfer patterns, policy frameworks, and investment flows. This leadership position in the us-china ai race extends beyond simple market metrics to encompass fundamental shifts in economic competitiveness.
Global AI Competition Landscape
                        graph LR
                            subgraph "APAC Leadership"
                                A[China: 35% Market Share]
                                B[Japan: 25% Market Share]
                                C[South Korea: 18% Market Share]
                                D[Other APAC: 22%]
                            end

                            subgraph "Competitive Advantages"
                                E[46.3% CAGR Growth]
                                F[53% Full Automation Rate]
                                G[74% Leadership Familiarity]
                                H[Strong R&D Investment]
                            end

                            subgraph "Global Impact"
                                I[Technology Transfer]
                                J[Policy Influence]
                                K[Investment Flows]
                                L[Talent Migration]
                            end

                            A --> E
                            B --> F
                            C --> G
                            D --> H
                            E --> I
                            F --> J
                            G --> K
                            H --> L

                            style A fill:#FF8000,stroke:#333,stroke-width:2px,color:#fff
                            style E fill:#42A5F5,stroke:#333,stroke-width:2px,color:#fff
                            style I fill:#66BB6A,stroke:#333,stroke-width:2px,color:#fff
Regional Policy Framework Comparison
| Region | Policy Support | Investment Level |
|---|---|---|
| APAC | Comprehensive | High |
| North America | Moderate | High |
| Europe | Regulatory Focus | Medium |
Future Market Projections

Cross-border collaboration patterns and technology transfer flows position APAC as the central hub for global AI agent innovation and deployment.
The sustainable growth strategies emerging from APAC focus on maintaining technological leadership through continued innovation investment, strategic partnerships, and talent development programs. Regional governments are implementing forward-looking policies that balance innovation promotion with responsible AI development, creating frameworks that other regions increasingly adopt as best practices.
Visualizing Complex Relationships with PageOn.ai
PageOn.ai's comprehensive visualization tools excel at transforming complex geopolitical and economic relationships into clear visual narratives. The platform's ability to create interconnected diagrams, dynamic charts, and interactive maps enables policymakers and business leaders to understand and communicate the multifaceted implications of APAC's AI agent leadership on global competition dynamics.
Transform Your Visual Expressions with PageOn.ai
Ready to create compelling visual narratives that clearly communicate complex market dynamics and strategic insights? PageOn.ai empowers you to transform data into stunning, interactive visualizations that drive understanding and decision-making.
Start Creating with PageOn.ai TodayYou Might Also Like
Visualizing Your Path to Personal Success: Map and Measure What Truly Matters
Discover how to map and visualize your personal success metrics, align them with your core values, and create a customized tracking system that motivates genuine fulfillment.
Visualizing Spooky Action at a Distance: Making Quantum Entanglement Comprehensible
Explore quantum entanglement visualization techniques that transform Einstein's 'spooky action at a distance' from abstract theory into intuitive visual models for better understanding.
Mapping the Great Depression: Visualizing Economic Devastation and Recovery
Explore how data visualization transforms our understanding of the Great Depression, from unemployment heat maps to New Deal program impacts, bringing America's greatest economic crisis to life.
Visualizing Electronics Fundamentals: ROHM's Component Guide for Beginners to Experts
Explore ROHM's electronics basics through visual guides covering essential components, power semiconductors, sensors, automotive applications, and design resources for all skill levels.