Transform Your Pitches: Audience-First Visualization Strategies
The psychology and techniques behind pitches that consistently win
I've spent years perfecting the art of audience-centered pitching, and I've discovered that the difference between a forgettable presentation and one that drives action lies in how well you visualize your message for your specific audience. In this guide, I'll share my proven strategies for creating pitches that resonate deeply and win consistently.
The Psychology Behind Audience-Centered Pitching
I've found that traditional pitch approaches often fail because they focus on what the presenter wants to say rather than what the audience needs to hear. When I started centering my pitches on my audience's psychology, my success rate dramatically improved.
The cognitive science is clear: information sticks when it connects to existing mental frameworks in your audience's minds. When I create visuals that align with how my audience already processes information, I'm able to bypass resistance and create instant recognition.
The Cognitive Processing Gap
Visual processing significantly impacts decision-making during pitches. When I present information visually, my audience can process it up to 60,000 times faster than text, making my key points more likely to influence their decisions. This is why I always ensure that my most crucial arguments are supported by clear, intuitive visualizations.
Using successful pitch decks examples as inspiration, I've found that PageOn.ai's Vibe Creation tool is invaluable for aligning my pitch style with my audience's communication preferences. By analyzing my audience first, I can generate visuals that match their expected processing style, whether they prefer data-heavy analytics or conceptual illustrations.
Mapping Your Audience's Decision Journey
Before creating a single slide, I always conduct thorough audience analysis that goes far beyond basic demographics. Understanding the decision journey my audience will take helps me create visuals that address their specific needs at each stage.
Audience Decision Journey Map
A visualization of how your audience moves from awareness to decision
                    flowchart LR
                        A[Awareness] -->|Problem Recognition| B[Consideration]
                        B -->|Evaluation of Options| C[Decision Point]
                        C -->|Commitment| D[Action]
                        subgraph "Visual Needs"
                        E[Problem Visualization]
                        F[Comparison Visuals]
                        G[Benefit Visualization]
                        H[Next Steps Clarity]
                        end
                        A --- E
                        B --- F
                        C --- G
                        D --- H
                        style A fill:#FF8000,color:#fff
                        style B fill:#FFA040,color:#fff
                        style C fill:#FFB060,color:#fff
                        style D fill:#FFC080,color:#fff
Techniques for Pre-Pitch Audience Analysis
- I conduct stakeholder interviews with sample audience members when possible
- I review previous successful presentations to the same audience type
- I analyze the language and visual style used in their own communications
- I identify their industry's current challenges through research
Identifying Pain Points
The most compelling pitches directly address current challenges. As Harvard research on audience-centered speaking shows, "listeners will spend most of their 'thinking time' trying to link your ideas to their current needs and challenges." I always research these pain points thoroughly:
| Pain Point Category | Research Method | Visual Representation |
|---|---|---|
| Financial Concerns | Industry reports, annual statements | Cost comparison charts, ROI timelines |
| Operational Inefficiencies | Process analysis, employee interviews | Before/after workflow diagrams |
| Market Position Concerns | Competitor analysis, market trends | Positioning maps, trend projections |
| Technical Limitations | System audits, capability assessments | Capability enhancement visuals |
I've found that visualizing audience personas and decision criteria is much more effective with PageOn.ai's AI Blocks. This tool allows me to create detailed audience persona maps that highlight each stakeholder's priorities, objections, and preferred information style. When I present to multiple decision-makers, having these visual personas helps me craft sections that speak directly to each person's concerns.
Visual Storytelling: Beyond Basic Presentations
I've learned that transforming complex pitch data into memorable visual narratives is essential for making information stick. When I use visual storytelling techniques, my audience retains up to 65% more information compared to text-heavy presentations.
Creating Progression-Based Visuals
One of the most effective techniques I use is creating visuals that show clear progression. As noted by pitch experts, "The more progression and flow your main points have, the better the idea will 'click' in the heads of your audience."
Problem → Action → Solution Progression
                        flowchart LR
                            A["🔍 PROBLEM
                            Current State"] -->|Identify Gap| B["⚙️ ACTION
                            Our Approach"] -->|Implement| C["✅ SOLUTION
                            Future State"]
                            style A fill:#FF8000,color:#fff,stroke-width:0
                            style B fill:#FF6000,color:#fff,stroke-width:0
                            style C fill:#FF4000,color:#fff,stroke-width:0
Incorporating Engaging Stories
I always include at least one compelling story in my pitches. According to research on winning pitches, "Storytelling is one of the easiest ways to add relevant information to your pitch that is exciting. Stories let the audience picture things in their mind."
Story Structure for Visual Pitches
- Character & Context: Introduce a relatable character (customer, user, stakeholder) facing the problem you solve
- Conflict & Challenge: Visualize their specific struggle in a way that resonates with your audience
- Climax & Change: Show the turning point where your solution enters the story
- Resolution & Results: Visualize the positive outcome with concrete, measurable improvements

I've found that visually mapping my story arc helps ensure my narrative has the right emotional progression. The most effective pitches create an emotional journey that mirrors the logical progression of problem → action → solution. When these align, the audience experiences both intellectual understanding and emotional resonance.
PageOn.ai has transformed how I create visual story arcs for my pitches. I can quickly generate progression visualizations that highlight the journey from problem to solution, making my pitch narrative much more compelling. This is particularly valuable when creating 2-minute pitch deck presentations where every visual must efficiently communicate a key story point.
Interactive Engagement Strategies
I've discovered that involving my audience through interactive elements dramatically increases their investment in my pitch. When people participate, they become co-creators rather than passive listeners.
Strategic Questioning Techniques
One of my favorite ways to engage audiences is through strategic questioning. This creates mental participation even in formal pitch settings where physical interaction might be limited.
| Question Type | Purpose | Visual Support | Example |
|---|---|---|---|
| Problem Recognition | Create awareness | Problem visualization | "How much time does your team currently spend on...?" |
| Reflection | Deepen engagement | Comparison charts | "Which of these challenges resonates most with you?" |
| Future Projection | Create vision | Before/after scenarios | "What would it mean if you could reduce this process by 50%?" |
| Commitment | Drive action | Implementation timeline | "Which implementation timeline aligns with your goals?" |
Creating Visual Demonstrations
As experts in pitch development note, "Seeing is believing. When pitching your idea, use interactive models, visuals, or a pitch deck in real-time to get your audience involved."

Effective Visual Demonstrations
- Physical prototypes that audience members can examine
- Live software demonstrations showing real-world applications
- Before/after interactive comparisons
- Simulations that allow audience members to adjust variables
- Augmented reality experiences that visualize potential outcomes
I've found that these interactive elements create what I call "experience anchors" – memorable moments that the audience associates with your pitch long after the presentation ends.
Audience Engagement Impact
PageOn.ai's Deep Search feature has revolutionized how I find and integrate interactive elements into my pitches. I can quickly discover relevant demonstrations, comparisons, and visual examples that perfectly match my audience's interests. This allows me to create effective presentation skills demonstrations that keep audiences fully engaged throughout my pitch.
Visualizing Benefits, Not Features
I've learned that one of the most common pitching mistakes is focusing on features rather than benefits. My breakthrough came when I started visually translating every feature into audience-specific benefits.
Feature-to-Benefit Visual Translation
                        flowchart TD
                            A[Product/Service Feature] --> B{So What?}
                            B -->|For Executives| C[Strategic Benefit]
                            B -->|For Operations| D[Efficiency Benefit]
                            B -->|For Finance| E[Financial Benefit]
                            B -->|For End Users| F[Experience Benefit]
                            C --> G[Visual: Strategic Position Chart]
                            D --> H[Visual: Process Flow Comparison]
                            E --> I[Visual: ROI/Cost Reduction Graph]
                            F --> J[Visual: User Experience Improvement]
                            style A fill:#FF8000,color:#fff
                            style B fill:#FF6000,color:#fff
                            style C fill:#42A5F5,color:#fff
                            style D fill:#66BB6A,color:#fff
                            style E fill:#FFC107,color:#fff
                            style F fill:#EC407A,color:#fff
Creating Compelling Before/After Scenarios
I've found that before/after visual comparisons are incredibly powerful for helping audiences emotionally connect with the benefits of my solution.
BEFORE
- Manual process requiring 40+ hours monthly
- 15% error rate requiring costly corrections
- Limited visibility into process bottlenecks
- Delayed reporting affecting decision-making
- Staff frustration and low morale
AFTER
- Automated process saving 35+ hours monthly
- Error rate reduced to less than 1%
- Real-time dashboard for complete visibility
- Instant reporting enabling proactive decisions
- Staff redeployed to higher-value activities
Quantifying Abstract Benefits
Visualizing the tangible impact of seemingly intangible benefits
PageOn.ai has been instrumental in helping me transform benefit statements into compelling visual comparisons. The platform makes it easy to create before/after scenarios, comparison charts, and data visualizations that clearly communicate the value of my solution to different audience segments. This approach has been particularly effective when creating successful pitch decks that focus on benefits rather than features.
The Confidence Factor: Visual Authority in Presentations
I've discovered that visual clarity directly impacts how my audience perceives my expertise and confidence. When my visuals are polished and professional, I'm automatically viewed as more authoritative on my subject.

Nonverbal Visual Cues
Research on pitch effectiveness confirms that "a timid sales pitch could tell your listener the idea's execution will also be timid." I've found that both my physical presence and my visual materials need to project confidence.
- Physical Presence: Maintain eye contact, use confident gestures, and adopt power poses
- Visual Materials: Use clean, professional designs with consistent branding
- Data Presentation: Display data in clear, easily digestible formats
- Color Psychology: Use colors strategically to evoke desired emotional responses
- Typography: Choose fonts that project professionalism and authority
Creating Visuals That Project Authority Without Intimidation
The key to effective visual authority is balancing professionalism with approachability. I've developed a framework for creating visuals that command respect without creating distance.
Authority-Approachability Balance
                        flowchart TD
                            A[Visual Authority Elements] --> B[Professional Design]
                            A --> C[Data Visualization]
                            A --> D[Clarity & Structure]
                            E[Approachability Elements] --> F[Relatable Examples]
                            E --> G[Storytelling]
                            E --> H[Interactive Components]
                            B & C & D --> I[Authority Without Intimidation]
                            F & G & H --> I
                            style A fill:#FF8000,color:#fff
                            style E fill:#42A5F5,color:#fff
                            style I fill:#66BB6A,color:#fff
Impact of Visual Quality on Perceived Expertise
PageOn.ai has been a game-changer for me in creating professional visualizations even without design experience. The platform's templates and AI-assisted design tools help me create visuals that project authority while remaining approachable and engaging. This has significantly improved my informative speech topics on sports presentations and other specialized content areas where establishing expertise is crucial.
Closing Visuals That Drive Action
I've learned that the final visuals in my pitch are often the most critical. They need to transition the audience from understanding to action with absolute clarity about next steps.
Designing Clear Call-to-Action Visuals
Pitch experts emphasize that you should "let your audience know how to continue, and be as specific and directed as possible." I've found that visual CTAs are far more effective than verbal ones alone.
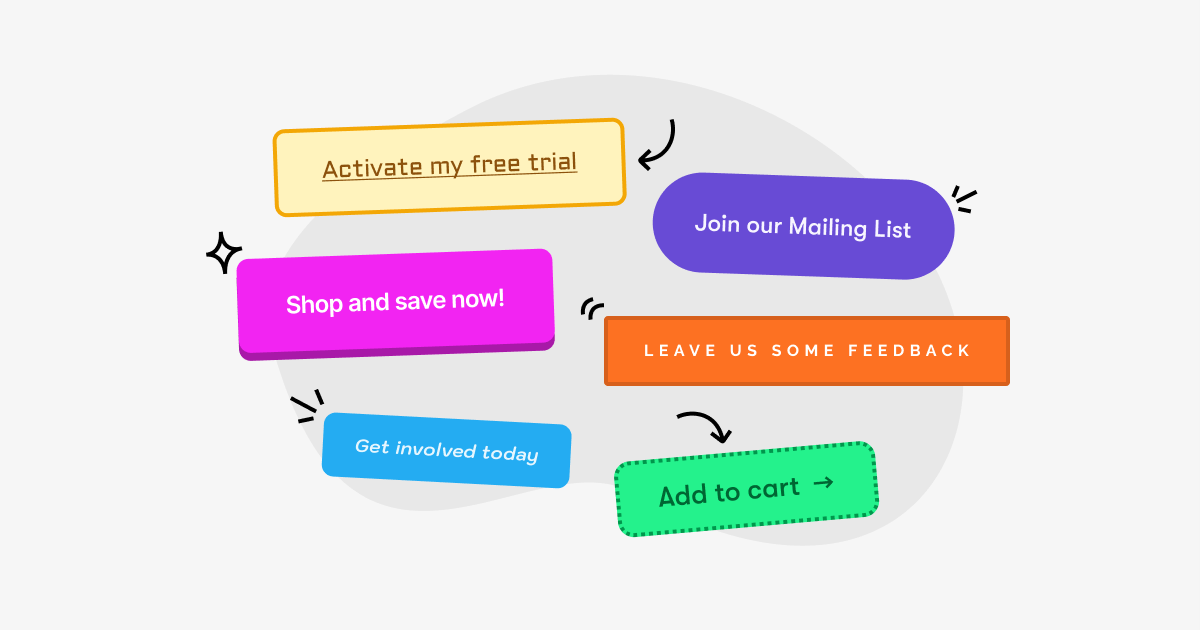
Elements of Effective CTA Visuals
- Visual Hierarchy: Make the action step visually prominent
- Specificity: Show exactly what happens next (e.g., "Schedule Demo" vs "Learn More")
- Urgency Indicators: Visual cues that suggest timeliness
- Simplicity: Remove all distractions from the core action request
- Confirmation Elements: Visual reassurance about what happens after action
Creating Visual "Next Steps" That Eliminate Ambiguity
Implementation Timeline
                        gantt
                            title Implementation Roadmap
                            dateFormat  YYYY-MM-DD
                            section Discovery
                            Needs Assessment       :a1, 2023-06-01, 14d
                            Current State Analysis :a2, after a1, 10d
                            section Implementation
                            Initial Setup          :b1, after a2, 7d
                            Team Training          :b2, after b1, 10d
                            section Optimization
                            First Review           :c1, after b2, 14d
                            Refinements            :c2, after c1, 10d
                            section Results
                            Full Deployment        :d1, after c2, 7d
                            ROI Measurement        :d2, after d1, 21d
I've found that visual implementation timelines eliminate ambiguity and help audiences visualize the journey ahead. This reduces perceived risk and makes the next steps feel more concrete and achievable.
Visualizing ROI and Value Propositions
At the closing stage, I always include a clear visualization of the return on investment or value proposition. This reinforces the "why" behind taking action now.
ROI Timeline Visualization
PageOn.ai's AI Blocks feature has transformed how I create compelling closing visuals. I can quickly generate implementation timelines, ROI projections, and clear next steps that guide my audience toward commitment. The platform makes it easy to create professional-looking visuals that drive action without requiring advanced design skills.
Measuring and Refining Your Visual Pitch Strategy
I've learned that the most successful pitchers don't just create great presentations—they systematically measure results and continuously refine their approach based on audience feedback.
Collecting Meaningful Audience Feedback
To truly understand what's working in my visual pitch strategy, I use several methods to gather actionable feedback.
| Feedback Method | When to Use | What to Measure |
|---|---|---|
| Post-Presentation Survey | Formal presentations | Visual clarity, engagement, comprehension |
| Audience Observation | During presentation | Body language, attention points, questions |
| Follow-up Questions | Post-presentation | Information retention, misconceptions |
| Conversion Metrics | After decision point | Action rates, follow-through |
A/B Testing Different Visual Elements
Elements to Test
- Story sequence and progression
- Data visualization formats
- Color schemes and emphasis
- Text-to-visual ratio
- Interactive vs. static elements
- Opening and closing visuals
Testing Methodology
- Create two versions with single variable changes
- Present to similar audience segments
- Measure specific response metrics
- Analyze differences in outcomes
- Implement winning approach
- Test new variables in next iteration
Iterative Improvement Framework
                        flowchart TD
                            A[Create Initial Visual Strategy] --> B[Deliver Pitch]
                            B --> C[Collect Feedback]
                            C --> D[Analyze Results]
                            D --> E[Identify Improvement Areas]
                            E --> F[Generate Alternative Approaches]
                            F --> G[Test New Variations]
                            G --> B
                            style A fill:#FF8000,color:#fff
                            style B fill:#FF9020,color:#fff
                            style C fill:#FFA040,color:#fff
                            style D fill:#FFB060,color:#fff
                            style E fill:#FFC080,color:#fff
                            style F fill:#FFD0A0,color:#fff
                            style G fill:#FFE0C0,color:#fff
PageOn.ai has revolutionized how I test and refine my visual pitch strategies. The platform allows me to quickly generate alternative visual approaches for testing different narratives, data presentations, and engagement techniques. This ability to rapidly iterate based on audience feedback has significantly improved my pitch success rate over time.
Transform Your Visual Expressions with PageOn.ai
Ready to create audience-centered pitches that consistently win? PageOn.ai provides all the tools you need to transform your ideas into compelling visual narratives, even without design experience. From audience analysis to interactive engagement strategies, our platform makes it easy to create professional-quality visualizations that drive action.
The Future of Audience-Centered Pitching
As I look to the future of pitching techniques, I'm convinced that audience-centered visualization will only become more critical. In a world of information overload, the ability to create visual experiences that resonate with specific audiences will separate successful pitches from forgettable ones.
The most effective pitchers will be those who can rapidly adapt their visual approach based on audience feedback and continuously refine their strategies. Tools like PageOn.ai are making this level of visual sophistication accessible to everyone, not just design professionals.
I encourage you to start implementing these audience-centered visualization strategies in your next pitch. Begin by focusing on your audience's decision journey, create visual narratives that showcase benefits rather than features, and continuously refine your approach based on feedback. With these techniques and the right tools, you'll be well on your way to creating pitches that consistently win.
You Might Also Like
Creating Impactful Cultural Presentations: AI-Driven Visual Storytelling for Cultural Expression
Discover how to create authentic cultural presentations using AI-driven visual storytelling techniques. Learn to transform cultural concepts into engaging visual narratives with PageOn.ai.
Transforming Presentation Creation Through Conversational AI | Building Presentations With Natural Language
Discover how natural language conversations are revolutionizing presentation creation, enabling faster, more intuitive visual storytelling with AI assistance that transforms abstract ideas into compelling visuals.
Creating Engaging Visual Process Guides: Transform Complex Workflows into Interactive Timelines
Learn how to create effective visual process guides using interactive timelines. Transform complex workflows into clear, engaging visual timelines that improve comprehension and drive better results.
From Prompt to Presentation in Under 60 Seconds: Transform Your Ideas Instantly
Discover how to create impactful presentations in under 60 seconds using PageOn.ai. Learn techniques for visual storytelling, rapid content creation, and audience engagement.