Transforming Spreadsheet Chaos to Clarity
Modern Approaches to Automated Data Cleaning and Visualization
I've spent years wrestling with messy spreadsheets, and I'm excited to share how modern automated techniques are revolutionizing the way we clean and transform data. From basic duplicate removal to AI-powered anomaly detection, these approaches are changing what's possible with everyday spreadsheet tools.
The Evolution of Spreadsheet Data Management
When I first started working with spreadsheets, data cleaning was a tedious, manual process. I'd spend hours hunting for duplicates, standardizing formats, and fixing errors cell by cell. This approach wasn't just inefficient—it was also error-prone and soul-crushing.
The evolution from these manual processes to today's automated workflows represents one of the most significant shifts in how we handle data. Modern spreadsheet tools have transcended their origins as simple calculation aids to become sophisticated data management platforms.
Key Pain Points in Traditional Data Preparation
- Time-consuming manual processes that don't scale with data volume
- Inconsistent results when multiple team members clean data
- Difficulty tracking what changes were made and why
- Inability to easily repeat the same cleaning process on new data
- Limited tools for handling complex data quality issues
The emergence of AI-assisted data cleaning technologies has been particularly transformative. These tools can now recognize patterns, suggest corrections, and even learn from your past cleaning decisions to automate future work.

Essential Automated Cleaning Techniques for Today's Datasets
Modern spreadsheet applications offer powerful built-in functionality for automating common data cleaning tasks. I've found these techniques can eliminate hours of manual work while producing more consistent results.
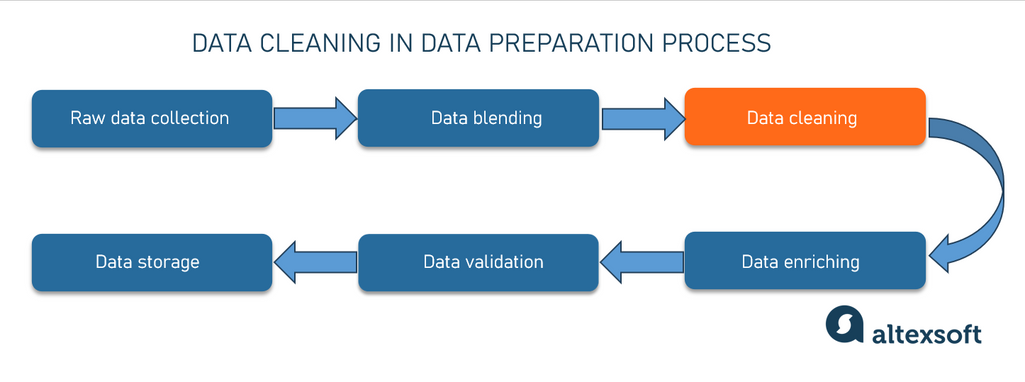
Data Cleaning Workflow
The standard progression of automated data cleaning operations:
                    flowchart TD
                        A[Import Raw Data] --> B[Remove Duplicates]
                        B --> C[Standardize Formats]
                        C --> D[Clean Text Data]
                        D --> E[Handle Missing Values]
                        E --> F[Validate Data Types]
                        F --> G[Export Clean Dataset]
                        style A fill:#FF8000,color:#fff
                        style G fill:#FF8000,color:#fff
Identifying and Removing Duplicate Entries
Duplicate detection has evolved significantly beyond simple exact-match comparison. Smart detection now includes:
- Fuzzy matching to catch near-duplicates with slight variations
- Multi-column comparison for complex duplicate scenarios
- Phonetic matching for names and other text fields
- Record linkage techniques for identifying related entries
Standardizing Inconsistent Data Formats
I've found that format standardization is essential for meaningful analysis. Modern tools can automatically:
| Data Type | Common Issues | Automated Solution |
|---|---|---|
| Dates | MM/DD/YY vs. DD/MM/YY vs. text dates | Pattern recognition and bulk conversion |
| Phone Numbers | Different separators, country codes | Format extraction and standardization |
| Names | Capitalization, order, prefixes/suffixes | Name parsing algorithms |
| Addresses | Abbreviations, missing components | Address verification APIs |
Handling Missing Values
Intelligent imputation methods have transformed how we deal with data gaps:
- Mean/median/mode imputation based on column statistics
- Predictive modeling to estimate missing values
- Pattern-based filling from related records
- Time series interpolation for sequential data
Advanced Transformation Techniques for Complex Datasets
Beyond basic cleaning, I've discovered that advanced transformation techniques can reshape data into more usable structures and extract deeper insights. These approaches are particularly valuable when working with complex or large-scale datasets.
Converting Unstructured Data into Structured Formats
One of the most powerful transformations is turning unstructured information into structured data:
                    flowchart LR
                        A[Unstructured Text] --> B{Text Parsing}
                        B --> C[Named Entity Recognition]
                        B --> D[Pattern Extraction]
                        B --> E[Tokenization]
                        C --> F[Structured Data Table]
                        D --> F
                        E --> F
                        style A fill:#FF8000,color:#fff
                        style F fill:#FF8000,color:#fff
Normalizing Numerical Data
Statistical normalization is essential for meaningful comparisons and analysis:
Batch Processing for Large-Scale Operations
When dealing with massive datasets, I've found these batch processing techniques to be invaluable:
- Chunking data into manageable segments for processing
- Parallel processing of independent data sections
- Incremental transformation with checkpointing
- Memory-efficient streaming operations for very large files
Dynamic Data Validation Rules
Modern spreadsheets allow for sophisticated validation that adapts to your data:
- Conditional validation based on values in other cells
- Regular expression pattern matching for complex text validation
- Cross-referencing against external data sources
- Custom validation functions using spreadsheet scripting
AI-Powered Data Preparation Solutions
The integration of artificial intelligence into data preparation has revolutionized what's possible. I've been amazed at how AI can detect patterns and anomalies that would be nearly impossible to spot manually.
Machine Learning for Anomaly Detection
AI-powered anomaly detection can identify outliers and potential errors through:
- Unsupervised learning to establish normal data patterns
- Statistical distance measurements to identify outliers
- Classification models trained on known error types
- Adaptive thresholds that adjust to your specific data distribution
Natural Language Processing for Text Standardization
When working with text data, I've found NLP techniques particularly valuable:
- Entity recognition to extract structured information from text
- Sentiment analysis to categorize feedback or comments
- Topic modeling to group related text entries
- Automated text correction and standardization
Visualizing Complex Data Relationships
PageOn.ai's AI Blocks provide a powerful way to structure and visualize complex relationships in your data. This helps me understand interconnections that might be missed in traditional table views.

Predictive Cleaning: Anticipating Data Issues
The most advanced AI tools don't just fix problems—they predict them:
- Identifying columns likely to contain errors based on historical patterns
- Suggesting validation rules based on data characteristics
- Forecasting data quality issues in upcoming data imports
- Recommending preventative measures for common error types
Using PageOn.ai's Deep Search functionality, I can integrate external data sources to validate and enrich my datasets, dramatically improving data quality and completeness.
From Raw Data to Actionable Insights
Clean data is just the beginning. The real value comes from transforming that data into meaningful visualizations and insights that drive decisions. I've found that this translation from numbers to knowledge is where many data projects succeed or fail.
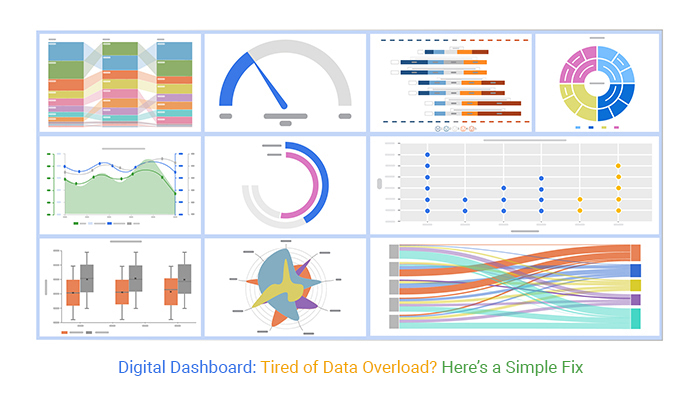
Creating Compelling Visualizations
After cleaning your data, data visualization in Excel becomes much more powerful. Clean, structured data enables:
Dynamic Charts
Charts that automatically update as new data arrives, maintaining consistent formatting and scaling
Interactive Filters
Slicers and filters that let users explore different segments of your data without modifying the source
Conditional Formatting
Visual cues that highlight trends, exceptions, and patterns across large datasets
Advanced Chart Types
Specialized visualizations like waterfall charts, heatmaps, and treemaps for specific analytical needs
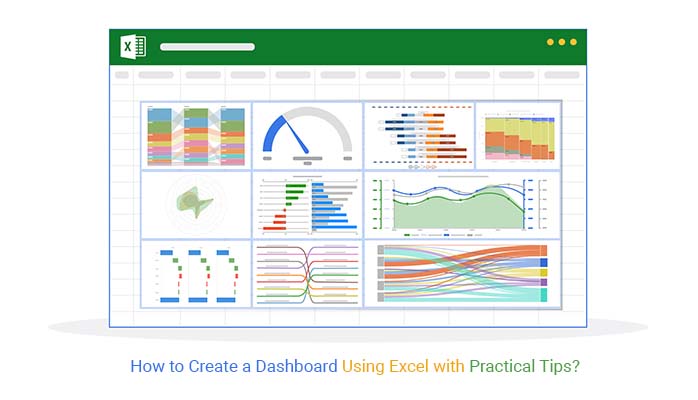
Building Dynamic Dashboards
With automated data pipelines feeding clean data, I can create dashboards that:
                    flowchart LR
                        A[Data Sources] --> B[Automated Cleaning]
                        B --> C[Transformation Layer]
                        C --> D[Analysis Engine]
                        D --> E[Dashboard Interface]
                        style A fill:#FFB066
                        style B fill:#FF8000,color:#fff
                        style C fill:#FF8000,color:#fff
                        style D fill:#FFB066
                        style E fill:#FF8000,color:#fff
Using AI tools for excel charts can dramatically enhance the quality and impact of your data presentations. These tools can suggest optimal chart types, color schemes, and layouts based on your specific data characteristics.
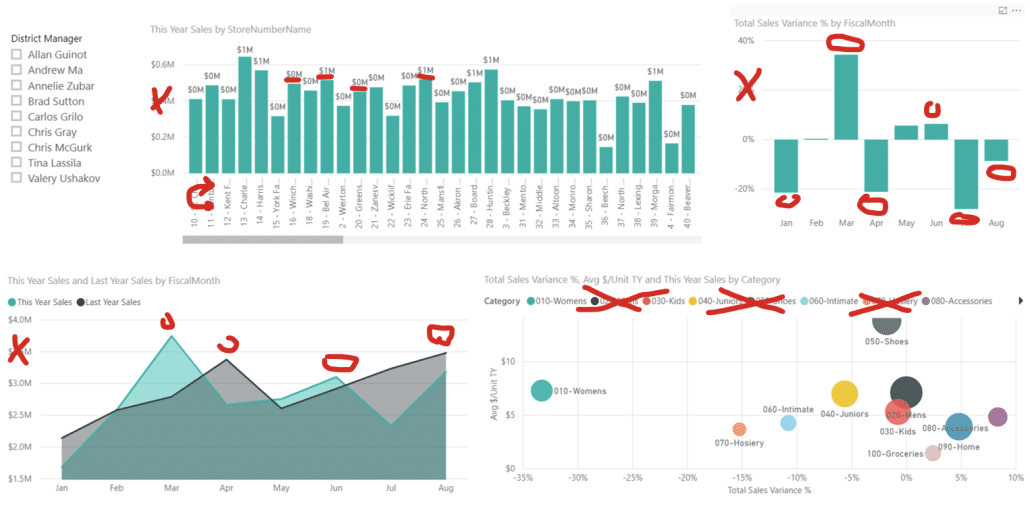
Communicating Data Stories Effectively
PageOn.ai's Vibe Creation feature has transformed how I present data stories:
- Crafting cohesive narratives from disparate data points
- Creating visual themes that reinforce key messages
- Highlighting critical insights that might otherwise be missed
- Generating presentation-ready visualizations that resonate with specific audiences
Learning the best way to present data in Excel after cleaning operations ensures your hard work translates into maximum impact. The key is matching your visualization approach to both your data characteristics and your audience's needs.
Building Efficient Data Transformation Workflows
The real power of automated data cleaning comes from creating repeatable workflows. I've found that investing time in building these systems pays enormous dividends when dealing with recurring data tasks.
Designing Reusable Templates and Macros
Creating standardized templates for common data cleaning scenarios ensures:
- Consistent application of cleaning rules across datasets
- Faster onboarding for team members who need to clean similar data
- Built-in documentation of cleaning decisions and logic
- Reduced risk of missing critical cleaning steps
Automating Recurring Tasks with Scripts
For repetitive data cleaning tasks, I rely on automation scripts that can:
- Execute complex cleaning sequences with a single command
- Process multiple files using the same cleaning logic
- Schedule cleaning operations to run at specific times
- Generate reports on what was cleaned and why
Creating Custom Functions
When built-in functions don't meet my needs, I develop custom functions for:
// Example custom function for advanced text cleaning in Google Apps Script
function STANDARDIZE_COMPANY_NAMES(input) {
  if (input === null || input === '') return '';
  // Convert to uppercase for comparison
  let name = input.toString().toUpperCase();
  // Remove common legal suffixes
  name = name.replace(/(,)?\s+(INC|LLC|LTD|CORP|CORPORATION)\.?$/i, '');
  // Standardize common abbreviations
  name = name.replace(/\bINTL\b/g, 'INTERNATIONAL');
  name = name.replace(/\b&\b/g, 'AND');
  // Remove special characters and extra spaces
  name = name.replace(/[^\w\s]/g, ' ').replace(/\s+/g, ' ').trim();
  return name;
}
Implementing Quality Control Checkpoints
Effective workflows include validation at critical stages:
                    flowchart TD
                        A[Data Import] --> B{Format Check}
                        B -->|Pass| C[Initial Cleaning]
                        B -->|Fail| D[Error Report]
                        C --> E{Completeness Check}
                        E -->|Pass| F[Advanced Transformation]
                        E -->|Fail| G[Missing Data Handler]
                        G --> F
                        F --> H{Consistency Check}
                        H -->|Pass| I[Final Output]
                        H -->|Fail| J[Consistency Fixer]
                        J --> H
                        style B fill:#FF8000,color:#fff
                        style E fill:#FF8000,color:#fff
                        style H fill:#FF8000,color:#fff
PageOn.ai's agentic capabilities have revolutionized my workflow design process. The platform can analyze my data cleaning needs and suggest optimized workflows that incorporate best practices I might not have considered.

Case Studies: Successful Data Transformation Projects
I've witnessed remarkable transformations when organizations implement automated data cleaning. These real-world examples demonstrate the power of moving from manual to automated approaches.
Financial Reporting: From Messy Transactions to Clear Insights
A financial services firm was struggling with reconciling transaction data from multiple systems. Their manual process took 3 full days each month and still contained errors.
Challenge: Inconsistent transaction codes, missing entries, and format variations across systems.
Solution: Implemented automated cleaning workflow with:
- Custom code standardization functions
- Pattern-based transaction matching
- Statistical anomaly detection for outliers
Result: Reconciliation time reduced to 2 hours with 99.8% accuracy, enabling faster financial close and improved decision-making.
Marketing Analytics: Cleaning Campaign Data
A marketing team was unable to accurately attribute conversions due to inconsistent tracking data across multiple channels and campaigns.
Challenge: Duplicate leads, inconsistent UTM parameters, and timezone discrepancies.
Solution: Created an automated pipeline that:
- Standardized campaign naming conventions
- Resolved duplicate leads using fuzzy matching
- Normalized timestamps across data sources
Result: 43% improvement in attribution accuracy, revealing previously hidden high-performing channels.
Operations Management: Supply Chain Data
A manufacturing company was experiencing inventory discrepancies and fulfillment delays due to poor data quality across their supply chain.
Challenge: Inconsistent product codes, unit measurement discrepancies, and timing misalignments.
Solution: Implemented automated data transformation that:
- Created a unified product taxonomy
- Standardized unit measurements across systems
- Synchronized timing data with automated adjustments
Result: 62% reduction in inventory discrepancies and 3-day improvement in average fulfillment time.
Using PageOn.ai to visualize the before/after transformation results has been particularly effective in these projects. The platform's ability to create clear, compelling visual comparisons helps stakeholders immediately grasp the impact of the data cleaning efforts.
Advanced Google Sheets Tips for Data Cleaning
While Excel has traditionally dominated the spreadsheet world, Google Sheets offers some unique advantages for data cleaning. I've compiled some of my favorite Google Sheets tips specifically for data transformation tasks.
Leveraging Google Sheets' Unique Functions
| Function | Use Case | Example |
|---|---|---|
| IMPORTDATA | Automatically import CSV data from URLs | =IMPORTDATA("https://data.csv") |
| IMPORTXML | Scrape and import structured web data | =IMPORTXML(A1,"//div[@class='data']") |
| QUERY | SQL-like data manipulation | =QUERY(A1:D100,"SELECT A,B WHERE D>50") |
| SPLIT | Divide text into columns by delimiter | =SPLIT(A2,",") |
| REGEXEXTRACT | Extract patterns using regex | =REGEXEXTRACT(A2,"(\d{3})-(\d{3}-\d{4})") |
Cloud-Based Collaboration for Team Data Cleaning
Google Sheets excels at collaborative data cleaning:
- Real-time collaboration with multiple team members working simultaneously
- Comment threads for discussing specific data issues
- Version history to track changes and revert if needed
- Named ranges for clearer formula references across team members
Google Sheets Integration Ecosystem
                    flowchart TB
                        A[Google Sheets] --> B[Google Forms]
                        A --> C[Google Data Studio]
                        A --> D[Google Apps Script]
                        D --> E[Custom Functions]
                        D --> F[Time-based Triggers]
                        D --> G[API Integrations]
                        A --> H[BigQuery]
                        A --> I[Machine Learning APIs]
                        style A fill:#FF8000,color:#fff
Building Automated Data Pipelines
Google Sheets enables powerful automation through Apps Script:
- Scheduled data imports from external sources
- Automated email notifications about data quality issues
- Custom sidebar tools for specialized cleaning operations
- Integration with Google's machine learning services for advanced cleaning
Comparing Excel and Google Sheets
The choice between Excel and Google Sheets often depends on your specific needs:
- Choose Excel when: You need to process very large datasets, require advanced statistical functions, or work with sensitive data that can't be cloud-hosted
- Choose Google Sheets when: Real-time collaboration is essential, you need web-based data integration, or you want to build automated workflows without complex macro development
Future-Proofing Your Data Management Strategy
As data volumes grow and business requirements evolve, it's essential to build data cleaning systems that can scale and adapt. I've found that forward-thinking approaches to data management pay dividends as organizations mature.
Emerging Technologies in Automated Data Preparation
Federated Learning
Training cleaning models across distributed datasets without centralizing sensitive data
Explainable AI
Cleaning algorithms that provide clear rationales for their decisions and corrections
Synthetic Data Generation
Creating artificial training data to improve cleaning models without privacy concerns
Automated ML Pipeline Optimization
Systems that continuously improve cleaning workflows based on results
Generating Reports for Ongoing Monitoring
Generating excel reports with AI tools enables continuous monitoring of data quality metrics. These automated reports can track:
Building Scalable Data Cleaning Systems
As your datasets grow, your cleaning systems need to scale accordingly:
- Modular design that allows components to be upgraded independently
- Distributed processing capabilities for very large datasets
- Configurable cleaning rules that can be adjusted without code changes
- Performance monitoring to identify and address bottlenecks
Adapting to Changing Requirements
Data quality requirements evolve over time, requiring flexible systems:
                    flowchart LR
                        A[Requirement Changes] --> B{Impact Assessment}
                        B --> C[Rule Configuration Update]
                        B --> D[Pipeline Modification]
                        B --> E[New Validation Metrics]
                        C --> F[Testing]
                        D --> F
                        E --> F
                        F -->|Pass| G[Deployment]
                        F -->|Fail| H[Refinement]
                        H --> F
                        style A fill:#FF8000,color:#fff
                        style G fill:#FF8000,color:#fff
PageOn.ai's Evolving Capabilities
I've been impressed by how PageOn.ai continues to evolve its data management capabilities. The platform's commitment to innovation ensures that as data challenges grow more complex, the tools to address them become more sophisticated.
Key areas where PageOn.ai is advancing data management include:
- Intelligent pattern recognition that learns from your specific data
- Cross-dataset relationship mapping to maintain consistency
- Natural language interfaces for data cleaning operations
- Predictive quality management that anticipates future data issues

Transform Your Visual Expressions with PageOn.ai
Ready to turn your complex spreadsheet data into clear, compelling visualizations? PageOn.ai's powerful AI tools can help you clean, transform, and present your data in ways that drive understanding and decision-making.
Start Creating with PageOn.ai TodayYou Might Also Like
Revolutionizing Market Entry Presentations with ChatGPT and Gamma - Strategic Impact Guide
Learn how to leverage ChatGPT and Gamma to create compelling market entry presentations in under 90 minutes. Discover advanced prompting techniques and visual strategies for impactful pitches.
Mastering Visual Harmony: The Art and Science of Cohesive Slide Layouts
Discover how to create visually harmonious slide layouts through color theory, typography, and spatial design. Learn professional techniques to elevate your presentations with PageOn.ai.
Beyond Bullet Points: Transform Your Text with Animated Visuals | PageOn.ai
Discover how to transform static bullet points into dynamic animated visuals that boost engagement by 40%. Learn animation fundamentals, techniques, and AI-powered solutions from PageOn.ai.
Transform Your Presentations: Mastering Slide Enhancements for Maximum Impact
Learn how to elevate your presentations with effective slide enhancements, formatting techniques, and visual communication strategies that captivate audiences and deliver powerful messages.