Creating Dynamic LLM Comparison Presentations with Model Context Protocol
A visual guide to building effective presentations that showcase LLM capabilities through standardized protocols
Understanding the Model Context Protocol Landscape
I've spent countless hours working with different LLM integration approaches, and I can confidently say that the Model Context Protocol (MCP) represents a paradigm shift in how we connect AI models to external data sources and tools. Let me walk you through why this matters for creating compelling presentations.
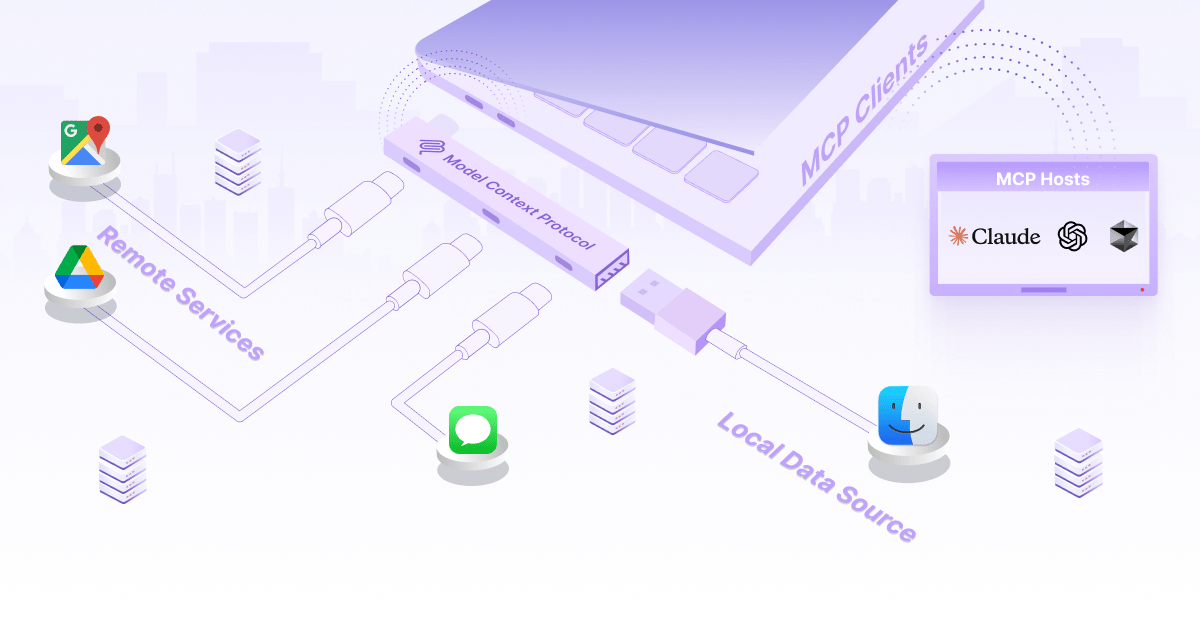
MCP serves as the "USB-C port" for AI applications, standardizing connections between models and data sources
MCP elegantly solves what's known as the N×M integration problem in the LLM ecosystem. Before MCP, each LLM application (N) needed to build separate connectors for each data source or tool (M), resulting in N×M custom integrations. This created massive technical debt with "custom adapters everywhere" and kept models stuck in silos of static knowledge.
The N×M Integration Problem vs. MCP Solution
Before MCP, each application needed custom connectors for each data source. With MCP, everyone speaks one common protocol.
                    flowchart TD
                        subgraph "Before MCP"
                            A1[LLM App 1] --> B1[Custom Connector]
                            A1 --> B2[Custom Connector]
                            A1 --> B3[Custom Connector]
                            A2[LLM App 2] --> C1[Custom Connector]
                            A2 --> C2[Custom Connector]
                            A2 --> C3[Custom Connector]
                            B1 --> D1[Data Source 1]
                            B2 --> D2[Data Source 2]
                            B3 --> D3[Data Source 3]
                            C1 --> D1
                            C2 --> D2
                            C3 --> D3
                        end
                        subgraph "With MCP"
                            E1[LLM App 1] --> F[MCP]
                            E2[LLM App 2] --> F
                            F --> G1[Data Source 1]
                            F --> G2[Data Source 2]
                            F --> G3[Data Source 3]
                        end
At its core, MCP uses a simple client-server architecture. The MCP client—typically the LLM or AI agent—sends JSON-formatted requests to MCP servers, which act as wrappers around real data sources or tools. This standardized communication protocol eliminates the need for custom integrations for each new combination of LLM and data source.
Key Distinction: Function Calling vs. MCP
While function calling allows LLMs to execute specific functions, MCP builds on this foundation by standardizing how AI applications talk to tools and data sources. MCP doesn't replace function calling—it enhances it by creating a universal communication protocol.
The MCP architecture consists of three main components that work together to create a seamless integration experience:
MCP Architecture Components
                    flowchart LR
                        A[MCP Client] -->|Requests context| B[MCP Protocol]
                        B -->|Standardized format| C[MCP Server]
                        C -->|Provides data/executes tools| D[External Services]
                        D -->|Returns results| C
                        C -->|Structured response| B
                        B -->|Contextual information| A
When creating presentations that compare different LLM implementations, understanding this architecture is crucial. It allows you to accurately represent how different models interact with external data and tools, and how MCP standardizes these interactions across the ecosystem.
Structuring Effective LLM Comparison Frameworks
When I'm building presentations that compare different LLM implementations, I've found that having a structured framework is essential. The right visual structure makes complex technical comparisons accessible and meaningful to diverse audiences.

Standardized evaluation criteria template for comparing multiple LLM implementations
Creating standardized evaluation criteria is the first step in building effective comparison presentations. I recommend focusing on metrics that matter most to your specific use case, while ensuring consistency across all models being evaluated.
LLM Performance Comparison Across Key Metrics
This radar chart visualizes how different LLMs perform across six critical evaluation metrics.
Side-by-side capability matrices are another powerful tool for highlighting the strengths and limitations of each model. These matrices allow stakeholders to quickly identify which model best suits their specific requirements.
| Capability | Model A | Model B | Model C |
|---|---|---|---|
| MCP Support | ✅ Full | ⚠️ Partial | ✅ Full |
| Context Window | 128K tokens | 32K tokens | 64K tokens |
| Function Calling | ✅ Advanced | ✅ Advanced | ⚠️ Basic |
| Tool Integration | ✅ Extensive | ✅ Extensive | ⚠️ Limited |
| Enterprise Security | ✅ SOC2, GDPR | ✅ SOC2, HIPAA | ⚠️ SOC2 only |
When designing the information architecture for your presentations, it's important to balance technical details with visual clarity. I typically use a layered approach, where high-level comparisons are presented first, with the ability to drill down into specific technical details as needed.
PageOn.ai Integration Tip
I've found that PageOn.ai's AI Blocks feature is perfect for organizing complex comparison data into modular, visual components. This allows me to create presentations where technical details are visually digestible and can be rearranged based on the specific audience's needs.
Remember, the goal of your comparison framework isn't just to present data—it's to facilitate decision-making. Design your visual frameworks with this end goal in mind, highlighting the factors that will most impact the selection process for your specific use case.
Building the MCP Data Flow Visualization Layer
One of the most challenging aspects of presenting Model Context Protocol concepts is transforming abstract technical interactions into clear visual narratives. I've developed several approaches to make these complex data flows understandable to both technical and non-technical audiences.
Animated sequence diagram showing how context flows between an LLM and external services
The client-server interaction in MCP follows a specific pattern that can be visualized effectively through sequence diagrams. Let's break down this flow step by step:
MCP Client-Server Interaction Flow
                    sequenceDiagram
                        participant User
                        participant App as Host Application
                        participant LLM
                        participant MCP as MCP Client
                        participant Server as MCP Server
                        participant Service as External Service
                        User->>App: Makes request
                        App->>LLM: Sends user query
                        LLM->>LLM: Determines need for external data
                        LLM->>App: Requests external context
                        App->>MCP: Initiates MCP request
                        MCP->>Server: Sends standardized JSON request
                        Server->>Service: Calls external service API
                        Service->>Server: Returns data
                        Server->>MCP: Returns structured JSON response
                        MCP->>App: Delivers formatted context
                        App->>LLM: Provides context to model
                        LLM->>App: Generates informed response
                        App->>User: Delivers final response
MCP servers expose three types of services to clients, each with distinct purposes and visual representations:
Context Services
Provide additional information to enhance the LLM's understanding (e.g., retrieving documents or database records)
Tool Services
Enable the LLM to perform actions (e.g., sending emails, updating records, or performing calculations)
Authentication Services
Manage user permissions and access control for secure interactions with external systems
When comparing traditional integration methods with MCP approaches, visual charts can effectively highlight the differences in complexity, maintenance requirements, and scalability:
Traditional vs. MCP Integration Comparison
This chart compares key metrics between traditional custom integrations and MCP-based approaches.
PageOn.ai Integration Tip
I regularly use PageOn.ai's model context protocol data flow visualization tools to create dynamic diagrams that illustrate how data moves between LLMs and external services. The Deep Search feature has been particularly valuable for finding relevant technical diagrams that I can adapt for my specific presentation needs.
When creating MCP data flow visualizations, focus on clarity and consistency. Use a consistent color scheme to represent different components (client, server, external services), and ensure that the flow of information is clearly indicated through directional arrows and sequential numbering where appropriate.
Designing Interactive Model Selection Decision Trees
Choosing the right LLM implementation for a specific use case can be complex. I've found that visual decision trees are an effective way to guide stakeholders through this selection process, helping them navigate the tradeoffs between different models.

Interactive decision tree for LLM model selection based on specific requirements
When structuring decision frameworks for LLM selection, I start by identifying the key factors that will influence the decision. These typically include:
- Context window requirements
- Performance and latency constraints
- Integration complexity with existing systems
- Budget considerations
- Security and compliance requirements
- Specific capability needs (e.g., multimodal support, function calling)
LLM Selection Decision Tree
                    flowchart TD
                        Start([Start Selection]) --> Q1{Enterprise-grade
security needed?}
                        Q1 -->|Yes| Q2{Budget
constraints?}
                        Q1 -->|No| Q3{Large context
window needed?}
                        Q2 -->|High| Q4{MCP support
required?}
                        Q2 -->|Low| ModelA[Model A]
                        Q3 -->|Yes| Q5{Real-time
response needed?}
                        Q3 -->|No| ModelC[Model C]
                        Q4 -->|Yes| ModelA[Model A]
                        Q4 -->|No| ModelB[Model B]
                        Q5 -->|Yes| ModelB[Model B]
                        Q5 -->|No| ModelD[Model D]
                        ModelA --> End([Final Selection])
                        ModelB --> End
                        ModelC --> End
                        ModelD --> End
Comparative benchmarking visuals can help stakeholders understand the performance tradeoffs between different models. These visualizations should focus on metrics that are most relevant to the specific use case.
LLM Performance Benchmarks
This chart compares response times across different models with varying context lengths.
Interactive elements in your presentations can allow stakeholders to explore the tradeoffs between different models in real-time. This might include sliders to adjust parameters, toggles to enable/disable features, or dropdown menus to select specific use cases.
PageOn.ai Integration Tip
I've had great success using PageOn.ai's Vibe Creation feature to transform technical decision criteria into engaging visual frameworks. This tool helps me create decision trees that are not only functional but also visually appealing, making complex technical decisions more accessible to non-technical stakeholders.
Remember that the goal of your decision tree is to simplify the selection process, not complicate it. Focus on the most important decision factors for your specific context, and design your visualizations to guide stakeholders toward the optimal choice for their needs.
Crafting Implementation Roadmap Visualizations
After selecting an LLM implementation, the next challenge is planning the implementation process. Well-designed roadmap visualizations can help stakeholders understand the steps involved, timeline expectations, and resource requirements.

Step-by-step implementation roadmap for MCP integration with timeline and key milestones
When designing step-by-step visual guides for implementing MCP with different LLM providers, I focus on creating clear, sequential diagrams that outline each phase of the implementation process.
MCP Implementation Process
                    flowchart TD
                        Start([Start Implementation]) --> A[Select MCP-compatible client]
                        A --> B[Configure MCP servers]
                        B --> C[Develop adapter layers for existing services]
                        C --> D[Implement authentication mechanisms]
                        D --> E[Create context services]
                        E --> F[Develop tool services]
                        F --> G[Test integrations]
                        G --> H[Deploy to staging]
                        H --> I[Performance optimization]
                        I --> J[Security review]
                        J --> K[Production deployment]
                        K --> End([Implementation Complete])
                        style Start fill:#FF8000,color:white
                        style End fill:#FF8000,color:white
Timeline-based implementation plans help stakeholders understand the expected duration of each phase and the dependencies between different tasks. These visualizations should include key milestones and decision points.
MCP Implementation Timeline
This Gantt-style chart shows the timeline for a typical MCP implementation project.
Common integration challenges should be visualized alongside their solutions. These before/after comparisons can help stakeholders understand potential obstacles and how they can be overcome.
Challenge: Authentication Complexity
Before: Each integration requires custom authentication logic, creating security risks and maintenance overhead.
After: MCP's standardized authentication services provide consistent, secure access across all integrations.
Challenge: Schema Inconsistency
Before: Different data sources return information in inconsistent formats, requiring custom parsing logic.
After: MCP standardizes response formats, ensuring consistent data structure across all integrations.
Resource allocation frameworks help stakeholders understand the personnel and budget requirements for MCP implementation projects. These visualizations should break down resource needs by phase and skill set.
PageOn.ai Integration Tip
I've found that PageOn.ai's AI Blocks are perfect for building modular implementation roadmaps. This allows me to create customizable roadmap templates that can be easily adapted for different projects and teams, saving significant time in the planning process.
When creating implementation roadmaps, always include contingency plans and alternative paths. This helps stakeholders prepare for potential challenges and ensures that the implementation process remains flexible enough to adapt to changing requirements or unexpected obstacles.
Demonstrating Real-World MCP Applications
Case studies and real-world examples are powerful tools for illustrating the practical benefits of MCP implementation. I've found that visualizing these examples helps stakeholders understand how abstract technical concepts translate to tangible business value.
Before/after comparison showing integration improvements with MCP in a financial services application
When showcasing case studies of successful MCP implementations, I focus on industries where complex integrations are common, such as:
- Financial services (integrating market data, customer information, and regulatory compliance)
- Healthcare (connecting patient records, research data, and treatment protocols)
- E-commerce (linking inventory systems, customer data, and marketing platforms)
- Enterprise software (bridging disparate internal systems and external services)
MCP Implementation Results Across Industries
This chart shows the impact of MCP implementation on key metrics across different industries.
Before/after scenarios are particularly effective for highlighting the practical benefits of MCP implementation. These comparisons should focus on key metrics such as:
Before MCP
- 12 weeks average integration time for new data sources
- 8 full-time developers required for integration maintenance
- 73% of developer time spent on custom connector updates
- Average of 9 days to implement API changes
After MCP
- 3 weeks average integration time for new data sources
- 2 full-time developers required for integration maintenance
- 24% of developer time spent on connector updates
- Average of 2 days to implement API changes
When creating visual narratives for case studies, I focus on telling a story that resonates with the specific challenges faced by the organization. This might include:
MCP Implementation Journey
                    flowchart TD
                        A[Challenge: Integration Complexity] --> B[Problem: N×M Custom Connectors]
                        B --> C[Solution: MCP Implementation]
                        C --> D[Step 1: MCP Client Setup]
                        D --> E[Step 2: Core Services Migration]
                        E --> F[Step 3: Legacy System Adapters]
                        F --> G[Results: 75% Faster Integrations]
                        G --> H[Benefits: Scalable Architecture]
                        H --> I[Future: Expanded Tool Ecosystem]
PageOn.ai Integration Tip
I've found great success using PageOn.ai's Agentic capabilities to transform technical case studies into compelling visual stories. This helps me create presentations that not only convey technical information but also tell a narrative that resonates with both technical and business stakeholders.
When comparing MCP to other integration approaches, focus on the specific advantages that MCP offers for the use case in question. This might include standardization benefits, reduced maintenance overhead, improved security, or enhanced flexibility.
Future-Proofing Your LLM Strategy with MCP
As the LLM ecosystem continues to evolve rapidly, organizations need to develop strategies that can adapt to changing technologies and requirements. MCP provides a foundation for future-proofing your LLM strategy, and effective visualizations can help stakeholders understand this long-term value.
Strategic planning framework for organizations adopting MCP as part of their LLM strategy
When developing visual forecasts for MCP adoption and ecosystem growth, I focus on key trends and indicators such as:
Projected MCP Ecosystem Growth
This chart shows the projected growth in MCP adoption and ecosystem components over the next five years.
Strategic planning frameworks help organizations develop a roadmap for MCP adoption that aligns with their broader AI and technology strategies. These frameworks should address key considerations such as:
- Phased implementation approach
- Resource allocation and skill development
- Integration with existing systems and processes
- Governance and security considerations
- Performance monitoring and optimization
Decision matrices are valuable tools for evaluating when to implement MCP versus alternative approaches. These matrices should consider factors such as:
| Factor | Use MCP When... | Consider Alternatives When... |
|---|---|---|
| Integration Complexity | Multiple LLMs need to connect to multiple data sources | Simple, one-to-one integration is sufficient |
| Development Timeline | Long-term strategy with focus on scalability | Rapid prototyping or short-term solution needed |
| Team Expertise | Team has experience with standardized protocols | Team is more familiar with custom integrations |
| Ecosystem Compatibility | Working with tools that already support MCP | Working with legacy systems with limited API support |
Visualizing integration pathways as the MCP ecosystem evolves helps stakeholders understand how their implementation strategy can adapt to future developments. These visualizations might include:
MCP Evolution Pathway
                    flowchart LR
                        A[Current State: Basic MCP Implementation] --> B[Phase 1: Core Service Migration]
                        B --> C[Phase 2: Legacy System Adapters]
                        C --> D[Phase 3: Enhanced Tool Services]
                        D --> E[Future Path 1: Multi-Model Orchestration]
                        D --> F[Future Path 2: Edge Computing Integration]
                        D --> G[Future Path 3: Federated Learning Support]
                        E --> H[Advanced AI Ecosystem]
                        F --> H
                        G --> H
PageOn.ai Integration Tip
I rely on PageOn.ai to transform abstract strategic concepts into clear visual roadmaps. The platform's ability to generate professional-quality visualizations from complex strategic planning frameworks has been invaluable for communicating long-term MCP adoption strategies to executive stakeholders.
When creating visualizations for future-proofing strategies, focus on flexibility and adaptability. The goal is to help stakeholders understand not just the current state of MCP, but how their implementation strategy can evolve as the ecosystem matures and new capabilities emerge.
Transform Your Visual Expressions with PageOn.ai
Create stunning LLM comparison presentations that clearly communicate complex technical concepts and drive informed decision-making.
Start Creating with PageOn.ai TodayConclusion: Elevating Your LLM Strategy with Visual Excellence
Throughout this guide, I've shared my approach to creating dynamic LLM comparison presentations using Model Context Protocol. By leveraging effective visualization techniques, you can transform complex technical concepts into clear, compelling visual narratives that drive informed decision-making.
The Model Context Protocol represents a significant advancement in how we integrate LLMs with external data sources and tools. By standardizing these integrations, MCP reduces development overhead, improves maintainability, and creates a more interoperable ecosystem where innovation benefits the entire community rather than remaining siloed.
As you develop your own LLM comparison presentations, remember that the goal is not just to present information, but to create visual frameworks that facilitate understanding and decision-making. Focus on clarity, consistency, and context, ensuring that your visualizations help stakeholders grasp both the technical details and the strategic implications of different LLM implementations.
Tools like logic model PowerPoint templates and ai presentation tools comparison resources can provide valuable starting points for your visualization efforts. For educational contexts, course presentation tools and stem presentation tools offer specialized features for technical content.
By combining the technical rigor of the Model Context Protocol with the visual clarity of well-designed presentations, you can create compelling narratives that not only explain LLM capabilities but also inspire stakeholders to envision new possibilities for AI integration in their organizations.
You Might Also Like
Stock Photos in Presentations: Bringing Vibrancy and Depth to Visual Storytelling
Discover how to transform your presentations with strategic stock photography. Learn selection techniques, design integration, and visual consistency to create compelling visual narratives.
The AI-Powered Pitch Deck Revolution: A Three-Step Framework for Success
Discover the three-step process for creating compelling AI-powered pitch decks that captivate investors. Learn how to clarify your vision, structure your pitch, and refine for maximum impact.
Mastering Visual Harmony: The Art and Science of Cohesive Slide Layouts
Discover how to create visually harmonious slide layouts through color theory, typography, and spatial design. Learn professional techniques to elevate your presentations with PageOn.ai.
Enhancing Audience Experience with Strategic Audio Integration | Create Immersive Brand Connections
Discover how strategic audio integration creates immersive brand connections across podcasts, streaming platforms, and smart speakers. Learn frameworks and techniques to transform your marketing.