Mastering Investor Communication: Evolving Your Fundraising Visuals from Angel to Series C
The Fundraising Journey: Understanding Stage-Specific Requirements
I've learned that successful fundraising isn't just about having a great idea—it's about communicating that idea effectively to the right investors at the right time. As your startup evolves from concept to scale, your visual communication strategy must evolve too. In this guide, I'll walk you through how to adapt your fundraising visuals for each investment stage.
The Fundraising Journey: Understanding Stage-Specific Requirements
In my years working with startups, I've noticed that founders often struggle to adapt their investor communications as they progress through funding stages. Each investment milestone—from Angel to Series C—requires a distinct approach to visual storytelling that aligns with investor expectations at that stage.
                    flowchart LR
                        A[Angel & Pre-Seed] -->|Evolution| B[Seed]
                        B -->|Expansion| C[Series A]
                        C -->|Scaling| D[Series B & C]
                        style A fill:#FFF5E6,stroke:#FF8000
                        style B fill:#FFF5E6,stroke:#FF8000
                        style C fill:#FFF5E6,stroke:#FF8000
                        style D fill:#FFF5E6,stroke:#FF8000
                        A --- A1[Vision & Problem]
                        A --- A2[Founder Story]
                        A --- A3[Market Opportunity]
                        B --- B1[Early Traction]
                        B --- B2[Customer Feedback]
                        B --- B3[Go-to-Market Plan]
                        C --- C1[Growth Metrics]
                        C --- C2[Unit Economics]
                        C --- C3[Scaling Strategy]
                        D --- D1[Market Dominance]
                        D --- D2[Operational Efficiency]
                        D --- D3[Exit Strategy]
Investor focus and expectations evolve significantly across funding stages
The fundamental shift I've observed is that early-stage investors (Angels and Pre-Seed) respond primarily to vision and potential, while later-stage investors (Series B and C) demand comprehensive data visualization showcasing scalability and market dominance. This progression isn't just about adding more slides to your deck—it requires a complete rethinking of your visual communication strategy.
Common Pitfalls in Fundraising Visuals
- Using the same pitch deck template across multiple funding rounds
- Overloading early-stage materials with complex projections
- Underdelivering on metrics visualization in later stages
- Inconsistent visual identity as the company grows
- Failing to visually address the specific concerns of each investor type
The psychological triggers that influence investors also shift dramatically. Angel investors often make decisions based on emotional connection to the vision and founder, while Series C investors need sophisticated visual frameworks that demonstrate clear paths to market dominance or exit. Understanding these psychological differences is crucial for creating effective visual materials.
Angel & Pre-Seed Stage: Visualizing Potential
At the earliest funding stages, I've found that the most successful fundraising materials focus on vision and potential rather than extensive data. This is where your ability to visually communicate your concept and market opportunity becomes critical.
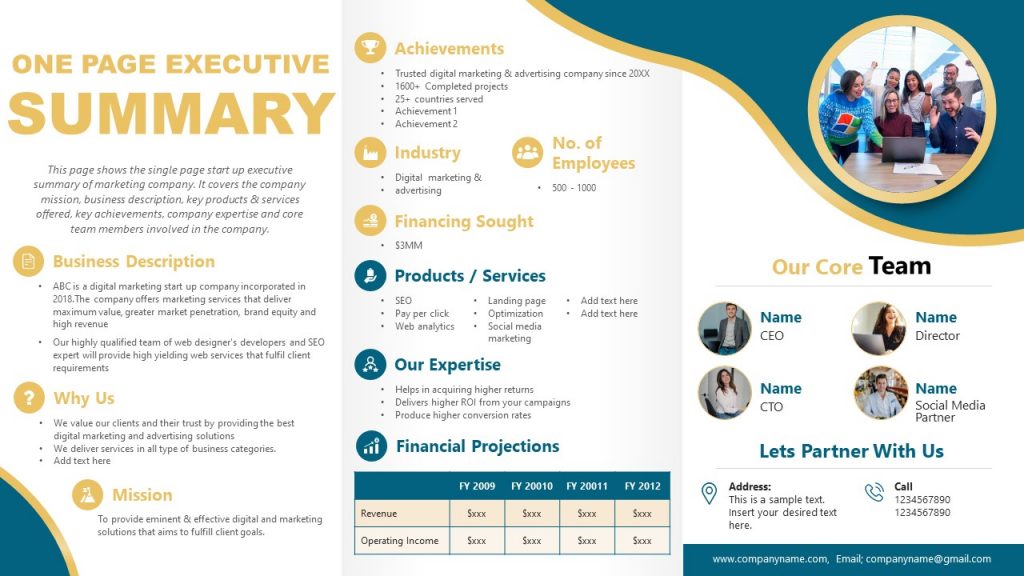
Example of an effective Angel-stage one-pager highlighting vision and founder credentials
When creating materials for Angel investors, I focus on simplicity and emotional impact. The goal is to create visual assets that capture imagination while building trust. At this stage, a well-designed startup one pager for investors often works better than an extensive deck.
Essential Visual Components for Angel Investors
Problem-Solution Visualization
I've found that simple before/after visuals or emotional journey maps that highlight user pain points create stronger connections with Angel investors than complex data charts.
Founder Credential Presentation
Visual elements that humanize founders while highlighting relevant experience build trust. Photos paired with simple achievement icons often work better than text-heavy bios.
Market Sizing Visualization
I use simplified infographics that convey market scale without overwhelming technical details. Visual metaphors often communicate scale more effectively than detailed TAM/SAM/SOM breakdowns.
Vision Timeline
Simple visual roadmaps that show key milestones help investors understand your thinking without requiring extensive operational details that may not yet exist.
When I work with early-stage founders, I recommend using PageOn.ai's Vibe Creation feature to quickly transform their passion into professional visuals. This tool helps maintain a consistent visual identity while creating materials that resonate emotionally with angel investors.
Pro Tip: Balancing Simplicity with Substance
While early-stage materials should be simple, they shouldn't be simplistic. I've found that using PageOn.ai's AI Blocks helps structure early-stage fundraising narratives with the right level of detail. This approach allows you to create visual hierarchies that highlight your most compelling points without overwhelming potential investors.
Seed Stage: Bridging Vision and Early Validation
The Seed stage represents a critical transition in your fundraising journey. In my experience, this is where your visual narrative needs to evolve to incorporate initial customer feedback and early traction while still maintaining the compelling vision that attracted your angel investors.
Comparison of investor focus areas between Angel and Seed stages
At the seed stage, I've observed that the most effective startup pitch deck materials strike a balance between vision and validation. This is where you begin introducing more structured visual elements while maintaining the emotional connection established in earlier materials.
Creating Effective Seed Stage Pitch Materials
                    flowchart TD
                        A[Problem Statement] --> B[Solution Overview]
                        B --> C[Early Traction Metrics]
                        C --> D[Customer Testimonials]
                        D --> E[Market Opportunity]
                        E --> F[Go-to-Market Strategy]
                        F --> G[Competition Analysis]
                        G --> H[Team & Advisors]
                        H --> I[Financial Projections]
                        I --> J[Funding Ask]
                        style A fill:#FFF5E6,stroke:#FF8000
                        style B fill:#FFF5E6,stroke:#FF8000
                        style C fill:#E3F2FD,stroke:#42A5F5
                        style D fill:#E3F2FD,stroke:#42A5F5
                        style E fill:#FFF5E6,stroke:#FF8000
                        style F fill:#E3F2FD,stroke:#42A5F5
                        style G fill:#E3F2FD,stroke:#42A5F5
                        style H fill:#FFF5E6,stroke:#FF8000
                        style I fill:#E3F2FD,stroke:#42A5F5
                        style J fill:#E3F2FD,stroke:#42A5F5
                        classDef orange fill:#FFF5E6,stroke:#FF8000
                        classDef blue fill:#E3F2FD,stroke:#42A5F5
Recommended slide sequence for Seed stage pitch decks (orange: vision elements, blue: validation elements)
When designing seed stage materials, I focus on creating slide sequences that tell a coherent story beyond individual metrics. This is where your ability to visually communicate your go-to-market strategy becomes increasingly important.
Visual Techniques for Seed Stage Materials
- Competitive Landscape Maps: I use 2x2 matrices or spectrum diagrams to visually position your startup against competitors while highlighting your unique advantage.
- Early Traction Dashboards: Simple visualizations of key metrics that show momentum without overcommitting to specific projections.
- Customer Journey Maps: Visual representations of how your solution addresses specific customer pain points.
- Team Expansion Visuals: Organizational charts that balance current capabilities with strategic hiring plans.
For nonprofit pitch deck creation or specialized sectors, I've found that PageOn.ai's Deep Search feature is invaluable for integrating relevant market data visualizations that strengthen your narrative. This helps maintain visual consistency across different investor materials while adapting to the specific needs of seed-stage investors.
Series A: Visualizing Traction and Growth Trajectory
Series A represents a fundamental shift in investor expectations. From my experience working with companies at this stage, I know that your visual materials must now demonstrate clear traction and a compelling growth trajectory. This is where data visualization becomes paramount.

Example of a Series A customer acquisition funnel visualization with key metrics
When creating Series A materials, I focus on transforming operational metrics into compelling visual narratives. The key is to show not just what has happened, but what it means for future growth. This approach is particularly important for investment banking pitch decks and other financially sophisticated presentations.
Metrics That Matter: Visual Presentation Strategies
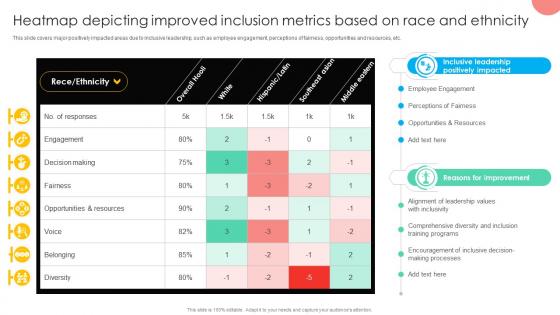
Key metrics Series A investors prioritize in fundraising materials
For Series A presentations, I recommend using PageOn.ai's AI Blocks to build sophisticated data visualization sequences. This allows you to create visual cohesion between historical performance and forward projections—a critical element for Series A investors who are primarily concerned with scaling potential.
Customer Journey Visualizations
I create detailed flow diagrams that highlight retention and engagement metrics at each stage, emphasizing opportunities for optimization and growth.
Market Expansion Frameworks
Visual frameworks that map adjacent markets or customer segments, with data-backed sizing and timing for each expansion opportunity.
Competitive Moat Diagrams
Visualizations that illustrate defensibility factors like network effects, proprietary technology, or data advantages with specific metrics attached to each.
Financial Model Visualizations
Interactive charts that transform complex financial models into intuitive visual stories, highlighting key drivers and sensitivity factors.
When developing a strategic sales plan visualization for Series A investors, I focus on showing not just the plan itself but the underlying unit economics that make it sustainable. This approach addresses the "scaling concerns" that Series A investors prioritize.
Series B & C: Communicating Scalability and Market Dominance
By Series B and C rounds, I've found that investor expectations shift dramatically toward scalability, market dominance, and potential exit strategies. Your visual materials must evolve to support larger fundraising amounts and satisfy sophisticated investors who will conduct extensive due diligence.
                    flowchart TD
                        A[Market Leadership Strategy] --> B[Multi-Product Roadmap]
                        A --> C[International Expansion]
                        A --> D[Operational Efficiency]
                        B --> E[Product 1 Growth]
                        B --> F[Product 2 Launch]
                        B --> G[Product 3 Development]
                        C --> H[Region 1 Metrics]
                        C --> I[Region 2 Strategy]
                        C --> J[Region 3 Timeline]
                        D --> K[Margin Improvements]
                        D --> L[Team Scaling]
                        D --> M[Technology Infrastructure]
                        style A fill:#FFF5E6,stroke:#FF8000
                        style B fill:#FFF5E6,stroke:#FF8000
                        style C fill:#FFF5E6,stroke:#FF8000
                        style D fill:#FFF5E6,stroke:#FF8000
Common structure for Series B/C investor materials showing scalability and market dominance
For later-stage fundraising, I focus on creating visual narratives that demonstrate operational efficiency and margin improvements. These materials must effectively communicate potential exit strategies or IPO roadmaps, which require sophisticated visual frameworks.
Advanced Visual Strategies for Later Stage Fundraising
Comparison of content emphasis between Series A and Series B/C fundraising materials
When creating materials for Series B and C rounds, I leverage PageOn.ai's Agentic capabilities to create professional-grade investor materials. This allows for consistent visual identity across extensive fundraising documents while handling the increased complexity these stages require.
Series B/C Visual Material Requirements
- Multi-Product Roadmaps: Visual timelines that illustrate how various products or services integrate and create compounding value.
- Organizational Scaling Diagrams: Visual representations of team growth plans with clear leadership hierarchies and departmental responsibilities.
- Regulatory Navigation Strategies: Flow charts or process diagrams that demonstrate understanding of complex regulatory environments and compliance strategies.
- Market Consolidation Maps: Visual frameworks that position your company within industry consolidation trends and highlight potential acquisition targets or partners.
- Exit Scenario Modeling: Visual decision trees or scenario analyses that illustrate potential exit paths and associated valuations.

Example of a Series B/C multi-product roadmap visualization
At this stage, maintaining visual consistency while managing extensive documentation becomes challenging. I've found that PageOn.ai helps maintain visual cohesion across investor decks, data rooms, and supporting materials—ensuring that your brand appears sophisticated and prepared for the intense scrutiny of later-stage investors.
Practical Implementation: Creating Stage-Appropriate Investor Materials
Now that we've explored the specific requirements for each funding stage, I want to share my process for auditing and evolving visual fundraising assets as your company grows. This systematic approach ensures your materials remain aligned with investor expectations at each stage.
                    flowchart TD
                        A[Audit Current Materials] --> B[Identify Stage-Specific Requirements]
                        B --> C[Create Visual Asset Inventory]
                        C --> D[Develop Core Visual Elements]
                        D --> E[Build Stage-Appropriate Templates]
                        E --> F[Implement Feedback System]
                        F --> G[Iterate Based on Investor Signals]
                        style A fill:#FFF5E6,stroke:#FF8000
                        style B fill:#FFF5E6,stroke:#FF8000
                        style C fill:#FFF5E6,stroke:#FF8000
                        style D fill:#FFF5E6,stroke:#FF8000
                        style E fill:#FFF5E6,stroke:#FF8000
                        style F fill:#FFF5E6,stroke:#FF8000
                        style G fill:#FFF5E6,stroke:#FF8000
Process flow for evolving fundraising visuals across investment stages
When helping clients implement this process, I start with a thorough audit of their existing materials. This includes assessing visual brand consistency, identifying gaps in their current narrative, and determining which elements need to evolve for their next funding stage.
Step-by-Step Implementation Process
- Audit Current Materials: Evaluate existing fundraising assets against stage-specific investor expectations. Identify strengths to maintain and weaknesses to address.
- Create Visual Asset Inventory: Catalog all visual elements (logos, color schemes, charts, diagrams, photos) to ensure consistency across updated materials.
- Develop Core Visual Elements: Create foundational visual components that can evolve across stages while maintaining brand identity.
- Build Stage-Appropriate Templates: Develop flexible templates for each investor material type that can be easily updated between funding rounds.
- Implement Feedback System: Create a structured approach for gathering and incorporating investor feedback on visual materials.
One of the biggest challenges I've encountered is maintaining visual brand consistency while evolving complexity. To address this, I recommend using PageOn.ai to rapidly iterate fundraising visuals based on investor feedback. The platform's ability to maintain consistent visual identity while adapting to different complexity levels is invaluable during this process.

Before/after comparison showing evolution of investor materials from Seed to Series A stage
I've seen numerous startups successfully evolve their visual materials through funding rounds. The key is approaching this evolution systematically rather than reactively. By anticipating the changing needs of investors at each stage, you can create materials that not only respond to current requirements but also lay groundwork for future fundraising efforts.
Measuring Success: Optimizing Investor Materials Through Feedback
The most effective fundraising visuals aren't created in isolation—they evolve through systematic feedback and optimization. I've developed several techniques for gathering and implementing investor feedback that have proven effective across funding stages.
Effectiveness ratings of different investor feedback collection methods
When implementing a feedback system, I recommend focusing on both qualitative feedback (direct investor comments) and quantitative metrics (engagement analytics). This combined approach provides a comprehensive view of how your materials are performing.
A/B Testing Strategies for Critical Fundraising Visuals
Effective A/B Testing Approaches
- Targeted Slide Testing: Create alternative versions of critical slides (problem statement, traction metrics, etc.) and track which versions generate more positive responses.
- Narrative Structure Testing: Test different story sequences to identify which flow generates better comprehension and engagement.
- Visual Style Comparisons: Compare different visualization approaches for the same data to determine which style resonates best with your target investors.
- Detail Level Optimization: Test varying levels of detail in key sections to find the optimal balance between comprehensiveness and clarity.
For digital materials, I create dashboards to track investor engagement with specific sections or slides. This data provides valuable insights into which parts of your narrative are most compelling and which might need refinement.
Example of an investor engagement analytics dashboard for fundraising materials
PageOn.ai's capabilities make it easy to quickly implement visual refinements based on investor signals. The platform's flexibility allows for rapid iteration without sacrificing visual quality or brand consistency—a critical advantage during active fundraising when quick adjustments can make the difference between securing a meeting and being overlooked.
Transform Your Fundraising Visuals with PageOn.ai
Ready to create compelling, stage-appropriate fundraising materials that resonate with investors? PageOn.ai provides the tools you need to develop professional-grade visual assets that evolve with your startup's journey—from angel investment to Series C and beyond.
Start Creating Investor-Ready Visuals TodayBy implementing these measurement and optimization strategies, you'll ensure your fundraising materials continuously improve and adapt to investor expectations. The most successful fundraisers I've worked with treat their investor materials as living documents that evolve not just between funding stages, but throughout the fundraising process itself.
You Might Also Like
Transform Your AI Results by Mastering the Art of Thinking in Prompts | Strategic AI Communication
Master the strategic mindset that transforms AI interactions from fuzzy requests to crystal-clear outputs. Learn professional prompt engineering techniques that save 20+ hours weekly.
Transforming Marketing Teams: From AI Hesitation to Strategic Implementation Success
Discover proven strategies to overcome the four critical barriers blocking marketing AI adoption. Transform your team from hesitant observers to strategic AI implementers with actionable roadmaps and success metrics.
Prompt Chaining Techniques That Scale Your Business Intelligence | Advanced AI Strategies
Master prompt chaining techniques to transform complex business intelligence workflows into scalable, automated insights. Learn strategic AI methodologies for data analysis.
Bridging Worlds: How Diffusion Models Are Reshaping Language Generation | PageOn.ai
Explore the revolutionary convergence of diffusion models and language generation. Discover how diffusion techniques are creating new paradigms for NLP, bridging visual and linguistic domains.