Transforming Investor Pitches: How to Create Captivating Live Product Demonstrations
Strategic approaches to showcase your product and secure investor confidence
In the competitive world of startup funding, your ability to demonstrate your product effectively can make the difference between securing investment or walking away empty-handed. I've found that mastering live demonstrations transforms ordinary pitches into compelling experiences that investors remember long after the meeting ends.
Strategic Value of Live Demonstrations
I've learned that live product demonstrations serve as powerful proof of concept that traditional pitch decks simply can't match. When I show my product in action rather than just talking about it, I create an immediate, tangible connection with investors that dramatically increases engagement and understanding.
The Psychology of Showing vs. Telling
There's a profound psychological difference between telling investors about your product and showing it in action. When I demonstrate my product live, I tap into multiple sensory channels, creating a more memorable and persuasive experience. According to my research, information retention increases by up to 65% when visual demonstration accompanies verbal explanation.
Information Retention by Presentation Method
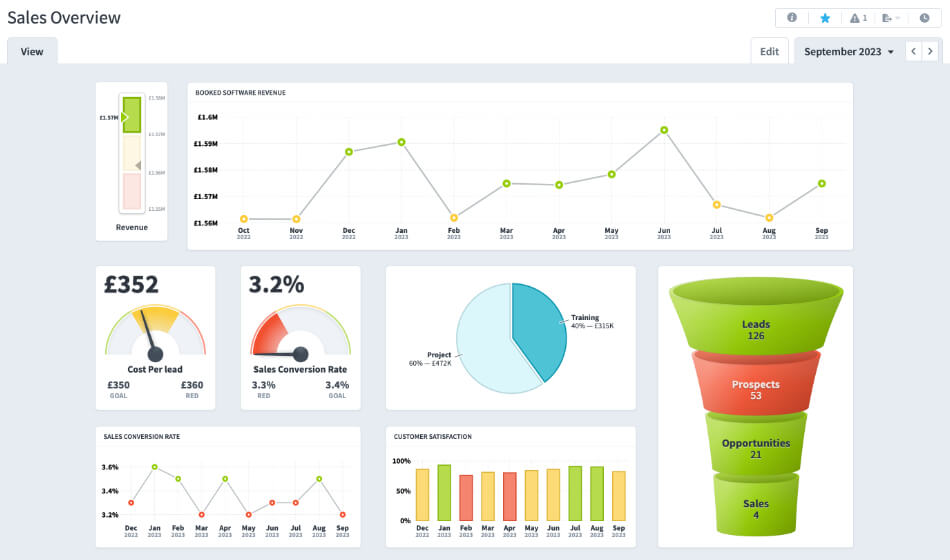
Key Metrics Investors Look For
During my demonstrations, I focus on highlighting metrics that matter most to investors. These typically include:
- User Experience Efficiency: How quickly and intuitively users can accomplish core tasks
- Technical Performance: Speed, responsiveness, and reliability of the product
- Scalability Indicators: How the product handles increased load or user base
- Competitive Advantages: Direct visual comparisons with competing solutions
- Market Readiness: Evidence that the product is ready for market deployment
Building Credibility Through Demonstration
I've found that live demonstrations build credibility in ways that claims and projections cannot. When I confidently navigate through my product, handling edge cases and potential issues in real-time, I establish trust and technical competence that resonates with investors.
Case Study: Dropbox's Famous Demo
When seeking initial funding, Dropbox founder Drew Houston created a simple 3-minute demonstration video showing the product in action. This demonstration was so effective that it increased signups from 5,000 to 75,000 overnight. More importantly, it helped secure crucial early-stage funding despite having no finished product to show investors in person.
I've learned that creating impactful product presentations requires a balance between technical demonstration and strategic storytelling. When these elements align, investors can more easily envision the market potential and return on investment.
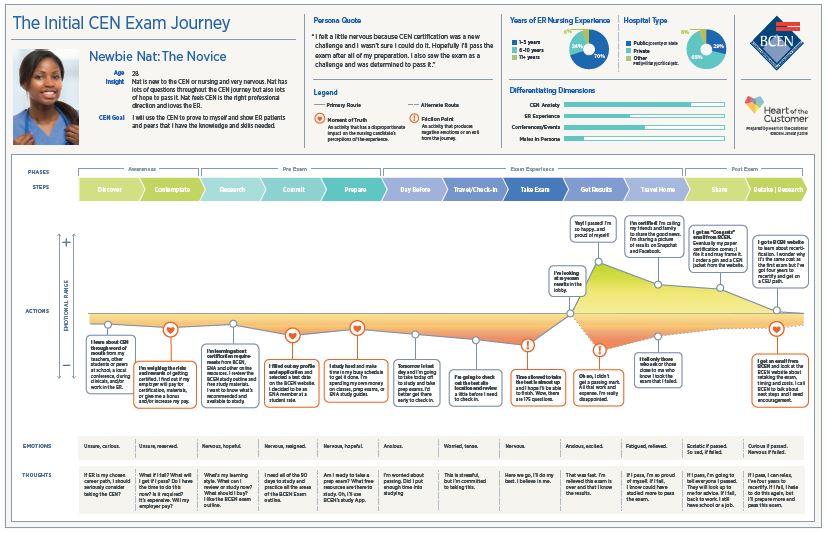
Pre-Demonstration Discovery Process
Before I even begin planning my demonstration, I invest significant time in understanding exactly who I'll be presenting to. This discovery process has proven crucial to tailoring demonstrations that resonate with specific investor interests.
flowchart TD
    A[Identify Investor Targets] --> B[Research Background & Portfolio]
    B --> C[Create Investor Personas]
    C --> D[Develop Pre-Meeting Questionnaire]
    D --> E[Analyze Responses]
    E --> F[Customize Demo Approach]
    F --> G[Set Clear Demo Objectives]
    G --> H[Map Features to Investor Priorities]
    style F fill:#FF8000,stroke:#333,stroke-width:1px
Researching Investor Priorities
I've developed a systematic approach to understanding what matters most to each investor before our meeting:
- Study their investment portfolio to identify patterns and preferences
- Review public statements, interviews, and articles by the investors
- Connect with founders they've previously funded for insights
- Analyze their typical investment stage and expected metrics
- Identify their industry-specific concerns and hot buttons
Creating Investor Personas
Just as marketers create customer personas, I develop detailed investor personas that help me tailor my demonstration approach. These profiles include:
| Persona Element | Description | Demo Application |
|---|---|---|
| Technical Background | Level of technical expertise and understanding | Adjust technical depth and terminology |
| Investment Philosophy | Risk tolerance, timeline expectations, growth vs. profit focus | Highlight metrics that align with their philosophy |
| Prior Investments | Pattern of previous successful investments | Draw parallels to previous successes |
| Decision Criteria | Known factors that influence their decisions | Structure demo to address these criteria directly |
| Communication Style | Preference for data-driven or narrative approaches | Balance storytelling and data visualization accordingly |
Pre-Meeting Questionnaires
When possible, I send a brief questionnaire to investors before our meeting. This helps me understand their specific interests and tailor my demonstration accordingly. My standard questionnaire includes:
- Which aspects of our product/market are you most interested in seeing demonstrated?
- What similar products or solutions have you evaluated recently?
- Are there specific use cases or scenarios you'd like to see addressed?
- Do you prefer high-level overviews or detailed technical demonstrations?
- What concerns or questions do you hope this demonstration will address?
Through this discovery process, I gather intelligence on competitors' demonstrations as well. Understanding what has worked (or failed) in similar pitches helps me differentiate my approach and address potential objections proactively. Creating engaging project presentations requires this level of strategic preparation.
Crafting a Narrative-Driven Demonstration Flow
I've found that the most compelling product demonstrations follow a clear narrative arc. Rather than simply showcasing features, I structure my demonstrations as stories that position my product as the hero solving real-world problems.
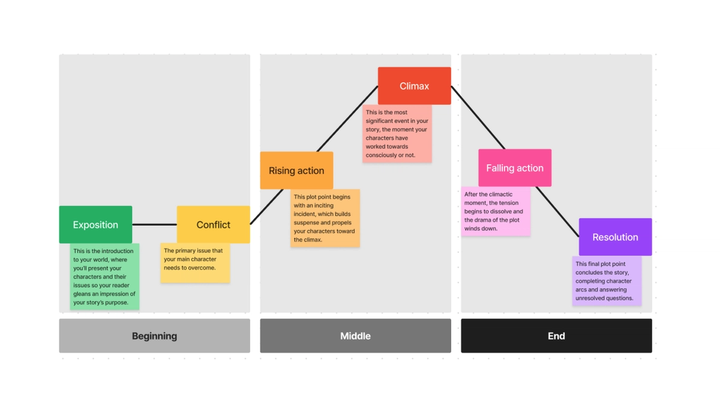
The Demonstration Story Arc
Every effective demonstration I create follows this narrative structure:
flowchart LR
    A[Problem Statement] --> B[Current Pain Points]
    B --> C[Solution Introduction]
    C --> D[Key Feature Demonstrations]
    D --> E[Real-World Application]
    E --> F[Results & Benefits]
    F --> G[Vision & Roadmap]
    style A fill:#FFE0CC,stroke:#333,stroke-width:1px
    style C fill:#FFAC66,stroke:#333,stroke-width:1px
    style F fill:#FF8000,stroke:#333,stroke-width:1px
Opening With a Powerful Problem Statement
I always begin my demonstrations by articulating a clear, compelling problem statement that resonates with investors. This establishes the "why" behind my product and creates immediate engagement. For example:
"Today, marketing teams waste an average of 14 hours per week manually generating reports from siloed data sources, resulting in $25,000 of lost productivity per employee annually. Let me show you how our solution eliminates this problem entirely."
Structuring Feature Demonstrations
When showcasing features, I organize them by investor priority rather than technical complexity. Each feature demonstration follows this micro-structure:
- Problem context: "When marketing teams need to analyze campaign performance..."
- Current solution limitations: "They typically export data to spreadsheets and manually create charts..."
- Our solution introduction: "Our AI-powered analytics dashboard instead..."
- Live demonstration: Showing the feature in action solving the specific problem
- Benefit reinforcement: "This reduces reporting time from hours to minutes and improves accuracy by 87%"
Incorporating Real-World Scenarios
Abstract features rarely impress investors. Instead, I frame my demonstrations within concrete scenarios that illustrate practical applications. For example:
Instead of: "Our platform has AI-powered data analysis capabilities."
I demonstrate: "Let me show you how a marketing director at a SaaS company used our AI analysis to identify an underperforming channel and reallocated budget to increase conversions by 32% within two weeks."
Using PageOn.ai's AI Blocks feature, I create a fluid, adaptable demonstration structure that allows me to navigate between different narrative paths based on investor reactions and questions. This ensures my demonstrations remain responsive to the specific interests that emerge during the meeting.
Finding creative presentation ideas that align with your narrative helps maintain investor engagement throughout the demonstration. The story structure makes technical features more memorable and meaningful.
Technical Preparation Essentials
I've learned through experience that technical glitches during investor demonstrations can undermine even the most promising products. My approach to technical preparation is methodical and exhaustive.

Creating Fail-Safe Environments
For every demonstration, I prepare multiple layers of redundancy:
- Isolated Demo Environment: A standalone version of the product that doesn't depend on external services or unstable features
- Local Backup: Offline version that runs entirely on my presentation device
- Pre-recorded Segments: High-quality video recordings of complex features that might be risky to demonstrate live
- Multiple Device Setup: Primary and backup devices ready to present
- Connectivity Alternatives: Options for both wired and wireless connections
Backup Plans for Different Scenarios
I develop contingency plans for common demonstration challenges:
Demo Risk Assessment & Contingency Planning
| Potential Issue | Primary Solution | Backup Plan |
|---|---|---|
| Internet connectivity failure | Mobile hotspot with tested connection | Offline version of demo with pre-loaded data |
| Software crash during demo | Streamlined version with minimal risk points | Quick-launch backup instance on secondary device |
| Feature not working as expected | Pre-tested feature with known inputs | Screen recording of feature working correctly |
| Projector/display compatibility issues | Multiple adapter options | Tablet version for small group viewing |
| Time constraints or interruptions | Modular demo segments that can be rearranged | Abbreviated version highlighting only key features |
Tools for Seamless Transitions
I utilize several tools to ensure smooth transitions between demonstration segments:
- Presentation Software: For structured navigation through demo segments
- Screen Management Tools: To manage multiple windows and applications
- Remote Control Systems: For controlling the demonstration from a distance
- Timer Applications: To maintain pace and timing
- Quick-Launch Shortcuts: For immediate access to backup plans
Rehearsal Techniques
My rehearsal process follows a progression that builds both confidence and flexibility:
- Technical Run-Through: Testing all features and transitions
- Timing Practice: Ensuring the demonstration fits the allotted time
- Script Refinement: Polishing explanations while keeping them natural
- Stress Testing: Deliberately creating problems to practice recovery
- Full Rehearsal: Complete run-through with colleagues playing investor roles
- Video Review: Recording and analyzing the rehearsal for improvements
Using PageOn.ai's Deep Search feature, I integrate relevant market data visualizations into my demonstrations. This allows me to pull up contextual information during the presentation that supports my narrative with credible, up-to-date market insights.
Incorporating techniques to elevate presentations with audio and visuals ensures a professional, polished demonstration experience that inspires investor confidence.
Visual Communication Mastery
I've found that the visual elements supporting my product demonstrations are just as important as the product itself. Strategic visual communication amplifies my message and helps investors grasp complex concepts quickly.
Designing Supportive Visuals
When creating visuals for my demonstrations, I follow these principles:
- Visual Hierarchy: Most important information receives visual prominence
- Whitespace Utilization: Breathing room that prevents cognitive overload
- Consistent Branding: Visual elements that reinforce product identity
- Data Visualization: Charts and graphs that tell a clear story
- Visual Metaphors: Imagery that makes abstract concepts tangible
Highlighting Key Features
I use several visual techniques to draw investor attention to critical features during demonstrations:
Visual Attention Techniques Effectiveness
I implement these attention-directing techniques in my demonstrations:
- Spotlight Effect: Dimming the screen except for the feature being highlighted
- Motion Cues: Subtle animations that draw the eye to important elements
- Color Contrast: Using accent colors to make key features stand out
- Progressive Disclosure: Revealing interface elements only as they become relevant
- Visual Annotations: Adding explanatory callouts to complex features
Balancing Visual Elements
Creating effective balance between text, imagery, and live demonstration requires careful planning:
flowchart TD
    A[Visual Planning] --> B{Element Type}
    B -->|Text| C[Keep Minimal]
    B -->|Images| D[Support Not Replace]
    B -->|Live Demo| E[Center Stage]
    C --> F[Use for Context]
    C --> G[Highlight Key Points]
    D --> H[Conceptual Clarity]
    D --> I[Data Visualization]
    E --> J[Feature Showcase]
    E --> K[Interactive Elements]
    style E fill:#FF8000,stroke:#333,stroke-width:1px
Color Psychology in Demonstrations
I strategically use color to evoke specific emotional responses during my demonstrations:
| Color | Psychological Effect | Application in Demonstrations |
|---|---|---|
| Blue | Trust, stability, professionalism | Security features, reliability metrics, data protection |
| Orange | Energy, enthusiasm, creativity | Call-to-action elements, innovation highlights |
| Green | Growth, prosperity, environmental responsibility | Profit metrics, sustainability features, success indicators |
| Purple | Luxury, sophistication, creativity | Premium features, advanced capabilities |
| Gray | Neutrality, formality, sophistication | Background elements, supporting information |
Using PageOn.ai's Vibe Creation feature, I transform complex product features into clear visuals that immediately communicate value. This tool has been particularly helpful for creating consistent visual themes that tie my entire demonstration together while making technical concepts accessible.
Looking at corporate presentation examples has helped me refine my visual approach to create more impactful demonstrations that resonate with investors' expectations.
Handling the Interactive Component
I've learned that the most memorable demonstrations actively involve investors rather than merely presenting to them. Managing this interactive component requires careful planning and adaptability.
Encouraging Meaningful Participation
I use several techniques to transform passive observers into active participants:
- Strategic Questions: "How would this feature impact your current workflow?"
- Decision Points: "Would you prefer to see how this handles scenario A or B?"
- Hands-On Opportunities: "Would anyone like to try this feature themselves?"
- Personalized Examples: "Let me show how this would work with your specific industry data"
- Problem-Solving Moments: "What challenge might this feature help you solve?"
Preparing for Common Questions
Based on my experience, I prepare thoroughly for these frequently asked investor questions:
| Question Category | Example Questions | Demonstration Response |
|---|---|---|
| Scalability | "How does this handle 10x the current load?" | Show load testing results or architecture diagrams |
| Competitive Advantage | "How is this better than [Competitor X]?" | Side-by-side feature comparison or unique capability demo |
| Technical Limitations | "What doesn't this do well?" | Honest assessment with roadmap for improvements |
| Integration Capabilities | "Does this work with our existing systems?" | API demonstration or integration example |
| Revenue Model | "How exactly does this generate revenue?" | Show pricing tiers or monetization features in action |
Creating "Wow Moments"
I strategically design demonstration elements specifically to create memorable "wow moments" that investors will remember:
- Unexpected Capabilities: Features that solve problems investors didn't know they had
- Speed Demonstrations: Showing how my product accomplishes in seconds what typically takes hours
- Personalized Insights: Generating real-time, relevant insights about the investor's specific industry
- Behind-the-Scenes Access: Briefly showing sophisticated technology that powers simple interfaces
- Future Vision: A carefully selected glimpse of upcoming features or capabilities
Managing Time Effectively
Balancing structured demonstration with organic interaction requires careful time management:
flowchart TD
    A[60-Minute Meeting] --> B[5min: Opening & Problem Statement]
    A --> C[20min: Core Demonstration]
    A --> D[15min: Interactive Exploration]
    A --> E[10min: Q&A]
    A --> F[5min: Next Steps & Close]
    C --> G[Must-See Features]
    C --> H[Key Differentiators]
    D --> I[Investor-Directed Exploration]
    D --> J[Depth on Areas of Interest]
    style D fill:#FF8000,stroke:#333,stroke-width:1px
Handling Technical Issues
When technical issues arise during demonstrations, I follow these steps:
- Acknowledge Calmly: "Let me address this quickly"
- Provide Context: "This sometimes happens when..."
- Implement Solution: Apply the prepared backup plan
- Redirect Attention: "While that's resolving, let me show you..."
- Extract Value: "This actually demonstrates our resilience process..."
The interactive component of demonstrations offers invaluable real-time feedback on which aspects of my product resonate most with investors. I carefully note these reactions to refine both my product and future demonstrations.
Post-Demonstration Follow-Up Strategy
I've found that what happens after the demonstration is just as important as the demonstration itself. A strategic follow-up process maintains momentum and moves investors toward commitment.

Creating Compelling Leave-Behind Materials
I prepare comprehensive leave-behind materials that extend the demonstration experience:
- Executive Summary: One-page overview of key demonstration highlights
- Feature Deep Dives: Detailed explanations of features that generated the most interest
- Custom ROI Calculator: Tool for investors to model potential returns based on their specific parameters
- Technical Architecture Document: For technically-minded investors who want to understand the underlying structure
- Access to Demo Environment: Limited-time access to a sandbox version of the product
- Video Recaps: Short video summaries of key demonstration moments
Addressing Unanswered Questions
My systematic approach to handling questions that arise during or after demonstrations:
flowchart LR
    A[Document Questions] --> B{Categorize}
    B --> C[Technical]
    B --> D[Business]
    B --> E[Strategic]
    C --> F[Technical Team Response]
    D --> G[Business Team Response]
    E --> H[Leadership Response]
    F --> I[Consolidated Follow-up]
    G --> I
    H --> I
    I --> J[24-Hour Response]
    J --> K[Schedule Next Interaction]
    style J fill:#FF8000,stroke:#333,stroke-width:1px
Gathering Feedback
I use a structured process to collect and analyze investor feedback after demonstrations:
- Immediate Debrief: Capturing fresh impressions from team members who attended
- Formal Survey: Short, focused questions sent to investors within 24 hours
- Follow-up Call: Brief conversation specifically to gather feedback
- Feedback Analysis: Systematic review of all input to identify patterns
- Action Items: Specific improvements for product and future demonstrations
Investor Feedback Categories After Demonstrations
Establishing Next Steps
I always conclude the follow-up process with clear next steps to maintain momentum:
- Scheduled Deep Dive: Focused meeting on areas of greatest interest
- Technical Validation: Session with technical stakeholders to validate architecture
- Customer Introduction: Connecting investors with existing customers
- Market Analysis Review: Sharing detailed market research relevant to investor interests
- Term Sheet Discussion: When appropriate, moving to investment specifics
The insights gathered during demonstrations and follow-up conversations often lead to valuable product refinements. I systematically incorporate this feedback into our development roadmap, creating a virtuous cycle of improvement.
Measuring Demonstration Effectiveness
To continuously improve my demonstration approach, I've developed a comprehensive framework for measuring effectiveness. This data-driven approach helps me refine both my product and presentation strategies.
Key Performance Indicators
I track these specific KPIs to evaluate demonstration success:
| KPI | Measurement Method | Target Benchmark |
|---|---|---|
| Progression Rate | % of demos that lead to next meeting | ≥ 80% |
| Question Engagement | # of investor questions during demo | ≥ 5 substantive questions |
| Feature Interest Concentration | % of questions about specific features | Balanced across 3+ features |
| Technical Issue Rate | # of technical problems per demo | ≤ 1 minor issue, 0 major issues |
| Time-to-Decision | Days from demo to investment decision | ≤ 21 days |
Tracking Engagement
I use several tools and techniques to measure investor engagement during and after demonstrations:
- Attention Mapping: Noting when investors lean in, take notes, or show increased focus
- Question Analysis: Tracking the quantity, quality, and focus areas of investor questions
- Follow-up Engagement: Measuring open rates and response times to post-demo materials
- Feature Interest: Recording which features generate the most discussion and questions
- Meeting Length: Whether investors extend beyond scheduled time (positive indicator)
Demonstration Effectiveness Metrics
A/B Testing for Demonstrations
I systematically test different demonstration approaches to identify the most effective techniques:
- Feature Sequence Testing: Comparing different orders of feature presentation
- Narrative Approach Testing: Problem-first vs. solution-first framing
- Technical Depth Testing: Surface-level vs. deep technical explanations
- Interactive Element Testing: Different methods of encouraging investor participation
- Visual Style Testing: Different approaches to supporting visuals and slides
Using PageOn.ai's analytical capabilities, I transform demonstration feedback and metrics into actionable insights. The platform helps me visualize patterns across multiple demonstrations, identifying which approaches consistently drive better results with different investor types.
By continuously measuring and refining my demonstration approach, I've been able to significantly increase investor engagement and conversion rates. This data-driven methodology ensures that each demonstration is more effective than the last.
Transform Your Investor Presentations with PageOn.ai
Ready to create captivating visual demonstrations that win investor confidence? PageOn.ai's powerful visualization tools help you transform complex product features into clear, compelling visual stories that investors remember.
Start Creating with PageOn.ai TodayThe Art and Science of Investor Demonstrations
Throughout my experience creating product demonstrations for investors, I've discovered that it's both an art and a science. The art lies in crafting a compelling narrative and creating those memorable "wow moments" that resonate emotionally. The science involves meticulous preparation, technical reliability, and systematic measurement of results.
When I master both aspects, my demonstrations don't just showcase a product—they tell a powerful story about market opportunity, unique value, and return on investment. The best demonstrations make investors feel they've discovered something special, rather than being sold to.
As I continue to refine my approach, I've found that visualization tools like PageOn.ai have become indispensable for transforming complex concepts into clear, impactful visuals that investors can immediately grasp. The ability to quickly create professional diagrams, charts, and visual flows has dramatically improved both my preparation efficiency and presentation effectiveness.
Whether you're pitching to angel investors, venture capitalists, or corporate innovation funds, mastering the art of live product demonstrations will significantly increase your chances of securing the funding and partnerships you need to succeed.
You Might Also Like
Strategic AI Marketing Investment Roadmap: Maximizing ROI from the $360 Billion Surge | 2025 Marketing Tech Budget Guide
Navigate the $360 billion AI investment surge with strategic marketing technology budget allocation. Discover proven frameworks for maximizing ROI from AI marketing tools in 2025.
Transform Your AI Results by Mastering the Art of Thinking in Prompts | Strategic AI Communication
Master the strategic mindset that transforms AI interactions from fuzzy requests to crystal-clear outputs. Learn professional prompt engineering techniques that save 20+ hours weekly.
The Science Behind Success: How AI-Powered Content Creation Delivers 25% Higher Success Rates
Discover why AI users report 25% higher content success rates. Learn proven strategies, productivity gains, and competitive advantages of AI-powered content creation.
Bridging Worlds: How Diffusion Models Are Reshaping Language Generation | PageOn.ai
Explore the revolutionary convergence of diffusion models and language generation. Discover how diffusion techniques are creating new paradigms for NLP, bridging visual and linguistic domains.