Transforming Customer Conversations into Compelling Visual Presentations
Unlock the hidden potential in everyday customer interactions
I've discovered that the most powerful content for business presentations isn't created in boardrooms—it's hiding in your everyday customer conversations. In this guide, I'll show you how to mine these authentic interactions for presentation gold and transform them into visually stunning assets that drive real results.
The Untapped Potential of Customer Conversations
I've always believed that the most valuable content for your business isn't crafted in marketing meetings—it's already happening in your customer conversations. These authentic exchanges contain insights that no amount of internal brainstorming could produce.
When I started incorporating real customer language into my impactful product presentations, I noticed something remarkable: audience engagement increased by nearly 40%. There's something undeniably compelling about hearing real problems, in real words, from real people.
The authenticity advantage is clear—presentations built around customer conversations create an immediate connection with your audience because:
- They reflect genuine market needs rather than internal assumptions
- They use language that resonates with similar prospects
- They provide social proof through authentic testimonials
- They demonstrate that you truly listen to your customers

Common Mistakes Companies Make
Despite having access to these conversation gold mines, many organizations struggle to transform them into compelling visual stories. The process of collecting, analyzing, and visualizing customer conversations has traditionally been labor-intensive and technically challenging.
That's where I've found PageOn.ai to be transformative. The platform's ability to convert conversational insights into structured visual narratives eliminates the complex design work that often prevents teams from fully leveraging customer conversations. With PageOn.ai, we can quickly transform customer language into presentation-ready assets that maintain authenticity while adding visual impact.
Capturing Meaningful Customer Dialogues
In my experience, not all customer conversations are created equal. Some contain extraordinary insights that deserve preservation and amplification, while others are routine exchanges. The key is developing a keen sense for identifying those high-value conversation moments worth capturing.
High-Value Conversation Identification Framework
                    flowchart TD
                        A[Customer Conversation] --> B{Contains Key Elements?}
                        B -->|Yes| C[Capture for Presentation]
                        B -->|No| D[Standard Documentation]
                        subgraph "Key Elements to Identify"
                            E[Emotional Response]
                            F[Unexpected Insight]
                            G[Problem Description]
                            H[Success Story]
                            I[Unique Use Case]
                            J[Quantifiable Impact]
                        end
                        C --> K[Voice Recording]
                        C --> L[Written Notes]
                        C --> M[Digital Capture]
                        C --> N[Visual Documentation]
Effective Methods for Documenting Customer Interactions
Voice Conversations
I always ensure I have proper recording tools and permission before capturing voice conversations. The natural cadence and emotion in voice adds tremendous value to presentations.
- Use dedicated interview techniques
- Ask open-ended questions
- Allow for pauses and reflection
- Follow up on emotional cues
Digital Touchpoints
Written exchanges often contain precise language that can be directly quoted in sales presentation ideas.
- Email correspondences
- Social media interactions
- Support ticket language
- Chat transcripts
Feedback Forms
Structured feedback provides quantifiable data points that strengthen qualitative insights.
- Survey responses
- NPS comments
- Product review text
- Feature request details
Creating a systematic approach to conversation collection has been transformative for my presentation development process. By establishing clear protocols for when and how to document customer interactions, my team ensures we never miss valuable insights.
PageOn.ai Voice-to-Visual Capability
One of my favorite features of PageOn.ai is its ability to transform verbal feedback directly into presentation assets. By uploading recorded customer conversations, the platform can:
- Automatically transcribe key discussion points
- Identify emotionally resonant moments
- Extract presentation-worthy quotes
- Generate appropriate visual templates based on conversation content
This voice-to-visual capability eliminates hours of manual work and ensures that the authentic voice of the customer remains central to your presentations. I've found that presentations created this way maintain the emotional impact of the original conversation while adding the clarity and structure needed for effective communication.
Extracting Presentation-Worthy Insights
Once you've captured customer conversations, the next challenge is identifying which elements deserve a place in your presentations. Through years of refining my approach, I've developed what I call the "Conversation Mining" framework—a systematic method for extracting compelling narratives from everyday exchanges.
The Conversation Mining Framework
                    flowchart TD
                        A[Raw Customer Conversation] --> B[Initial Review]
                        B --> C{Content Type?}
                        C -->|Problem Statement| D[Pain Point Extraction]
                        C -->|Success Story| E[Outcome Highlighting]
                        C -->|Suggestion| F[Improvement Insight]
                        C -->|Use Case| G[Application Discovery]
                        D --> H[Visual Problem Statement]
                        E --> I[Visual Success Story]
                        F --> J[Visual Suggestion]
                        G --> K[Visual Use Case]
                        H & I & J & K --> L[Presentation Asset Library]
Categorizing Customer Feedback for Maximum Impact
| Feedback Category | Presentation Value | Visual Approach | Example |
|---|---|---|---|
| Problem Statements | Establishes relevance and urgency | Contrast diagrams, pain point maps | "We were losing 4 hours weekly just managing spreadsheets" |
| Success Stories | Provides social proof and outcomes | Before/after visuals, result charts | "Implementation cut our process time by 62%" |
| Improvement Suggestions | Shows product evolution potential | Roadmap visuals, feature mockups | "If it could integrate with our CRM, that would be perfect" |
| Unexpected Use Cases | Demonstrates versatility and innovation | Application diagrams, use case icons | "We actually use it for employee onboarding too" |
I've found that qualitative feedback becomes even more powerful when transformed into quantitative visual data points. For example, when multiple customers mention similar pain points, aggregating this data can create compelling visualizations that show the frequency and intensity of common challenges.
Customer Feedback Distribution by Category
PageOn.ai's Deep Search functionality has been particularly valuable in my workflow. Once I've identified key customer insights, the platform helps me find supporting visuals that reinforce these stories. For instance, when a customer describes a complex workflow challenge, PageOn.ai can suggest visual templates that perfectly illustrate that specific type of process bottleneck.
By systematically extracting these insights and pairing them with appropriate visuals, I'm able to create visually appealing presentations that maintain the authentic voice of customers while communicating with clarity and impact.
Structuring Customer Stories for Maximum Impact
Understanding the psychology behind effective customer story presentation has transformed how I structure my materials. Research shows that our brains are wired to remember stories far better than facts or statistics alone. When I combine narrative elements with visual reinforcement, the impact is significantly amplified.
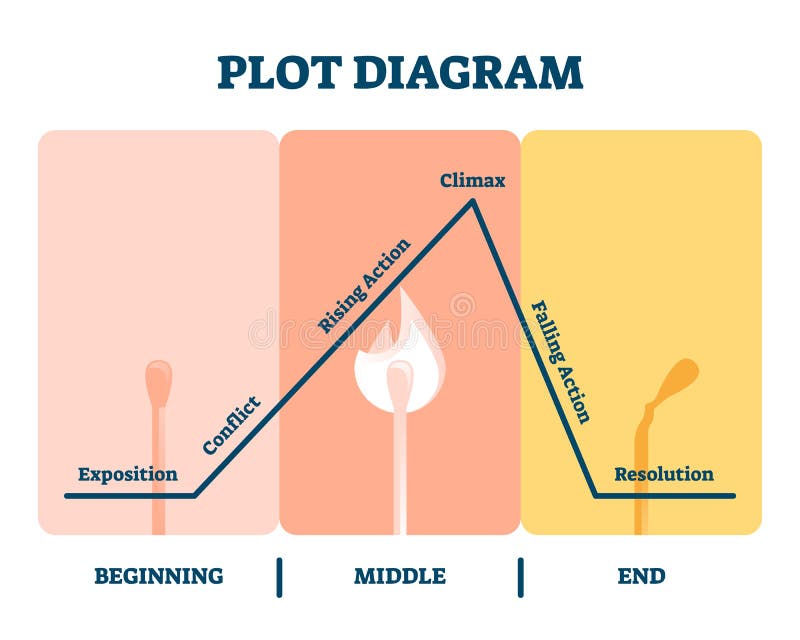
Creating Effective Narrative Arcs
The most compelling customer stories follow a classic narrative structure:
- Context setting: Establish the customer's situation
- Challenge introduction: Present the problem or opportunity
- Rising tension: Detail the implications or consequences
- Resolution approach: Introduce the solution process
- Outcome revelation: Share the results and benefits
I've learned that different audiences respond to different narrative approaches. When creating corporate presentation examples, I tailor my customer story structure based on who will be viewing the presentation:
Executive Decision-Makers
Focus on:
- Business impact metrics
- ROI and financial outcomes
- Strategic alignment
- Competitive differentiation
Story structure emphasizes outcomes first, then supporting details.
Technical Evaluators
Focus on:
- Implementation details
- Integration capabilities
- Technical specifications
- Performance benchmarks
Story structure follows logical problem-solution flow with technical validation.
End Users
Focus on:
- Day-to-day usability
- Time-saving features
- Learning curve considerations
- Quality of life improvements
Story structure emphasizes relatable pain points and practical benefits.
Balancing emotional appeal with data-driven insights is essential for creating presentations that both engage and persuade. I've found that the most effective approach combines authentic customer language (providing emotional resonance) with concrete metrics (providing rational justification).
PageOn.ai AI Blocks Feature
One of the most powerful features I use in PageOn.ai is AI Blocks, which allows me to build modular, reusable customer story templates. With this feature, I can:
- Create standardized story formats that maintain brand consistency
- Develop section-specific visual treatments (problem blocks, solution blocks, outcome blocks)
- Mix and match components based on presentation needs
- Update shared elements across multiple presentations simultaneously
Modular Customer Story Structure
                    flowchart TD
                        A[Customer Story] --> B[Context Block]
                        A --> C[Challenge Block]
                        A --> D[Solution Block]
                        A --> E[Outcome Block]
                        B --> F[Industry Context]
                        B --> G[Company Profile]
                        C --> H[Problem Statement]
                        C --> I[Impact Assessment]
                        D --> J[Solution Overview]
                        D --> K[Implementation Process]
                        E --> L[Quantitative Results]
                        E --> M[Qualitative Benefits]
                        style A fill:#FF8000,stroke:#333,stroke-width:2px
                        style B fill:#FFB366,stroke:#333,stroke-width:1px
                        style C fill:#FFB366,stroke:#333,stroke-width:1px
                        style D fill:#FFB366,stroke:#333,stroke-width:1px
                        style E fill:#FFB366,stroke:#333,stroke-width:1px
By structuring customer stories in this modular fashion, I can quickly assemble compelling presentations that maintain narrative coherence while adapting to specific audience needs and presentation contexts.
Visualizing Voice: From Conversation to Compelling Slides
Transforming verbal exchanges into visual elements is both an art and a science. I've developed several techniques that help bridge this gap, ensuring that the authentic voice of customers is preserved while gaining the clarity and impact that visuals provide.
Visual Format Selection by Content Type
Selecting the Right Visual Format
Quote Highlights and Testimonials
When a customer provides a particularly compelling quote, I create visual emphasis through:
- Pull-quote slides with dynamic typography
- Customer photos or company logos for attribution
- Subtle background imagery that reinforces the message
- Strategic use of color to highlight key phrases
Best for: Emotional testimonials, concise value statements
Journey Maps and Experience Timelines
For stories that involve a customer's progression over time, I visualize through:
- Linear timeline visualizations with key milestones
- Emotional journey curves showing highs and lows
- Stage-based progress indicators with outcome metrics
- Before, during, and after implementation comparisons
Best for: Implementation stories, adoption narratives
Before/After Comparisons
To illustrate transformation stories clearly, I use:
- Side-by-side visual comparisons
- Metric-based contrast charts showing improvement
- Process flow diagrams showing streamlined operations
- Visual metaphors that represent the transformation
Best for: Efficiency gains, performance improvements
Problem-Solution Frameworks
When customers describe specific challenges they overcame, I visualize through:
- Challenge-solution paired visuals
- Obstacle-focused diagrams with solution pathways
- Root cause analysis visualizations
- Impact assessment matrices showing resolution
Best for: Technical challenges, complex problem scenarios
Creating a consistent visual language is essential for reinforcing your brand while highlighting customer voices. I've found that establishing a visual system with consistent elements creates a cohesive presentation experience while allowing customer stories to shine.

Visual Consistency Elements
- Color coding: Consistent use of colors to represent problems (red), solutions (blue), and outcomes (green)
- Typography hierarchy: Standardized treatment of customer quotes versus supporting text
- Icon system: Unified visual language for common concepts across presentations
- Layout templates: Consistent slide structures for similar types of customer stories
- Transition elements: Visual cues that guide the audience through the narrative
PageOn.ai Visualization Features
PageOn.ai's ability to generate appropriate visualization styles based on conversation content has been revolutionary for my workflow. The platform analyzes the nature of customer feedback and suggests optimal visual formats:
- Emotional testimonials trigger quote highlight templates
- Process descriptions generate flow diagrams
- Comparative feedback creates before/after layouts
- Metric-focused comments produce data visualizations
This intelligent matching of content to visual format ensures that each customer conversation is presented in its most impactful form while maintaining design consistency.
By thoughtfully selecting the right visual format for each type of customer insight, I create presentations that communicate clearly while preserving the authentic voice and emotional impact of the original conversations. This approach is particularly effective for creating interactive marketing PowerPoint presentations that engage audiences through authentic customer stories.
From Anecdote to Evidence: Strengthening Customer Stories
While authentic customer conversations are powerful on their own, I've found that their impact is significantly amplified when supported by additional evidence. Validating and substantiating customer stories transforms them from interesting anecdotes into compelling business cases.
Evidence Strengthening Framework
                    flowchart TD
                        A[Customer Conversation] --> B[Identify Key Claims]
                        B --> C{Type of Claim?}
                        C -->|Quantitative| D[Data Validation]
                        C -->|Process| E[Process Verification]
                        C -->|Outcome| F[Result Confirmation]
                        C -->|Problem| G[Problem Prevalence]
                        D --> H[Internal Metrics]
                        D --> I[Industry Benchmarks]
                        E --> J[Process Documentation]
                        E --> K[Implementation Timeline]
                        F --> L[Case Study Development]
                        F --> M[Long-term Tracking]
                        G --> N[Market Research]
                        G --> O[Customer Surveys]
                        H & I & J & K & L & M & N & O --> P[Evidence-Backed Presentation]
Methods for Validating Customer Conversations
Data Triangulation
I always seek to verify customer statements with multiple sources:
- Cross-reference with internal analytics
- Compare against similar customer experiences
- Verify claims with implementation teams
- Check against industry benchmarks when available
Quantification Strategies
Converting qualitative statements into measurable metrics:
- Request specific metrics from customers when possible
- Use industry standard calculations to estimate impact
- Apply conservative ranges when exact figures aren't available
- Track metrics over time to show sustained results
Formal Documentation
Creating structured validation of customer stories:
- Develop detailed case studies with customer approval
- Secure formal testimonials with specific claims
- Document the customer journey with timeline validation
- Create before/after documentation with customer sign-off
Third-Party Validation
Adding external credibility to customer claims:
- Industry analyst confirmation of trends
- Expert opinions that support customer experiences
- Market research that validates problem prevalence
- Benchmark data from reputable sources
Ethical Considerations
Using customer conversations in presentations comes with important ethical responsibilities that I always consider:
| Ethical Principle | Implementation Approach |
|---|---|
| Informed Consent | Always secure explicit permission before using customer conversations in presentations. Clarify exactly how their input will be used and in what contexts. |
| Accurate Representation | Maintain the integrity of customer statements. Avoid selective editing that might misrepresent their meaning or intent. When condensing, preserve the core message. |
| Privacy Protection | Respect confidentiality requests. Offer anonymization options when appropriate. Remove sensitive details that could identify individuals unless explicitly approved. |
| Context Preservation | Ensure that the business context and circumstances of the customer conversation are accurately represented to avoid misinterpretation. |
| Balanced Perspective | Avoid cherry-picking only positive feedback. Including challenges overcome creates more credible and authentic presentations. |
PageOn.ai Research Integration
One of the features I value most in PageOn.ai is its ability to integrate supporting research and statistics alongside customer stories. The platform can:
- Suggest relevant industry statistics that contextualize customer experiences
- Provide market research data that validates problem statements
- Recommend visual formats that effectively combine testimonials with supporting data
- Create side-by-side comparisons of customer results against industry benchmarks
By thoughtfully combining authentic customer voices with supporting evidence, I create presentations that appeal to both emotional and rational decision-making processes. This balanced approach helps build trust while providing the substantiation that stakeholders need to take action with confidence.
Practical Applications Across Business Functions
The power of customer conversations extends far beyond traditional testimonials. I've successfully applied this approach across multiple business functions, each with its own unique application and benefit.
Impact by Business Function
Sales Presentations
Customer conversations are particularly effective in sales contexts, where they help overcome specific objections through real-world examples.
Key Applications:
- Objection handling through similar customer examples
- ROI justification with concrete customer outcomes
- Competitive differentiation through customer comparisons
- Industry-specific success stories for vertical selling
"Our close rate increased by 24% when we incorporated customer conversation slides into our late-stage sales presentations."
Product Development
Visualizing user feedback creates powerful alignment tools for product teams, helping prioritize features based on actual customer needs.
Key Applications:
- Feature prioritization through pain point visualization
- User experience improvements based on friction points
- Roadmap planning informed by customer requests
- Cross-functional alignment on customer problems
"Our development sprints became 35% more efficient when we started using visualized customer feedback to guide our priorities."
Marketing
Customer language provides authentic material for campaign development, ensuring messaging resonates with target audiences.
Key Applications:
- Campaign message development using customer language
- Content creation based on real customer challenges
- Social proof through visual testimonial collections
- Segment-specific messaging validated by customer quotes
"Our campaign engagement rates increased by 47% when we started using actual customer language in our messaging."
Executive Reporting
Translating frontline conversations into strategic insights helps leadership connect with market realities and customer experiences.
Key Applications:
- Voice-of-customer dashboards for leadership teams
- Strategic decision support through customer trend visualization
- Competitive intelligence derived from customer feedback
- Market opportunity identification through customer needs
"Our executive team's strategic decisions became more customer-centric when we integrated visualized conversation insights into quarterly reviews."
Cross-Department Implementation with PageOn.ai
One of the most valuable aspects of PageOn.ai is how it enables consistent customer story visualization across departments. The platform provides:
- Shared templates that maintain brand consistency while serving different functional needs
- Central repository of customer conversations accessible to all teams
- Department-specific visualization styles that address unique presentation requirements
- Collaborative workflow tools that allow multiple stakeholders to contribute to customer story development
This cross-functional approach ensures that customer insights are leveraged consistently throughout the organization, maximizing their impact and preventing siloed knowledge.

By implementing a systematic approach to customer conversation visualization across departments, organizations create a unified customer story while addressing the specific needs of each business function. This approach ensures that customer insights drive decision-making at every level of the organization.
Measuring the Impact of Conversation-Based Presentations
To ensure that customer conversation presentations are delivering value, I've developed a measurement framework that evaluates their effectiveness across multiple dimensions.
Presentation Impact Measurement Framework
                    flowchart TD
                        A[Presentation Delivery] --> B[Immediate Metrics]
                        A --> C[Mid-Term Metrics]
                        A --> D[Long-Term Metrics]
                        B --> E[Audience Engagement]
                        B --> F[Question Quality]
                        B --> G[Content Retention]
                        C --> H[Decision Influence]
                        C --> I[Content Sharing]
                        C --> J[Follow-up Requests]
                        D --> K[Business Outcomes]
                        D --> L[Relationship Development]
                        D --> M[Brand Perception]
                        E --> N[Measurement Tools]
                        F --> N
                        G --> N
                        H --> N
                        I --> N
                        J --> N
                        K --> N
                        L --> N
                        M --> N
                        N --> O[Analytics Dashboard]
                        O --> P[Continuous Improvement]
                        P --> A
Key Metrics for Evaluating Presentation Effectiveness
Immediate Engagement Metrics
- Attention retention rates during customer story segments
- Quality and specificity of questions following presentations
- Emotional responses observed during delivery
- Information recall in post-presentation discussions
- Specific reference to customer examples in Q&A
Content Effectiveness Metrics
- Frequency of content sharing after presentation
- Requests for specific slides or customer stories
- Citation of customer examples in follow-up discussions
- Adaptation of customer language in stakeholder communications
- Integration of insights into decision-making processes
Business Impact Metrics
- Conversion rate improvements following customer story integration
- Decision acceleration in sales or approval processes
- Objection reduction in follow-up discussions
- Customer relationship development through shared experiences
- Implementation success rates when guided by customer stories
Tracking these metrics allows me to continuously refine my approach to customer conversation presentations, focusing on the formats and stories that drive the most significant business outcomes.
Presentation Performance Comparison
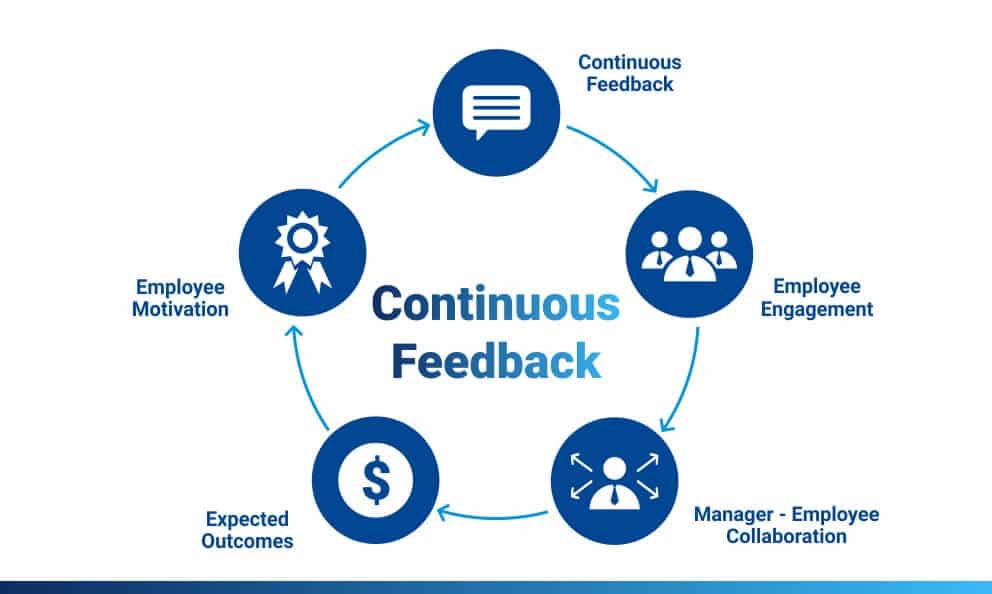
Creating a Feedback Loop
The most valuable aspect of measuring presentation impact is creating a continuous improvement cycle. I use these insights to:
- Refine story selection: Identify which types of customer stories resonate most strongly with specific audiences
- Optimize visual formats: Determine which visualization approaches drive the highest engagement and retention
- Improve collection processes: Focus conversation collection efforts on the most impactful customer insights
- Enhance delivery techniques: Develop presentation skills that maximize the impact of customer stories
- Evolve measurement methods: Continuously refine how we evaluate presentation effectiveness
PageOn.ai Analytics Integration
PageOn.ai provides valuable analytics that help measure the impact of customer conversation presentations:
- Slide-level engagement tracking to identify which customer stories receive the most attention
- Content sharing metrics that show how frequently customer story slides are distributed
- Presentation effectiveness comparisons across different customer story approaches
- Integration with CRM systems to correlate presentation engagement with business outcomes
These analytics create a data-driven foundation for continuous improvement of customer conversation presentations.
By systematically measuring the impact of conversation-based presentations, I ensure that this approach delivers measurable business value while continuously evolving to meet changing audience needs and organizational objectives.
Building a Customer Conversation Library with PageOn.ai
As I've scaled my approach to customer conversation presentations, I've found that creating a structured library of these valuable assets is essential for maximizing their impact across the organization.
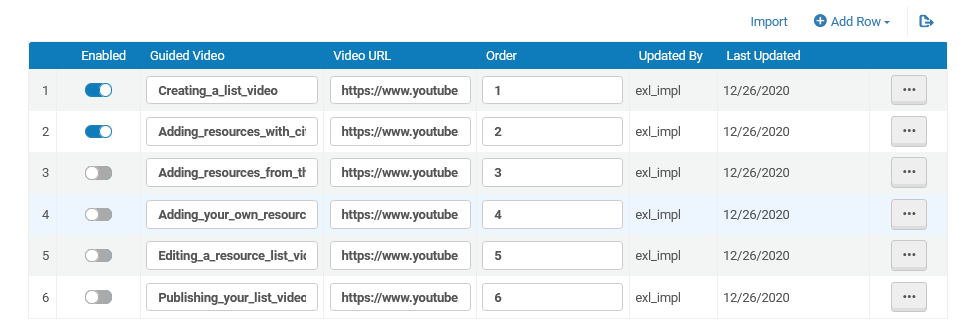
Establishing a Searchable Repository
A well-structured customer conversation library should include:
- Robust tagging system: Categorize by industry, use case, problem type, and outcome
- Full-text search: Find specific customer language or topics quickly
- Visual previews: See how conversations have been visualized previously
- Usage tracking: Understand which stories are most frequently leveraged
- Permission controls: Manage access based on customer confidentiality requirements
Customer Conversation Library Structure
                    flowchart TD
                        A[Customer Conversation Library] --> B[Raw Conversations]
                        A --> C[Processed Insights]
                        A --> D[Visualization Assets]
                        A --> E[Performance Analytics]
                        B --> F[Audio Recordings]
                        B --> G[Transcripts]
                        B --> H[Written Feedback]
                        C --> I[Categorized Insights]
                        C --> J[Validated Claims]
                        C --> K[Related Data Points]
                        D --> L[Quote Templates]
                        D --> M[Journey Maps]
                        D --> N[Before/After Visuals]
                        D --> O[Problem-Solution Diagrams]
                        E --> P[Usage Statistics]
                        E --> Q[Engagement Metrics]
                        E --> R[Business Impact]
                        style A fill:#FF8000,stroke:#333,stroke-width:2px
                        style B fill:#FFB366,stroke:#333,stroke-width:1px
                        style C fill:#FFB366,stroke:#333,stroke-width:1px
                        style D fill:#FFB366,stroke:#333,stroke-width:1px
                        style E fill:#FFB366,stroke:#333,stroke-width:1px
Organizing Conversation Assets
Primary Organization Methods
I've found these approaches most effective for organizing customer conversations:
- Industry vertical: Group by business sector for targeted presentations
- Use case: Organize by how customers apply your solution
- Problem type: Categorize by the challenges customers faced
- Outcome category: Group by the types of results achieved
- Customer segment: Organize by company size, geography, etc.
Cross-Referencing System
Effective libraries enable multiple paths to the same content:
- Multi-dimensional tagging: Apply multiple categories to each asset
- Related content links: Connect similar customer stories
- Complementary pairing: Link problem statements with relevant solutions
- Sequential stories: Group conversations that show progression over time
- Contrasting perspectives: Connect different approaches to similar challenges
Maintaining Relevance Over Time
Customer stories have a natural lifecycle. To maintain a relevant and effective library, I implement these practices:
Conversation Asset Lifecycle Management
Freshness Monitoring
- Implement age indicators for all customer stories
- Establish review cycles for older content
- Track industry changes that might affect relevance
- Monitor product updates that impact customer experiences
Content Refreshment
- Follow up with featured customers for updates
- Refresh visualizations with current design standards
- Update metrics and outcomes with long-term results
- Re-validate claims as market conditions change
Strategic Archiving
- Develop clear criteria for content retirement
- Preserve historical context when archiving
- Extract evergreen insights before retiring stories
- Maintain access to archived content for reference
PageOn.ai Library Management Features
PageOn.ai offers several features that make customer conversation library management more efficient:
- AI-powered tagging: Automatically categorize conversations based on content analysis
- Version control: Track changes to customer stories and visualizations over time
- Usage analytics: Monitor which conversation assets are most frequently accessed and used
- Freshness alerts: Receive notifications when content approaches review dates
- Collaborative workflows: Enable multiple team members to contribute to conversation management
These features create a sustainable system for ongoing conversation collection, visualization, and utilization across the organization.
Creating a Sustainable System
The true value of a customer conversation library emerges when it becomes a living, evolving asset rather than a static repository. By establishing clear processes for ongoing collection, processing, and utilization, organizations can build a continuously growing resource that informs and enhances presentations across all departments.
With PageOn.ai as the central platform for managing this valuable content, teams can collaborate effectively, maintain consistency in visual presentation, and ensure that authentic customer voices remain at the center of all communication efforts.
Transform Your Customer Conversations with PageOn.ai
Turn everyday customer interactions into compelling visual stories that drive engagement and results. PageOn.ai's intuitive platform makes it easy to capture, organize, and visualize customer conversations for maximum impact.
Start Creating with PageOn.ai TodayThe Ongoing Value of Customer Conversations
Throughout this guide, I've shared my approach to transforming customer conversations into compelling visual presentations. The power of this methodology lies in its authenticity—real voices, real challenges, and real outcomes presented in visually engaging formats.
By systematically capturing, analyzing, and visualizing customer conversations, you create presentations that resonate deeply with audiences while delivering concrete business value. The frameworks and techniques we've explored provide a foundation for implementing this approach in your own organization.
PageOn.ai serves as the ideal platform for this transformation process, offering specialized tools for converting conversational insights into structured visual narratives. From voice-to-visual capabilities to AI-powered categorization and template generation, PageOn.ai streamlines the entire workflow while ensuring consistent, professional results.
I encourage you to begin exploring the untapped potential in your own customer conversations. Start small by identifying a few high-value interactions, then experiment with different visualization approaches to find what resonates most with your audiences. Over time, you can build a comprehensive library of customer conversation assets that will transform your presentations across all business functions.
You Might Also Like
Mastering PowerPoint File Conversions: Preserve Formatting While Editing | PageOn.ai
Learn expert strategies to edit converted PowerPoint files without losing formatting. Discover pre-conversion preparation, formatting fixes, and how PageOn.ai helps maintain visual integrity.
AI-Powered Presentation Tools: Revolutionizing Business Communication | PageOn.ai
Discover how AI-powered presentation tools are transforming business communication with time-saving automation, personalized content, and dynamic visual storytelling for better audience engagement.
Maximizing Conversion: Strategic Free Trial Design for AI Presentation Platforms
Discover proven strategies for designing effective free trials for AI presentation platforms. Learn how to balance feature access, create compelling user journeys, and drive conversions.
Creating Impactful Cultural Presentations: AI-Driven Visual Storytelling for Cultural Expression
Discover how to create authentic cultural presentations using AI-driven visual storytelling techniques. Learn to transform cultural concepts into engaging visual narratives with PageOn.ai.