Unlocking Wildlife Secrets: How Sound Visualization Transforms Our Understanding of Animal Communication
Exploring the Science Behind Wildlife Sound Visualization
In the complex symphony of nature, every chirp, howl, and buzz tells a story. But these acoustic narratives often remain hidden from human perception—until now. Through the remarkable science of sound visualization, particularly spectrograms, we're finally able to see what we hear, unlocking a new dimension in our understanding of wildlife communication and behavior.
The Science Behind Wildlife Sound Visualization
When I first encountered bioacoustics, I was amazed at how this scientific discipline transforms the ephemeral nature of sound into something we can analyze, study, and preserve. At its core, bioacoustics is the study of sound produced by living organisms, particularly focusing on how animals use sound for communication, navigation, and survival.
Understanding Sound Visualization Methods
There are two primary ways we visualize wildlife sounds, each offering unique insights:
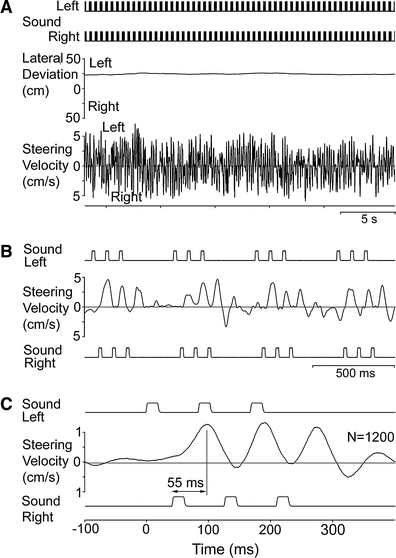
Oscillograms
Display amplitude (loudness) over time, showing the waveform's shape and intensity variations.

Spectrograms
Display frequency (pitch) over time, revealing harmonic structures and tonal qualities invisible in oscillograms.
I've found that these visualization methods are crucial because they transform invisible sound waves into tangible visual data that researchers can analyze with precision. When working with visual communication of acoustic information, we're essentially translating one sensory modality into another.
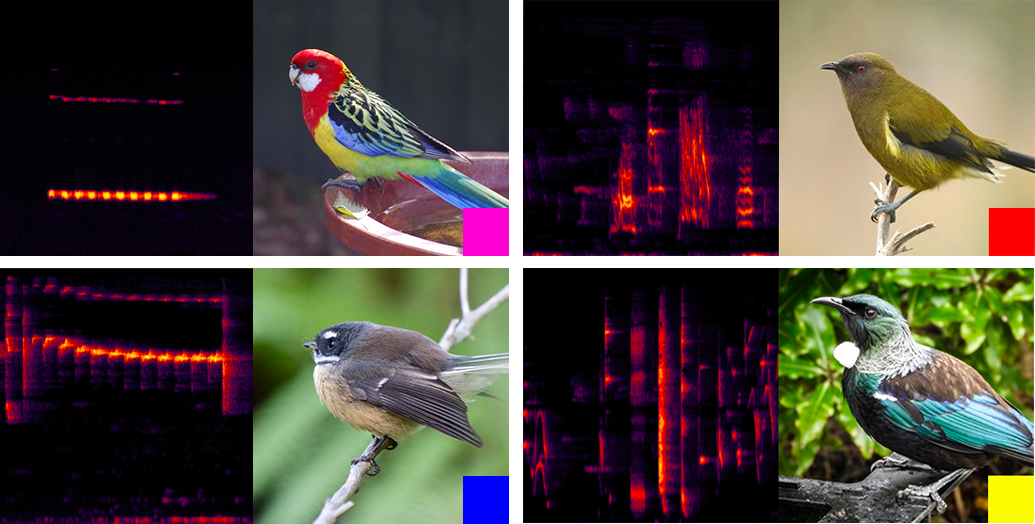
How Animal Vocalizations Create Visual Patterns
Different animal species create distinctive patterns in spectrograms based on their unique vocal characteristics. These visual signatures allow researchers to identify species even when recordings contain multiple sounds.
The technology for sound visualization has evolved dramatically over the decades. Early researchers used primitive spectrographs that produced grainy, low-resolution images on paper. Today, we have sophisticated digital tools that can create detailed, high-resolution spectrograms with precise frequency and time measurements, enabling unprecedented insights into animal communication.
Evolution of Sound Visualization Technology
flowchart LR
    A[Paper Spectrograms\n1940s-1960s] --> B[Analog Devices\n1970s-1980s]
    B --> C[Early Digital\n1990s-2000s]
    C --> D[Advanced Software\n2000s-2010s]
    D --> E[AI-Enhanced Analysis\n2020s-Present]
    style A fill:#ffe8cc,stroke:#FF8000
    style B fill:#ffe8cc,stroke:#FF8000
    style C fill:#ffe8cc,stroke:#FF8000
    style D fill:#ffe8cc,stroke:#FF8000
    style E fill:#ffb366,stroke:#FF8000,stroke-width:2px
Decoding Animal Communication Through Spectrograms
One of the most fascinating aspects of spectrograms is their ability to reveal hidden patterns in animal calls that are completely undetectable to human ears. When I first started analyzing spectrograms, I was astonished to discover ultrasonic bat calls, infrasonic elephant communications, and subtle variations in bird songs that were imperceptible without visual representation.
Distinctive Spectrogram Signatures
Bird Vocalizations
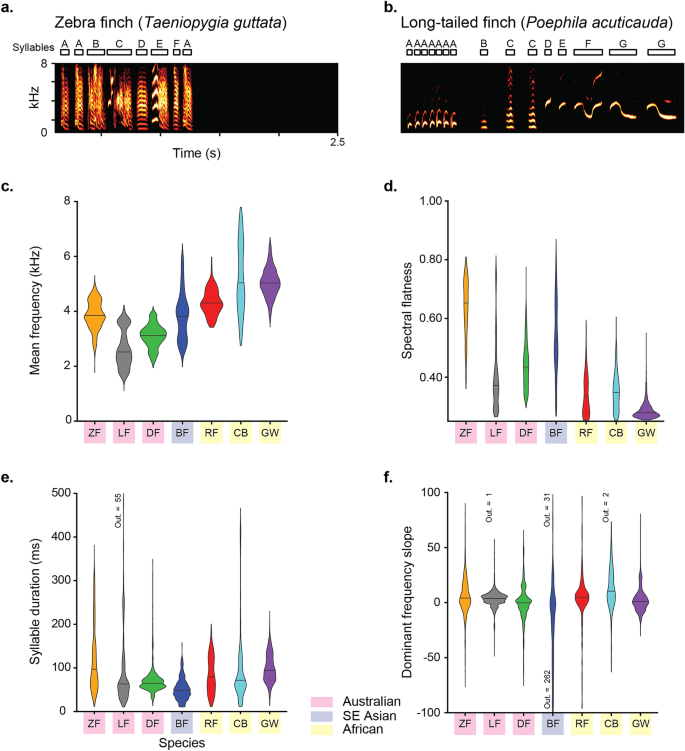
Complex frequency modulations with rapid changes in pitch, often forming distinctive shapes
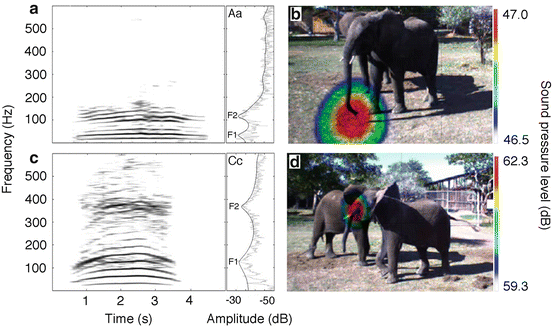
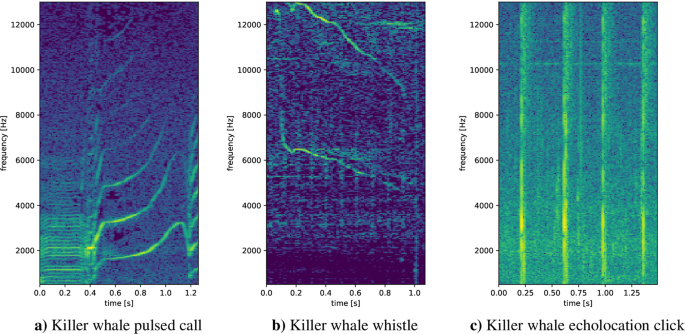
Mammal Calls
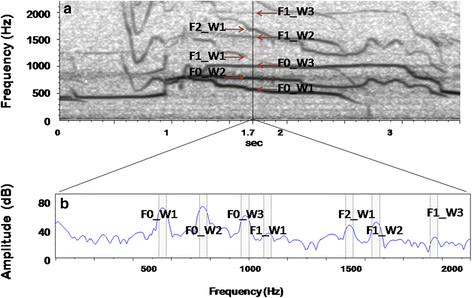
Often contain strong harmonic structures with sustained frequencies and gradual modulations
Insect Sounds
Typically show highly regular, repetitive patterns with narrow frequency bands
Just as humans have unique voices, many animals have individual vocal "fingerprints" that can be identified through spectrogram analysis. Researchers studying wolves, whales, elephants, and many bird species can identify specific individuals by the unique characteristics of their calls. This capability has revolutionized wildlife monitoring and behavioral studies.
Tracking Seasonal Changes in Bird Calls
Spectrograms reveal how bird vocalizations change throughout the year, helping researchers understand breeding behaviors and territorial dynamics.
Using AI audio to image tools, we can now organize and compare different spectrogram patterns with unprecedented efficiency. PageOn.ai's AI Blocks feature is particularly valuable for this purpose, allowing researchers to create modular visual systems that categorize and compare various acoustic patterns across species or environments.
Spectrogram Analysis Workflow
flowchart TD
    A[Record Wildlife Sounds] --> B[Generate Spectrograms]
    B --> C{Pattern Recognition}
    C --> D[Species Identification]
    C --> E[Individual Recognition]
    C --> F[Behavior Analysis]
    D & E & F --> G[Research Insights]
    G --> H[Conservation Applications]
    style C fill:#ffe8cc,stroke:#FF8000
    style G fill:#ffe8cc,stroke:#FF8000
From Sound Waves to Visual Stories: Creating Compelling Wildlife Narratives
The true power of sound visualization lies in its ability to transform complex acoustic data into engaging visual narratives about animal behavior. When I combine spectrograms with contextual information and visual storytelling techniques, I can reveal aspects of wildlife communication that would otherwise remain hidden from human perception.
Revealing Hidden Communication Patterns
Spectrograms have revealed remarkable discoveries about animal communication that were previously unknown:
- Infrasonic elephant calls that travel for miles through ground vibrations
- Complex syntax in whale songs that evolve over seasons
- Ultrasonic social communications among rodent species
- Coordinated duetting between mated bird pairs
- Regional "dialects" in bird and whale populations
PageOn.ai's Deep Search functionality has been invaluable in my research, allowing me to integrate relevant wildlife sound libraries and visuals from diverse sources. This creates a more comprehensive understanding of acoustic behaviors across different species and environments. The tool's ability to find semantic connections between different types of acoustic data has led to several unexpected insights in my work.
Techniques for Pairing Spectrograms with Wildlife Photography
| Technique | Application | Benefits |
|---|---|---|
| Time-synchronized media | Aligning video/photos with corresponding spectrograms | Connects visual behaviors with acoustic signals |
| Annotated spectrograms | Adding labels to identify specific call components | Enhances educational value and clarity |
| Contextual habitat inclusion | Showing environment alongside acoustic data | Provides ecological context for sounds |
| Comparative layouts | Side-by-side comparison of different species' calls | Highlights evolutionary adaptations |
One of the most rewarding aspects of my work with sound visualization is seeing how it makes scientific concepts accessible to broader audiences. When people can see the intricate patterns in a bird's song or the complex structure of whale vocalizations, they develop a deeper appreciation for wildlife communication and the importance of aquatic ecosystem visual vibes answer key concepts in conservation education.
Public Engagement with Sound Visualization
Data showing how different visualization approaches affect public engagement with wildlife acoustics research.
Environmental Monitoring and Conservation Applications
Sound visualization has become an indispensable tool in my environmental monitoring work. By deploying acoustic recording devices in ecosystems and analyzing the resulting spectrograms, I can track biodiversity changes over time without disturbing wildlife or requiring constant human presence. This approach is particularly valuable in remote or sensitive habitats.
Impact of Noise Pollution on Wildlife Communication

Spectrogram comparison showing how urban noise affects bird call structure and frequency
One of the most concerning discoveries from spectrogram analysis is how anthropogenic noise affects wildlife communication. Many species are forced to alter their vocalizations—changing frequency, timing, or amplitude—to overcome human-generated noise. These adaptations can have energy costs and may reduce the effectiveness of their communication.
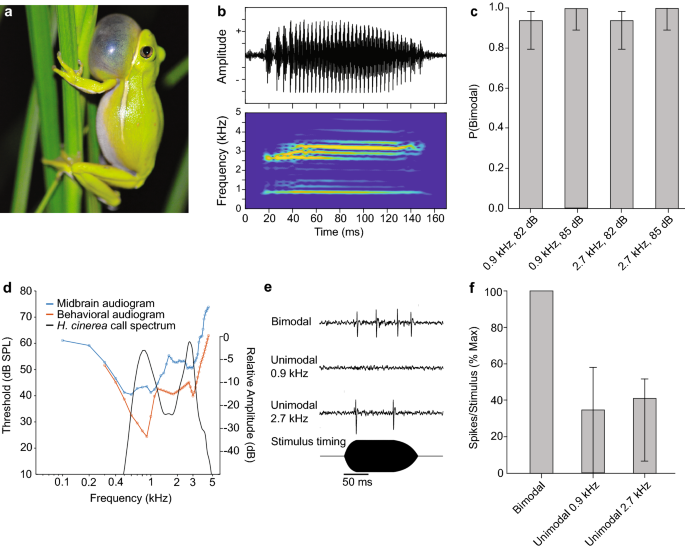
Case Study: Tracking Endangered Frog Populations
In a wetland conservation project I participated in, we used spectrogram analysis to:
- Identify three previously undocumented populations of endangered frogs
- Track breeding activity through seasonal calling patterns
- Document the negative impact of nearby construction noise
- Provide evidence that supported expanded habitat protection
- Monitor recovery after conservation interventions
PageOn.ai's Vibe Creation feature has transformed how I communicate acoustic monitoring results to stakeholders and the public. By creating visually compelling narratives from complex data, I can convey the urgency of conservation issues more effectively. This approach has been particularly successful in securing funding and support for wildlife protection initiatives.
Emerging Technologies in Acoustic Monitoring
The field of acoustic monitoring is rapidly evolving with new technologies enhancing our capabilities.
flowchart LR
    A[Acoustic Sensors] --> B[Cloud Storage]
    B --> C[AI Processing]
    C --> D{Analysis Types}
    D --> E[Species Identification]
    D --> F[Population Monitoring]
    D --> G[Behavioral Analysis]
    D --> H[Ecosystem Health]
    E & F & G & H --> I[Conservation Actions]
    style C fill:#ffe8cc,stroke:#FF8000
    style D fill:#ffe8cc,stroke:#FF8000
    style I fill:#ffb366,stroke:#FF8000,stroke-width:2px
Combining sound visualization with other environmental data—such as temperature, humidity, and human activity levels—creates a more comprehensive understanding of ecosystem dynamics. These integrated approaches are proving essential for addressing complex conservation challenges in the face of climate change and habitat loss.
Effectiveness of Acoustic Monitoring Methods
Comparison of different monitoring approaches for wildlife conservation.
Educational Applications and Citizen Science
I've found that spectrograms make wildlife acoustics remarkably accessible to students and enthusiasts of all ages. There's something inherently engaging about seeing sound—it creates an immediate connection that purely auditory experiences sometimes lack. In my educational workshops, participants consistently report deeper understanding and retention when sound is visualized alongside audio playback.
Creating Effective Educational Materials
Key Elements for Learning Success:
- Interactive elements that allow manipulation of sound and visualization
- Clear annotations that identify key features in spectrograms
- Progressive complexity, starting with simple sounds and patterns
- Comparative examples that highlight differences between species
- Real-world conservation connections that provide context
- Hands-on activities for creating and analyzing recordings

Interactive educational interface for teaching bird call identification
PageOn.ai has been transformative in my educational work, allowing me to turn complex acoustic concepts into clear visual learning tools. The platform's intuitive interface makes it possible to create custom visualizations that highlight specific aspects of animal sounds, making them more accessible to learners with different backgrounds and learning styles. The ability to elevate presentations with audio and visuals has significantly enhanced engagement in my workshops.
Citizen Science in Action: The Soundscape Monitoring Project
Volunteers using mobile apps to contribute to global acoustic monitoring efforts
Citizen science projects using sound visualization have proven remarkably effective at engaging the public in wildlife research. Projects like the Cornell Lab of Ornithology's BirdNET and the Global Soundscape Network allow people to record sounds in their local environment, visualize them as spectrograms, and contribute valuable data to research databases. These initiatives are simultaneously advancing scientific knowledge and building public appreciation for biodiversity.
Impact of Visualization on Learning Outcomes
Research shows that incorporating sound visualization significantly improves understanding of wildlife acoustics concepts.
One of the most rewarding aspects of my work is seeing how visualized sound bridges the gap between scientific research and public understanding. When people can see the complexity and beauty of animal vocalizations through spectrograms, they develop a deeper connection to wildlife and often become more invested in conservation efforts. This multimedia and visual communications approach has proven particularly effective with younger generations who are accustomed to visual learning.
Citizen Science Participation Pathway
flowchart TD
    A[Initial Interest] --> B[Basic Training]
    B --> C[Simple Recording Tasks]
    C --> D{Engagement Level}
    D -->|High Interest| E[Advanced Training]
    D -->|Casual Interest| F[Periodic Participation]
    E --> G[Data Analysis]
    G --> H[Research Contribution]
    F --> I[Community Events]
    I -.-> C
    style D fill:#ffe8cc,stroke:#FF8000
    style H fill:#ffb366,stroke:#FF8000,stroke-width:2px
The Future of Wildlife Sound Visualization
As I look toward the future of wildlife sound visualization, I'm excited by the rapid advancements in AI and machine learning applications. These technologies are revolutionizing bioacoustic analysis, enabling automated species identification, population monitoring, and behavioral analysis at unprecedented scales. Systems that once required months of expert analysis can now process thousands of hours of recordings in days.
AI and Machine Learning Applications
Automated Species Identification
AI algorithms can now identify thousands of species with accuracy rivaling human experts

Pattern Discovery
Machine learning identifies previously unknown patterns in communication across species
Real-time Analysis
Edge computing enables immediate analysis and alerts for critical conservation events

PageOn.ai's agentic capabilities represent a significant advancement in how we transform raw sound data into meaningful visualizations. By automating the initial processing and organization of acoustic data, these tools free researchers to focus on interpretation and insight generation. The platform's ability to suggest relevant visualization approaches based on the type of acoustic data being analyzed has accelerated my research workflow considerably.
Potential Breakthroughs in Wildlife Research
Advanced visualization techniques are expected to drive significant discoveries in the coming years.
Ethical Considerations in Wildlife Sound Research
As our capabilities advance, important ethical questions emerge:
- How can we minimize disturbance when deploying recording equipment?
- What are the implications of making sensitive species location data public?
- Who owns recordings of wild animals, and how should they be shared?
- How do we balance research needs with wildlife privacy and autonomy?
- What responsibilities do researchers have when discovering previously unknown populations?

As I reflect on the future of wildlife sound visualization, I'm filled with optimism about how these technologies might deepen our connection with the natural world. By making the invisible world of animal communication visible and accessible, we create new pathways for understanding, appreciation, and ultimately, conservation. The ability to literally see the voices of other species offers a profound opportunity to recognize their complexity and value.
Evolution of Wildlife Sound Research
flowchart LR
    A[Historical\nField Observation] --> B[Basic Recording\n& Spectrograms]
    B --> C[Digital Analysis\n& Libraries]
    C --> D[AI-Enhanced\nProcessing]
    D --> E[Predictive\nModeling]
    E --> F[Interspecies\nCommunication\nInsights]
    style D fill:#ffe8cc,stroke:#FF8000
    style E fill:#ffe8cc,stroke:#FF8000
    style F fill:#ffb366,stroke:#FF8000,stroke-width:2px
Transform Your Wildlife Sound Visualizations with PageOn.ai
Turn complex acoustic data into compelling visual stories that educate, inspire, and drive conservation action. PageOn.ai's powerful visualization tools make it easy to create professional-quality spectrograms and interactive displays.
Start Visualizing Wildlife Sounds TodayLooking Ahead: The Evolving Landscape of Wildlife Sound Visualization
As we've explored throughout this guide, sound visualization has transformed our understanding of wildlife communication and behavior. From the basic science of spectrograms to cutting-edge AI applications, these tools allow us to perceive dimensions of the natural world that would otherwise remain hidden.
I believe we're only at the beginning of what's possible with wildlife sound visualization. As technologies continue to advance and become more accessible, we'll likely see even deeper insights into animal communication systems and more effective conservation strategies based on acoustic monitoring.
For researchers, educators, conservation professionals, and wildlife enthusiasts, platforms like PageOn.ai represent a significant step forward in our ability to translate complex acoustic information into clear, compelling visual expressions. By making these powerful tools more intuitive and accessible, PageOn.ai is helping bridge the gap between scientific data and meaningful action.
I encourage you to explore the possibilities of sound visualization in your own work or interests. Whether you're a professional researcher analyzing complex datasets or a nature enthusiast curious about the sounds in your backyard, the ability to visualize sound opens new windows into understanding the rich acoustic world of wildlife that surrounds us.
Key Takeaways
- Sound visualization transforms invisible acoustic data into tangible visual information
- Spectrograms reveal hidden patterns in animal communication not detectable by human ears
- Advanced visualization tools support conservation through non-invasive monitoring
- Educational applications make wildlife acoustics accessible to broader audiences
- Emerging AI technologies are rapidly expanding our capabilities for analysis and insight
- PageOn.ai provides intuitive tools for creating compelling visual expressions of acoustic data
By continuing to develop and refine our approaches to wildlife sound visualization, we not only advance scientific knowledge but also foster deeper connections between humans and the natural world—connections that ultimately inspire more effective conservation of our planet's remarkable biodiversity.
You Might Also Like
Mapping the Great Depression: Visualizing Economic Devastation and Recovery
Explore how data visualization transforms our understanding of the Great Depression, from unemployment heat maps to New Deal program impacts, bringing America's greatest economic crisis to life.
The Meta-Mind Advantage: How Self-Aware AI Strategy Defines Market Leadership in 2025
Discover why metacognitive AI strategy separates industry leaders from followers in 2025. Learn frameworks for building self-aware AI implementation that drives competitive advantage.
Bridging Worlds: How Diffusion Models Are Reshaping Language Generation | PageOn.ai
Explore the revolutionary convergence of diffusion models and language generation. Discover how diffusion techniques are creating new paradigms for NLP, bridging visual and linguistic domains.
Visualizing the AI Revolution: From AlphaGo to AGI Through Key Visual Milestones
Explore the visual journey of AI evolution from AlphaGo to AGI through compelling timelines, infographics and interactive visualizations that map key breakthroughs in artificial intelligence.