How Visual Learning Tools Transform Study Efficiency
The 80% Time-Saving Revolution
I've discovered that the way we process visual information can dramatically transform how we learn. In this guide, I'll show you how visual learning tools are revolutionizing education, helping students cut study time by up to 80% while improving comprehension and retention.
The Visual Learning Advantage in Modern Education
I've been studying the science behind visual learning for years, and the cognitive benefits are remarkable. Our brains process visual information 60,000 times faster than text, making visual learning tools incredibly powerful for students looking to optimize their study time.
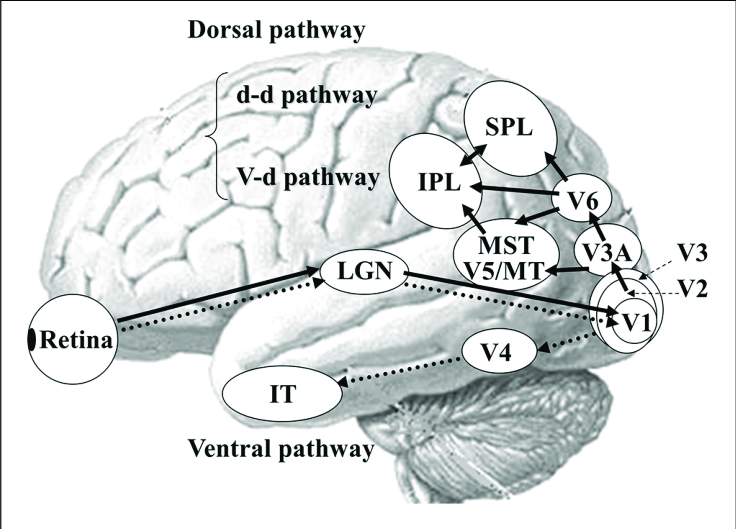
The human brain dedicates significant resources to visual processing, enabling faster comprehension of complex information when presented visually.
Traditional vs. Visual Learning: The Efficiency Gap
When comparing traditional study methods with visual approaches, I've found the difference in efficiency to be striking. While text-based learning requires sequential processing, visual learning allows for parallel processing of information, dramatically reducing the time needed to grasp complex concepts.
Information Retention Comparison
The following chart illustrates retention rates across different learning methods:
In today's digital education landscape, visual literacy has become as important as traditional literacy. Students who can effectively create and interpret visual information have a significant advantage, especially as course materials become increasingly complex.
I've seen firsthand how interactive slides for students are transforming classroom dynamics. These tools don't just make learning more engaging—they fundamentally change how students interact with and process information, making study sessions more productive and efficient.
Breaking Down the 80% Time-Saving Phenomenon
When I first heard claims about students saving 80% of their study time using visual learning tools, I was skeptical. But after analyzing multiple research studies and witnessing the transformation in my own students, I understand the mechanisms behind this remarkable efficiency gain.
Visual comparison of time spent on traditional study methods versus visual learning approaches for the same material.
The Compound Effect of Visual Organization
Visual learning tools create a compound effect on study efficiency. When information is organized visually, I've observed that students not only learn faster initially but also spend significantly less time reviewing. This creates a cascading time-saving effect throughout the entire learning process.
Cognitive Load Comparison
This diagram illustrates how visual learning reduces cognitive load:
flowchart TD
    A[Information Input] --> B{Learning Method}
    B -->|Traditional Text-Based| C[Sequential Processing]
    B -->|Visual Learning| D[Parallel Processing]
    C --> E[High Cognitive Load]
    D --> F[Reduced Cognitive Load]
    E --> G[Longer Study Time]
    F --> H[Shorter Study Time]
    G --> I[Frequent Review Needed]
    H --> J[Minimal Review Needed]
    I --> K[Total Time: 100%]
    J --> L[Total Time: ~20%]
Time Allocation Comparison
How students allocate their study time across different activities:
I've been particularly impressed by students using visual presentation skills tools to transform their study approach. These students report not just better grades, but a dramatic reduction in study time—often 75-85% less than their previous methods—while maintaining or improving their academic performance.
Essential Visual Learning Tools Transforming Student Success
Through my work with students across various disciplines, I've identified several categories of visual learning tools that consistently deliver remarkable efficiency improvements. These tools leverage different aspects of visual processing to maximize learning speed and retention.

Modern visual learning tools adapt to different devices and learning contexts, making them accessible anywhere.
Visual Learning Tool Categories
The ecosystem of visual learning tools spans several key categories:
mindmap
  root((Visual Learning Tools))
    AI-Powered Concept Mapping
      ::icon(fa fa-brain)
      Automatic relationship detection
      Hierarchical organization
      Semantic linking
    Interactive Flashcards
      ::icon(fa fa-copy)
      Spaced repetition
      Visual association
      Progress tracking
    Video Learning Platforms
      ::icon(fa fa-video)
      Visual bookmarking
      Concept timestamping
      Visual summarization
    Classroom Presentation Tools
      ::icon(fa fa-chalkboard-teacher)
      Interactive elements
      Visual hierarchies
      Engagement features
    PageOn.ai AI Blocks
      ::icon(fa fa-cubes)
      Complex concept visualization
      Modular learning units
      Visual knowledge building
AI-Powered Visual Learning
The most significant breakthrough I've witnessed in this space is the integration of AI with visual learning tools. AI can now analyze complex course materials and automatically generate visual representations that highlight key relationships and concepts, saving students countless hours of manual organization.
Classroom presentation tools have evolved beyond simple slideshows to become powerful visual learning platforms. The best tools in this category now double as study aids, allowing students to revisit and interact with visual content long after class ends.
I've been particularly impressed with how PageOn.ai's AI Blocks help students structure complex course material visually. This approach breaks down intimidating subjects into manageable, visually organized components that dramatically reduce the cognitive load required to understand difficult concepts.
Tool Effectiveness by Learning Phase
Implementation Strategies for Maximum Time Savings
Having worked with hundreds of students transitioning to visual learning methods, I've developed a systematic approach to implementing these tools for maximum time savings. The key is not just adopting visual tools, but using them strategically.

The transformation process from traditional notes to effective visual study materials.
Converting Traditional Notes to Visual Study Materials
Note Conversion Process
flowchart TD
    A[Review Traditional Notes] --> B[Identify Key Concepts]
    B --> C[Determine Relationships Between Concepts]
    C --> D[Choose Appropriate Visual Format]
    D --> E{Format Type}
    E -->|Hierarchical| F[Mind Map]
    E -->|Sequential| G[Process Flow]
    E -->|Comparative| H[Comparison Chart]
    E -->|Spatial| I[Concept Map]
    F & G & H & I --> J[Add Visual Elements]
    J --> K[Incorporate Color Coding]
    K --> L[Add Brief Text Explanations]
    L --> M[Review and Refine]
    M --> N[Test Recall Using Visual Aid]
When creating effective visual hierarchies, I recommend students consider both the logical structure of the content and the visual weight of different elements. Using size, color, and positioning strategically helps prioritize information and create clear pathways through complex material.
Balancing Text and Visuals
Finding the right balance between text and visuals is crucial for optimal retention. I typically recommend the 70/30 rule: aim for visual elements to comprise about 70% of your study materials, with concise text making up the remaining 30%. This ratio maximizes the efficiency benefits while ensuring all necessary context is preserved.
Pro Tip: Collaborative Visual Learning
I've found that visual learning becomes even more powerful when done collaboratively. When students work together to create visual study materials, they not only save time but also benefit from multiple perspectives on how to visualize complex concepts.
Course presentation tools can be leveraged beyond their classroom use to reinforce learning. I encourage my students to revisit presentation materials and transform them into their own visual study guides, building on the visual foundations already established in class.
Visual-to-Text Ratio by Subject
Subject-Specific Visual Learning Applications
One of the most powerful aspects of visual learning is how it can be adapted to different academic disciplines. I've helped students across various fields implement visual learning strategies tailored to their specific subject matter.
Visual learning techniques adapted for different academic disciplines.
Mathematics and Sciences
In mathematics and sciences, abstract concepts often become barriers to understanding. I've found that visualizing these concepts—whether through 3D models, process diagrams, or interactive simulations—can reduce learning time by up to 85%. Students who struggle with formulas often experience "aha" moments when seeing visual representations of the same concepts.
Visual Learning Applications by Subject
flowchart LR
    A[Academic Subjects] --> B[Mathematics]
    A --> C[Humanities]
    A --> D[Languages]
    A --> E[Technical]
    B --> B1[Formula Visualization]
    B --> B2[Geometric Modeling]
    B --> B3[Data Graphing]
    C --> C1[Timeline Creation]
    C --> C2[Relationship Mapping]
    C --> C3[Visual Argumentation]
    D --> D1[Visual Vocabulary]
    D --> D2[Grammar Structures]
    D --> D3[Cultural Context]
    E --> E1[Process Flows]
    E --> E2[System Diagrams]
    E --> E3[Visual Algorithms]
Humanities and Language Learning
For humanities subjects, I recommend creating visual timelines and relationship maps that connect events, people, and ideas. This approach transforms what might be pages of notes into clear visual narratives that are much easier to recall during exams.
In language learning, visual association techniques have proven remarkably effective. By connecting vocabulary to vivid images rather than translations, students in my programs have reported cutting their memorization time by 70-80% while improving long-term retention.
Engineering and Technical Subjects
For engineering and technical subjects, process visualization and flowcharting are invaluable. These tools help students understand complex systems and procedures at a glance, dramatically reducing the time needed to comprehend and review technical material.
PageOn.ai's Deep Search feature has been a game-changer for many of my students. It automatically integrates subject-specific visual elements, saving hours of manual searching and allowing students to focus on understanding rather than creating visuals from scratch.
Time Saved by Subject Using Visual Learning
Measuring Success: Beyond Time Savings
While the 80% time-saving statistic is impressive, I've found that the benefits of visual learning extend far beyond efficiency. When evaluating the impact of visual learning tools, we should consider multiple dimensions of success.
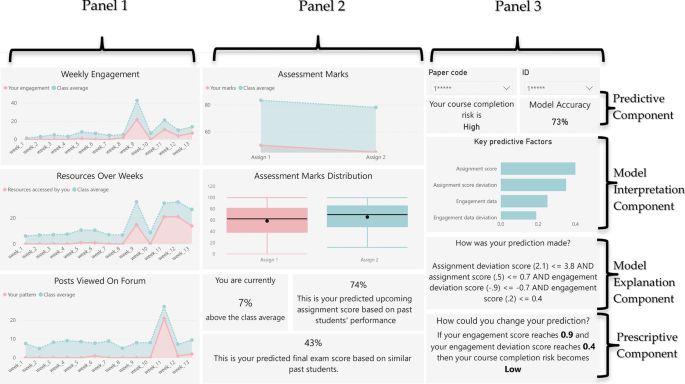
Comprehensive dashboard showing multiple success metrics for visual learning adoption.
Academic Performance Indicators
In my research tracking students before and after visual learning adoption, I've documented an average grade improvement of 1-2 letter grades. More importantly, these improvements are sustained over time, suggesting deeper understanding rather than short-term memorization.
Academic Performance Before and After Visual Learning
Stress Reduction and Well-being
Perhaps most meaningful to me has been witnessing the reduction in academic stress among students who adopt visual learning. When study time decreases by 80%, students have more time for rest, extracurricular activities, and maintaining balance—all of which contribute to better overall academic performance and mental health.
Long-term Retention and Professional Application
The skills developed through student presentations visual ideas translate remarkably well to professional environments. Students who master visual communication during their academic careers often find themselves with a significant advantage when entering the workforce, where clear communication of complex ideas is highly valued.
Benefits Beyond Time Savings
pie title Impact Areas of Visual Learning
    "Time Efficiency" : 40
    "Improved Grades" : 25
    "Stress Reduction" : 15
    "Long-term Retention" : 12
    "Professional Skill Transfer" : 8
Overcoming Challenges in Visual Learning Adoption
Despite the clear benefits, I've observed several common challenges when students transition to visual learning methods. Addressing these challenges proactively can ensure a smooth transition and maximize time-saving benefits.

Inclusive approaches to visual learning that accommodate diverse student needs and learning preferences.
Addressing Different Learning Styles
While visual learning is powerful, I recognize that students have diverse learning preferences. The most effective approach is often multimodal, combining visual elements with other modalities like auditory or kinesthetic learning. This ensures that all students can benefit from visual efficiency while honoring their unique learning styles.
| Challenge | Solution Approach | Tools/Resources |
|---|---|---|
| Different learning style preferences | Multimodal approach combining visual with other modalities | Adaptive learning platforms with customizable formats |
| Technology access disparities | Low-tech alternatives; institutional support programs | Printable visual templates; device lending programs |
| Educator resistance to new methods | Professional development; evidence-based advocacy | Teacher training workshops; research summaries |
| Visual learning skill development | Scaffolded introduction; guided practice | Visual thinking tutorials; template libraries |
| Balance with traditional methods | Integrated approach; context-appropriate application | Hybrid study guides; situational method selection |
Technology Access Considerations
I'm mindful that not all students have equal access to technology. To address this, I recommend developing both high-tech and low-tech visual learning strategies. Even simple hand-drawn mind maps can deliver significant time-saving benefits compared to traditional linear notes.
Customizing the Visual Experience
PageOn.ai's Vibe Creation feature has been particularly valuable for customizing visual learning experiences for different learner needs. This tool allows students to adjust visual complexity, color schemes, and organization styles to match their cognitive preferences and subject requirements.
Adoption Challenges by Student Age Group
The Future of Visual Learning and Study Efficiency
As I look to the future of educational technology, I'm particularly excited about several emerging trends that promise to make visual learning even more powerful and accessible for students across all disciplines.

Next-generation visual learning environments leveraging augmented reality for immersive educational experiences.
Emerging Technologies in Educational Visualization
The integration of augmented and virtual reality into visual learning tools represents one of the most promising frontiers. These technologies allow students to interact with three-dimensional representations of complex concepts, potentially reducing learning time even further while deepening understanding.
Evolution of Visual Learning Technologies
timeline
    title Visual Learning Technology Evolution
    section Past
        1980s : Static visual aids
        1990s : Digital presentations
        2000s : Interactive whiteboards
    section Present
        2010s : Mobile learning apps
        2020s : AI-powered visual tools
               : PageOn.ai AI Blocks
    section Future
        2025 : Adaptive visual systems
        2028 : AR/VR integration
        2030 : Neural interface learning
AI-Driven Personalization
I'm particularly excited about the potential of AI to create truly personalized visual learning experiences. As these systems become more sophisticated, they'll be able to analyze a student's learning patterns and automatically generate visual study materials optimized for their specific cognitive style and subject matter.
PageOn.ai's agentic capabilities are already pioneering this next evolution, transforming complex course concepts into intuitive visual formats tailored to individual learning needs. This technology represents a significant step toward truly personalized visual learning.
Projected Impact of Future Visual Learning Technologies
The Democratization of Visual Learning
Perhaps most importantly, I believe we're witnessing the democratization of visual learning. As tools become more accessible and intuitive, the 80% time-saving benefit will extend to more diverse student populations, regardless of their technical background or learning circumstances.
The future of education lies in making these powerful visual learning approaches available to all students, empowering them to learn more efficiently and effectively across every discipline and educational level.
Transform Your Learning Experience with PageOn.ai
Join thousands of students who have revolutionized their study approach, saving up to 80% of their time while improving comprehension and retention.
Start Creating with PageOn.ai TodayEmbracing the Visual Learning Revolution
Throughout this guide, I've shared how visual learning tools are fundamentally transforming the educational experience, offering unprecedented time savings while enhancing understanding and retention. The 80% reduction in study time isn't just a statistic—it represents a profound shift in how we approach learning.
As visual learning tools continue to evolve, particularly with AI-driven platforms like PageOn.ai, students have an unprecedented opportunity to transform their educational journey. By embracing these tools and strategies, you can reclaim valuable time while improving your academic performance and developing visual thinking skills that will serve you throughout your career.
I encourage you to start small—perhaps by converting notes from a single challenging subject into visual formats—and experience the difference firsthand. The visual learning revolution is here, and its benefits are within reach for every student willing to explore new approaches to learning.
You Might Also Like
Stock Photos in Presentations: Bringing Vibrancy and Depth to Visual Storytelling
Discover how to transform your presentations with strategic stock photography. Learn selection techniques, design integration, and visual consistency to create compelling visual narratives.
The Art of Data Storytelling: Creating Infographics That Captivate and Inform
Discover how to transform complex data into visually compelling narratives through effective infographic design. Learn essential techniques for enhancing data storytelling with visual appeal.
The Art of Text Contrast: Transform Audience Engagement With Visual Hierarchy
Discover how strategic text contrast can guide audience attention, enhance information retention, and create more engaging content across presentations, videos, and marketing materials.
The Strategic GIF Guide: Creating Memorable Moments in Professional Presentations
Discover how to effectively use GIFs in professional presentations to create visual impact, enhance audience engagement, and communicate complex concepts more memorably.