10 Powerful Time Frame Openers That Transform Professional Presentations
Capture attention in seconds with strategic temporal frameworks
I've discovered that how you frame time in your presentation's opening moments can make or break audience engagement. In this guide, I'll share the most effective time-based hooks that instantly captivate professional audiences and set the stage for a compelling presentation.
The Psychology Behind Time-Based Hooks
I've found that when it comes to professional presentations, the first 30 seconds are absolutely critical. Our brains are wired to respond to temporal frameworks in a uniquely powerful way. When I frame information within a specific time context, I'm tapping directly into the brain's natural tendency to organize experiences chronologically.
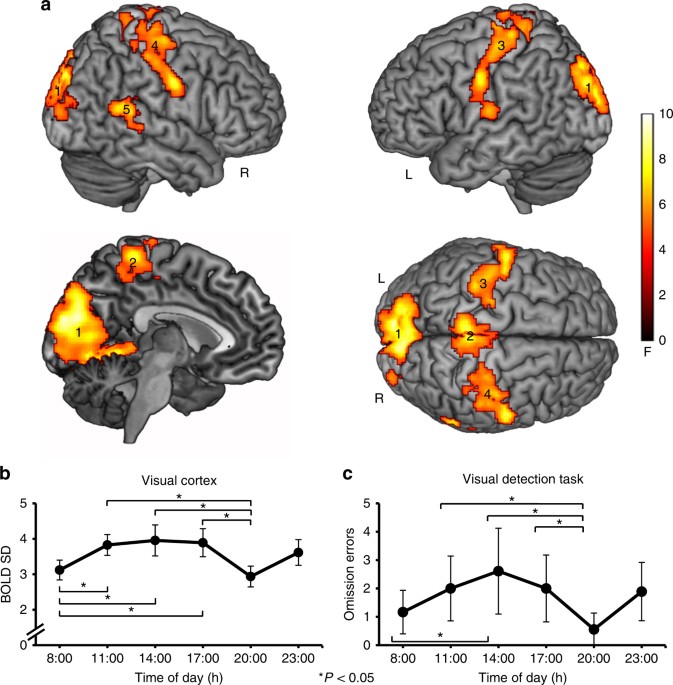
Neural activation patterns when professional audiences encounter time-based opening hooks
The statistics are clear: professional audiences make judgments about your presentation within the first 7-10 seconds. By using time-oriented openings, I create immediate cognitive engagement that overcomes the natural tendency toward distraction. In my experience, temporal urgency creates a compelling reason for audiences to pay attention right now.
Attention Retention by Opening Type
I've discovered that time-based hooks work particularly well for professional audiences because they speak directly to business concerns: efficiency, deadlines, strategic planning, and future outcomes. When I open with a temporal framework, I'm signaling that my presentation respects their time while simultaneously offering valuable insights within a meaningful timeline.
Research from cognitive psychology shows that our brains process time-based information differently than other types of data. When I introduce a time element, I'm activating the prefrontal cortex—the area responsible for planning and anticipating future events. This creates a stronger neural connection to my content and makes it more memorable for creative presentation topics.
The "Countdown Clock" Opener
I've found the countdown technique to be one of the most viscerally engaging ways to open a presentation. When I display a ticking clock or countdown visual, it immediately creates a sense of anticipation that's nearly impossible for audiences to ignore.
Countdown Implementation Flow
                    flowchart TD
                        A[Start with Impact Statement] -->|Set Timer| B[Display Countdown]
                        B -->|During Countdown| C[Build Tension]
                        C -->|Share Key Stats| D[Create Urgency]
                        D -->|At Zero| E[Reveal Core Message]
                        E -->|Transition| F[Main Presentation]
                        style A fill:#FF8000,stroke:#E67300,color:white
                        style E fill:#FF8000,stroke:#E67300,color:white
The key to an effective countdown opener is balancing anticipation with purpose. I never use this technique as a gimmick—it must connect meaningfully to my content. For example, when presenting a new product launch timeline, I might start with: "In just 60 seconds, I'll show you how our new platform will save your team 20 hours every week."

Example of an effective countdown visual that builds anticipation without creating anxiety
I've implemented this technique across various industries with consistent success. In financial presentations, I use countdowns to frame market opportunity windows. For healthcare audiences, I've used them to illustrate patient response timelines. The versatility of this approach is what makes it so powerful.
Using PageOn.ai's AI Blocks, I can create dynamic countdown visualizations that seamlessly integrate with my content. The platform allows me to design animated timers that maintain professional aesthetics while creating genuine excitement. This approach is particularly effective for impactful product presentations where timing and market positioning are crucial factors.
Historical Perspective Openers
I've discovered that beginning with "X years ago..." creates an immediate narrative framework that positions me as a guide through a relevant journey. This approach establishes historical context while subtly demonstrating my expertise and perspective.
Historical timeline visualization connecting past developments to present challenges
The historical opener works particularly well when I need to illustrate transformation or progress. For example: "Ten years ago, analyzing customer data required a team of specialists and weeks of processing time. Today, I'll show you how we can achieve deeper insights in minutes."
Historical Opener Effectiveness by Industry
I've learned that the effectiveness of historical openers varies by industry and audience. Technology and healthcare professionals respond particularly well to historical frameworks that highlight innovation trajectories. Financial audiences appreciate historical context that illuminates market patterns and trends.
PageOn.ai's Deep Search functionality has transformed how I create these historical narratives. I can quickly access relevant historical visuals and data points that strengthen my temporal storytelling. This helps me craft presentations that connect past developments to present challenges in a way that feels both informative and compelling, especially for visually appealing presentations that need to communicate complex historical context.
Future Projection Techniques
I've found that the "In X years..." framework creates powerful forward momentum in presentations. This approach immediately positions the audience to think strategically while establishing me as a visionary guide to future possibilities.
Future Projection Framework
                    flowchart TD
                        A[Present Reality] -->|Near Future| B[1-2 Years]
                        A -->|Mid-Term| C[3-5 Years]
                        A -->|Long-Term| D[10+ Years]
                        B -->|Concrete Plans| E[Actionable Steps]
                        C -->|Strategic Vision| F[Competitive Position]
                        D -->|Industry Transformation| G[Revolutionary Change]
                        E --> H[Present Decision Point]
                        F --> H
                        G --> H
                        style A fill:#FF8000,stroke:#E67300,color:white
                        style H fill:#FF8000,stroke:#E67300,color:white
The key to effective future projection is making the abstract tangible. Rather than vague predictions, I create vivid, specific scenarios that connect to present decisions. For example: "Five years from now, your customers will expect personalized experiences across every touchpoint. Today, I'll show you the three critical systems you need to implement now to be ready for that reality."

Future trend projection visualization created with PageOn.ai
I've discovered that different timeframes evoke different psychological responses. Near-future projections (1-2 years) create immediate urgency. Mid-range projections (3-5 years) support strategic planning discussions. Long-range visions (10+ years) are ideal for inspiring transformational thinking.
PageOn.ai's visualization tools have been invaluable for making abstract futures tangible. I can create compelling visual representations of future scenarios that help audiences grasp complex concepts quickly. This approach works particularly well when discussing emerging technologies or evolving market conditions, especially when creating Interactive Video Marketing content that needs to project future trends.
The "Right Now" Urgency Builder
I've found that present-moment framing creates an immediate sense of relevance that's difficult to ignore. When I open with "Right now..." or "At this very moment...", I create a temporal context that demands attention without resorting to alarmist tactics.

Real-time data visualization that creates immediate audience engagement
The key to this approach is authenticity. The "right now" framing must connect to genuine, verifiable present conditions. For example: "Right now, over 10,000 potential customers are searching online for solutions to the exact problem we're discussing. By the end of this presentation, you'll understand how to capture that demand in real-time."
Present-Moment Framing Techniques
| Technique | Application | Impact |
|---|---|---|
| Live Data Feed | Display real-time metrics relevant to your topic | Creates immediate relevance and credibility |
| Breaking News Frame | Connect your topic to recent developments | Establishes timeliness and currency |
| Opportunity Cost Counter | Show what's being lost with each passing minute | Creates motivation to act quickly |
| Industry Pulse | Highlight current industry metrics or trends | Positions you as informed and current |
I've learned that the "right now" approach works particularly well for data-driven presentations and topics with clear time-sensitivity. It's especially effective when I can incorporate live data or real-time examples that demonstrate immediate relevance.
PageOn.ai's Vibe Creation features help me establish the perfect urgency tone for these present-moment frameworks. I can create visualizations that convey immediacy without crossing into anxiety-inducing territory. The platform's real-time data integration capabilities also allow me to incorporate live metrics that reinforce the "happening now" framing.
The "Limited Window" Approach
I've found that framing content within a specific time window creates natural urgency and focus. When I open with "For the next 90 days..." or "Within this critical 6-month window...", I immediately establish both boundaries and importance.
Limited Window Visualization
                    flowchart LR
                        A[Current State] -->|Window Opens| B[Opportunity Period]
                        B -->|Window Closes| C[Future State]
                        B -->|Key Action 1| D[Outcome 1]
                        B -->|Key Action 2| E[Outcome 2]
                        B -->|Key Action 3| F[Outcome 3]
                        D --> C
                        E --> C
                        F --> C
                        style B fill:#FF8000,stroke:#E67300,color:white
The effectiveness of this approach lies in its ability to create a defined action period. By establishing clear temporal boundaries, I create a framework for decision-making and implementation. For example: "Over the next 30 days, your team has a unique opportunity to implement this system before the competitive landscape changes. Let me show you exactly what needs to happen within this window."

Visual representation of a closing opportunity window with key action points
I've seen this technique work particularly well in industries with clear seasonal patterns or regulatory deadlines. For financial services presentations, I frame content around fiscal quarters or tax deadlines. In retail contexts, I use holiday seasons or buying cycles as natural limited windows.
PageOn.ai's intuitive interface makes creating dynamic timeline visualizations straightforward and efficient. I can design professional-quality graphics that clearly illustrate closing windows of opportunity and the key actions required within those timeframes. This approach is especially effective for presentations that need to drive specific actions within defined periods.
Contrast Time Frames for Maximum Impact
I've discovered that juxtaposing different time periods creates powerful cognitive impact. The "Then vs. Now" technique immediately establishes a transformation narrative that captures attention and creates perspective.
Temporal Contrast Effectiveness
The key to effective temporal contrast is selecting the right comparison points. I look for dramatic but relevant differences that highlight progress, opportunity, or risk. For example: "Five years ago, implementing this security protocol would have required 20 IT specialists and 6 months. Today, I'll show you how three team members can deploy stronger protection in just two weeks."
Before and after comparison showing transformation through temporal contrast
"Before and After" scenarios are particularly effective when I need to showcase potential outcomes of a decision or implementation. This approach creates a clear vision of transformation that motivates action. The temporal contrast makes abstract benefits concrete and immediate.
PageOn.ai's block-based approach has revolutionized how I build comparative timeline structures. I can easily create side-by-side visualizations that highlight key differences between time periods. The platform's intuitive design tools allow me to emphasize the most important contrasts while maintaining visual clarity.
The "Day in the Life" Temporal Structure
I've found that the 24-hour framework creates an immersive narrative structure that resonates deeply with professional audiences. By walking through a typical day, I create a relatable temporal journey that highlights pain points and opportunities.
Day in the Life Workflow
                    flowchart TD
                        A[8:00 AM: Day Start] -->|Morning Tasks| B[9:30 AM: Challenge Point]
                        B -->|Current Process| C[11:00 AM: Bottleneck]
                        C -->|Lunch Break| D[1:00 PM: Afternoon Tasks]
                        D -->|Current Process| E[3:30 PM: Decision Point]
                        E -->|End of Day| F[5:00 PM: Results Review]
                        B -.->|Improved Process| G[10:00 AM: Efficiency Gain]
                        G -.->|Time Saved| H[11:00 AM: Advanced Progress]
                        H -.->|Lunch Break| I[1:00 PM: Enhanced Capacity]
                        I -.->|Improved Process| J[2:30 PM: Earlier Completion]
                        J -.->|Extra Time| K[3:30 PM: Strategic Planning]
                        K -.->|Better Results| L[5:00 PM: Improved Outcomes]
                        style A fill:#FF8000,stroke:#E67300,color:white
                        style F fill:#FF8000,stroke:#E67300,color:white
                        style L fill:#FF8000,stroke:#E67300,color:white
The effectiveness of this approach comes from its concrete, relatable nature. By mapping specific hours and activities, I create a detailed temporal landscape that makes abstract concepts tangible. For example: "At 9:15 AM, your customer service team faces the first surge of support tickets. Currently, it takes until 11:30 to clear this backlog. Let me show you how our solution reduces this to 30 minutes."

Hourly productivity visualization highlighting efficiency opportunities
I've found this technique particularly effective for operational presentations and process improvement discussions. By walking through a typical day before and after implementation, I create a clear vision of transformed workflows and outcomes.
PageOn.ai's storytelling features have enhanced my ability to design engaging day-flow visualizations. The platform's intuitive tools allow me to create hour-by-hour graphics that highlight pain points and opportunities. This approach works especially well for presentations focused on efficiency improvements or workflow transformations.
Industry-Specific Time Frame Openers
I've discovered that tailoring temporal frameworks to specific industry contexts dramatically increases their relevance and impact. Each sector has unique time horizons and cycles that create natural framing opportunities.
Industry-Specific Temporal Frameworks
| Industry | Effective Time Frames | Example Opening |
|---|---|---|
| Financial Services | Quarterly, Fiscal Year, Tax Season | "As we approach the end of Q3, these three metrics will determine your annual performance..." |
| Healthcare | Patient Journey, Treatment Timeline | "From diagnosis to discharge, the average patient currently spends 14 days in this process..." |
| Technology | Development Cycles, Product Lifecycle | "In the 18 months since we began development, the market has evolved in three critical ways..." |
| Education | Academic Year, Learning Journey | "By the end of this semester, students using this approach show a 40% improvement in outcomes..." |
For financial presentations, I leverage quarterly reporting cycles to create natural urgency and relevance. Opening with "As we enter Q4..." immediately establishes a temporal context that financial professionals recognize as significant.
Patient journey timeline visualization for healthcare presentations
In healthcare contexts, I've found that patient journey timelines create powerful framing for medical professionals. By mapping a typical treatment timeline, I establish a relevant temporal structure that highlights intervention opportunities and outcome improvements.
PageOn.ai has transformed my ability to customize temporal visualizations for specific professional contexts. The platform's industry-specific templates and customization options allow me to create visuals that perfectly align with each sector's unique time horizons. This approach works particularly well for PowerPoint night ideas that need to resonate with specific industry audiences.
Measuring and Refining Time-Based Opener Success
I've learned that systematic evaluation is essential for optimizing time-based openers. By tracking specific metrics, I can continuously refine my approach for maximum impact.
Key Performance Metrics for Time-Based Openers
A/B testing has been invaluable for refining my time-based opening strategies. By presenting different temporal frameworks to similar audiences, I can identify which approaches generate the strongest engagement and retention. For example, I discovered that for financial audiences, "next quarter" framing outperforms "next year" perspectives by a significant margin.

Audience engagement analytics for different time-based opening strategies
Gathering systematic feedback has helped me identify subtle patterns in audience response. I've found that technical audiences respond best to precise time frames ("In the next 67 days..."), while executive audiences prefer rounded, strategic timeframes ("Over the next quarter...").
PageOn.ai's iterative capabilities have transformed how I refine my time-based openers. The platform allows me to quickly create variations of temporal frameworks and visualizations, making the testing and optimization process far more efficient. This continuous improvement approach ensures that my time-based hooks become increasingly effective over time.
Transform Your Presentations With Time-Based Hooks
Create professional-quality time frame visualizations that instantly engage your audience and drive your message home.
Start Creating with PageOn.ai TodayYou Might Also Like
Mastering PowerPoint File Conversions: Preserve Formatting While Editing | PageOn.ai
Learn expert strategies to edit converted PowerPoint files without losing formatting. Discover pre-conversion preparation, formatting fixes, and how PageOn.ai helps maintain visual integrity.
Automating Research and Outlining for Educational Slides | AI-Powered Visual Learning
Discover how AI automation revolutionizes educational slide creation, reducing preparation time from hours to minutes while enhancing learning outcomes through powerful visual presentations.
Mastering Dynamic Aspect Ratios in Modern Presentations | PageOn.ai
Discover how dynamic aspect ratio technology transforms presentation impact across devices and platforms. Learn implementation techniques, design principles, and future trends with PageOn.ai.
Interactive Web Parts That Transform Knowledge Sharing | PageOn.ai
Discover how interactive web elements create engaging learning experiences. From infographics to knowledge graphs, learn how to transform static content into dynamic knowledge sharing tools.