Elevating Your Message: Advanced Visual Customization for Impactful Professional Presentations
Transform your presentations from ordinary to extraordinary with strategic visual techniques
In today's high-stakes business environment, the difference between a forgettable presentation and one that drives decisions often comes down to visual execution. I've found that mastering advanced visual customization techniques isn't just about aesthetics—it's about strategic communication that resonates with professional audiences and amplifies your core message.
The Evolution of Presentation Visuals in Professional Settings
I've witnessed a remarkable transformation in how we approach presentation design over the past decade. What was once a landscape dominated by bullet points and clip art has evolved into a sophisticated visual medium where strategic design choices directly impact audience engagement and message retention.
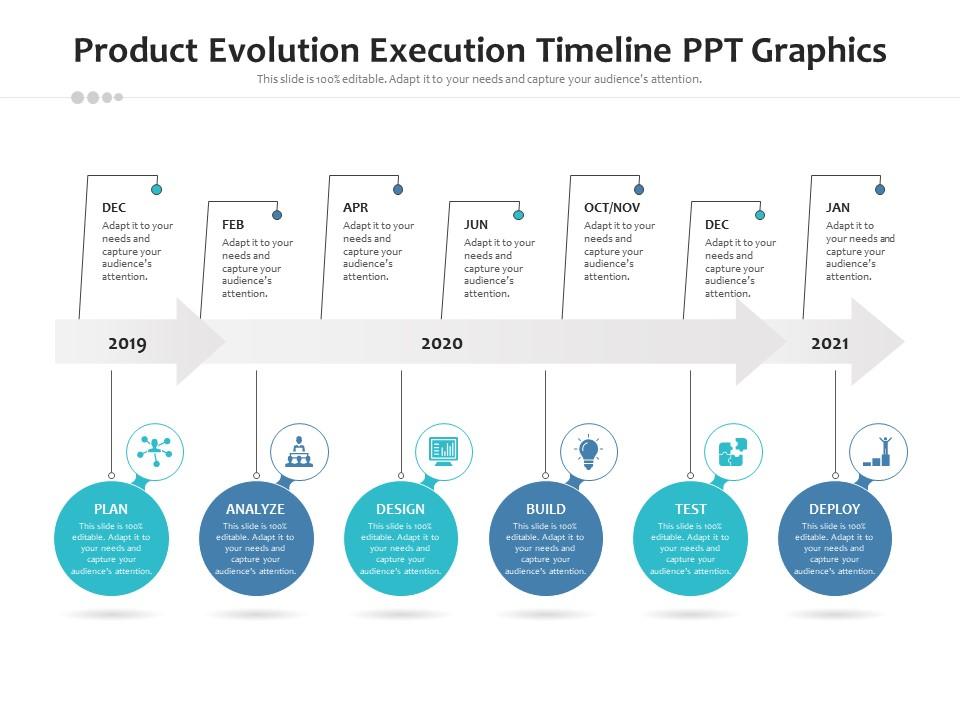
The evolution of presentation design from 2000 to 2023
The Psychology of Visual Processing
I've found that understanding the psychological foundations of visual processing is crucial for effective presentation design. Our brains process visual information 60,000 times faster than text, making strategic visuals not just decorative elements but powerful communication tools. When I design presentations for executive audiences, I'm particularly mindful of how visual elements can reduce cognitive load while increasing information retention.
Visual Processing Speed vs. Text
Design Trends Reshaping Expectations
In 2023, I'm seeing several design trends that are fundamentally changing what audiences expect from professional presentations:
- Minimalist design with purposeful visual elements
- Data visualization that tells a story rather than simply displaying numbers
- Immersive experiences through subtle animation and interactivity
- Custom illustrations that differentiate from stock imagery
- Accessibility-focused design considerations
AI-Powered Transformation
I've been particularly excited about how AI tools are democratizing advanced design capabilities. What once required specialized design skills can now be accomplished through auto generated presentations enhancement technologies. These tools analyze content and suggest visual approaches that align with presentation goals, making sophisticated design accessible to non-designers.
Brand Consistency vs. Visual Innovation
One of the most delicate balances I navigate is maintaining brand consistency while introducing enough visual innovation to keep presentations engaging. Corporate design systems provide necessary guardrails, but I've found that allowing for controlled creative expression within those boundaries produces the most compelling results.
Core Elements of Advanced Visual Customization
In my experience, mastering the fundamental elements of visual design provides the foundation for all advanced customization techniques. These core principles serve as the building blocks for creating presentations that not only look professional but strategically communicate your message.
Visual Hierarchy Framework
Understanding how the eye processes visual information helps structure slide elements for maximum impact:
                    flowchart TD
                        A[Visual Hierarchy] --> B[Size]
                        A --> C[Color]
                        A --> D[Contrast]
                        A --> E[Alignment]
                        A --> F[Proximity]
                        A --> G[Repetition]
                        B --> H[Primary Elements]
                        C --> H
                        D --> H
                        E --> I[Secondary Elements]
                        F --> I
                        G --> I
                        H --> J[Audience Attention]
                        I --> J
                        style A fill:#FF8000,stroke:#333,stroke-width:2px
                        style H fill:#66BB6A,stroke:#333,stroke-width:1px
                        style I fill:#42A5F5,stroke:#333,stroke-width:1px
                        style J fill:#E57373,stroke:#333,stroke-width:1px
Color Psychology and Strategic Palette Selection
I've learned that color choices are never arbitrary in professional presentations. Each color evokes specific psychological responses and carries cultural associations that can either reinforce or undermine your message. Moving beyond basic templates means developing intentional color strategies.

Strategic color palettes with their emotional associations for different presentation contexts
Color Associations in Professional Contexts
Typography as a Visual Element
I approach typography not just as text but as a critical visual component. Font pairing—combining complementary typefaces for headings and body text—creates visual interest while maintaining readability. When I work on professional visual presentation in powerpoint, I'm particularly mindful of scaling typography to establish clear hierarchies.
Serif + Sans-Serif Pairing
Creates classical contrast while maintaining professionalism. Ideal for financial, legal, or traditional industry presentations.
Bold Sans + Light Sans Pairing
Creates modern contrast through weight variation. Perfect for tech, design, or contemporary business presentations.
Composition Frameworks
The rule of thirds has become my go-to framework for slide composition. By dividing the slide into a 3×3 grid and placing key elements along the intersection points, I create more dynamic and engaging layouts than centered compositions.
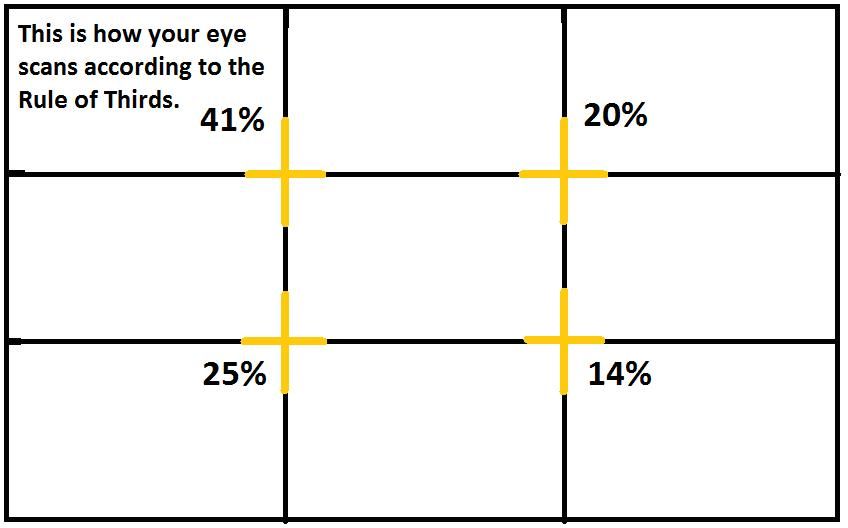
Rule of thirds applied to slide design for optimal visual impact
Whitespace as a Design Element
I've found that one of the most common mistakes in presentation design is treating whitespace (or negative space) as empty real estate to be filled. Instead, I use whitespace deliberately to create breathing room, direct attention, and elevate the perceived quality of the presentation.
Visual Continuity
When creating complex presentations that span multiple topics or sections, I focus on visual continuity to help the audience maintain context. This might include consistent color coding for specific themes, recurring visual motifs that evolve throughout the presentation, or transitional slides that visually signal topic shifts.
Beyond Static Slides: Dynamic Visual Techniques
In my experience, the most memorable presentations transcend static slides to create dynamic visual experiences. Motion, interaction, and narrative flow can transform passive viewing into active engagement with your content.
Animation Principles That Enhance Your Message
I approach animation not as decoration but as a communication tool. When used strategically, animation can:
- Direct audience attention to specific elements in a logical sequence
- Illustrate processes or relationships that are difficult to convey statically
- Create memorable moments that anchor key points in audience memory
- Provide cognitive breaks during information-dense presentations
Strategic Animation Decision Framework
A decision tree for determining when and how to use animation:
                    flowchart TD
                        A[Animation Decision] -->|Purpose?| B{Enhance Understanding?}
                        B -->|Yes| C[Process Visualization]
                        B -->|No| D{Create Emphasis?}
                        D -->|Yes| E[Sequential Reveal]
                        D -->|No| F{Transition Between Ideas?}
                        F -->|Yes| G[Smooth Transition Effect]
                        F -->|No| H[Consider Static Alternative]
                        C --> I[Use Motion to Show Process Flow]
                        E --> J[Use Subtle Fade/Scale for Key Points]
                        G --> K[Use Consistent Transition Style]
                        style A fill:#FF8000,stroke:#333,stroke-width:2px
                        style B fill:#42A5F5,stroke:#333,stroke-width:1px
                        style D fill:#42A5F5,stroke:#333,stroke-width:1px
                        style F fill:#42A5F5,stroke:#333,stroke-width:1px
                        style I fill:#66BB6A,stroke:#333,stroke-width:1px
                        style J fill:#66BB6A,stroke:#333,stroke-width:1px
                        style K fill:#66BB6A,stroke:#333,stroke-width:1px
                        style H fill:#E57373,stroke:#333,stroke-width:1px
Transitional Elements for Visual Storytelling
I've found that thoughtful transitions between slides can transform a collection of information into a cohesive visual story. These transitional elements create a sense of journey and help the audience maintain context as you move between topics.

Visual transition sequence showing how elements can create narrative continuity
Interactive Elements for Engagement
When appropriate for the presentation context, I incorporate interactive elements to transform passive viewing into active participation. This might include:
- Clickable navigation that allows for non-linear exploration of content
- Interactive data visualizations that reveal additional insights on interaction
- Embedded polls or questions that gather real-time audience input
- Expandable sections that provide optional detail for interested audience members
Data Visualization Approaches
I believe that data visualization should illuminate insights, not just display numbers. Advanced customization techniques allow me to transform standard charts into compelling visual stories that guide the audience to the most important conclusions.
Audience Engagement by Visualization Type
Leveraging AI Blocks for Fluid Transitions
I've been particularly impressed with how PageOn.ai's AI Blocks feature allows me to create fluid transitions between complex visual concepts. By breaking down sophisticated ideas into modular visual components, I can build presentations that gradually unveil complexity in digestible segments.
Converting Data Points into Visual Narratives
One of the most powerful techniques I've developed is transforming abstract data into visual narratives. Rather than presenting isolated statistics, I create visual stories that connect data points to real-world implications. This approach makes complex information more accessible and memorable for audiences across different expertise levels.
Customization Strategies for Different Presentation Types
I've learned that effective visual customization requires understanding the unique demands of different presentation types. What works brilliantly for data-heavy financial presentations may fall flat in conceptual strategy sessions, and vice versa.
Presentation Type Visual Strategy Framework
Different presentation types require different visual approaches:
                    flowchart TD
                        A[Presentation Type] --> B[Data-Heavy]
                        A --> C[Conceptual/Strategic]
                        A --> D[Persuasive]
                        B --> E[Focus: Clarity & Insight]
                        C --> F[Focus: Understanding & Context]
                        D --> G[Focus: Emotion & Action]
                        E --> H[Custom Charts
Data Callouts
Progressive Disclosure]
                        F --> I[Visual Metaphors
Conceptual Frameworks
Strategic Roadmaps]
                        G --> J[Contrast & Comparison
Emotional Imagery
Clear Call-to-Action]
                        style A fill:#FF8000,stroke:#333,stroke-width:2px
                        style B fill:#42A5F5,stroke:#333,stroke-width:1px
                        style C fill:#66BB6A,stroke:#333,stroke-width:1px
                        style D fill:#E57373,stroke:#333,stroke-width:1px
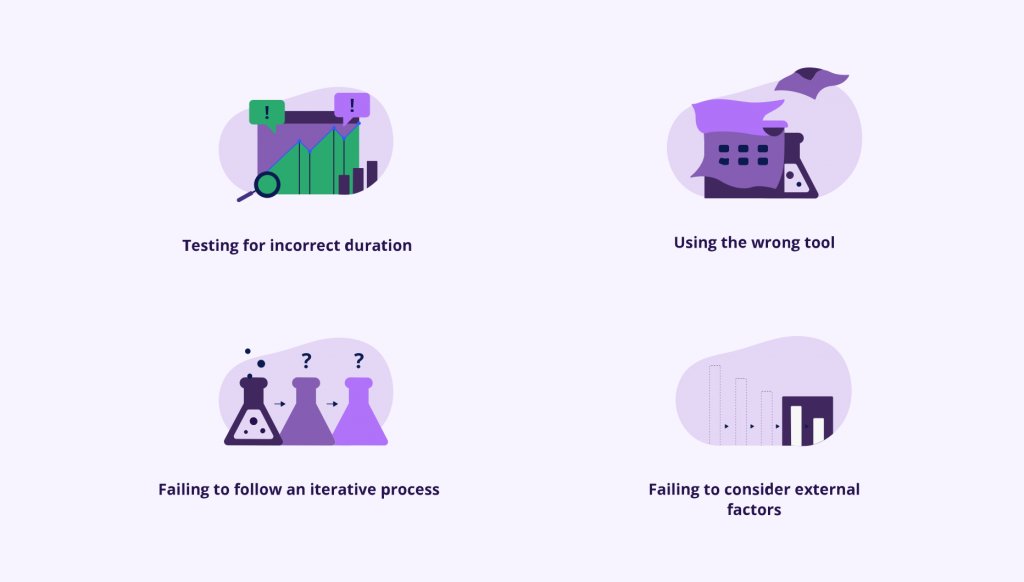
Data-Heavy Presentations
When I'm working with data-intensive presentations, my primary goal is transforming complexity into clarity without sacrificing accuracy. This requires specialized techniques to make data both accessible and compelling.
Transforming Complex Datasets into Scannable Visuals
I've developed several techniques for making complex data immediately understandable:
- Progressive data reveals that build complexity gradually
- Visual hierarchies that highlight the most important metrics
- Contextual annotations that explain significance directly within visualizations
- Comparative benchmarks that provide immediate context for numbers

Before and after: Transforming complex data into clear visual insights
Custom Chart Creation Beyond Default Options
I regularly go beyond standard chart types to create custom visualizations that perfectly match the story the data is telling. This might include:
Hybrid Charts
Combining multiple chart types (like overlaying a line chart on bar charts) to show relationships between different data sets.
Small Multiples
Creating arrays of mini-charts that allow for quick comparison across categories or time periods.
Proportional Area Charts
Using size to represent quantity in ways that are more intuitive than standard pie charts.
Custom Axes and Scales
Modifying standard charts with custom scales, log axes, or dual-axis approaches to highlight specific patterns.
Conceptual and Strategic Presentations
When presenting abstract concepts or strategic frameworks, I focus on visualization techniques that ground theoretical ideas in familiar visual territory. These presentations often require different approaches than data-heavy content.
Visualization Techniques for Abstract Concepts
I've found that visual aids in presentations are particularly crucial when dealing with abstract concepts. Some of my favorite approaches include:
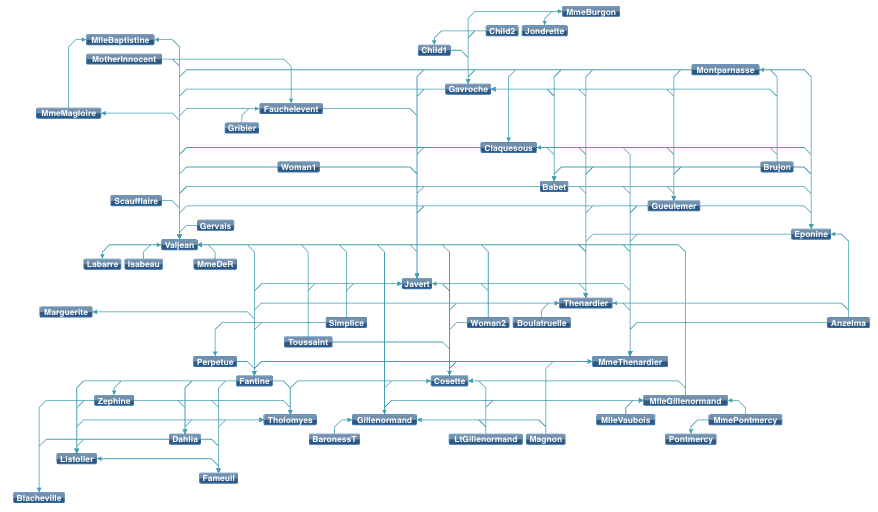
Visualization of an abstract strategic framework using metaphorical elements
Metaphor-Based Graphics
I regularly use visual metaphors to make abstract concepts more concrete and relatable. By connecting unfamiliar ideas to familiar visual territory, I help audiences grasp complex concepts more quickly. For example, I might visualize:
- Organizational transformation as a caterpillar-to-butterfly metamorphosis
- Market penetration strategy as a mountain climbing expedition
- System architecture as a city infrastructure with different neighborhoods and connections
- Customer journey as an actual journey with landmarks and pathways
Persuasive Presentations
When my goal is to persuade rather than simply inform, I employ specific visual techniques designed to build emotional connection and drive action. These presentations require careful attention to the psychological impact of visual choices.
Visual Storytelling Structures
I structure persuasive presentations around classic storytelling frameworks, using visual presentations to guide the audience through a narrative arc. This might include:
Emotional Impact of Different Visual Elements
Creating Visual Contrast
One of my most effective persuasive techniques is using visual contrast to highlight problems and solutions. I might use:
- Dark, muted colors for problem states versus bright, vibrant colors for solutions
- Cluttered, complex visuals to represent current challenges versus clean, simple visuals for the proposed approach
- Static imagery for status quo versus dynamic, forward-moving visuals for the recommended path
I've found that PageOn.ai's Vibe Creation feature is particularly valuable for developing compelling visual narratives that resonate emotionally with audiences. The tool helps me establish consistent emotional tones that subtly reinforce key messages throughout the presentation.
Advanced Tools and Techniques for Professional Customization
As I've evolved my presentation design practice, I've expanded my toolkit beyond standard software to include specialized tools and techniques that enable more sophisticated visual customization.
Beyond Standard Software
While mainstream presentation software provides a solid foundation, I often supplement with specialized tools for specific visual needs:
Data Visualization Tools
Specialized tools like Tableau or Power BI for creating sophisticated data visualizations that can be imported into presentations.
Vector Graphics Editors
Tools like Adobe Illustrator or Figma for creating custom illustrations and icons that perfectly match presentation concepts.
AI-Powered Design Assistants
New generation tools like PageOn.ai that can transform content intentions into polished visual expressions.
Integrating Vector Graphics and Custom Illustrations
I've found that custom illustrations and vector graphics can dramatically elevate presentation quality. Unlike stock imagery, custom visuals can be precisely tailored to your specific concepts and brand identity.

The evolution of a custom illustration from concept sketch to final presentation graphic
Leveraging AI Capabilities
The emergence of AI-powered design tools has transformed my workflow. PageOn.ai's agentic capabilities allow me to express my presentation intent in natural language and receive polished visual options that would have previously required hours of manual design work.
AI-Assisted Design Workflow
How PageOn.ai transforms presentation intent into polished visuals:
                    flowchart LR
                        A[Content Intent] -->|Natural Language Input| B[AI Processing]
                        B -->|Content Analysis| C[Visual Strategy]
                        C -->|Style Application| D[Design Generation]
                        D -->|Refinement| E[Polished Visuals]
                        E -->|Feedback Loop| B
                        style A fill:#FF8000,stroke:#333,stroke-width:2px
                        style B fill:#42A5F5,stroke:#333,stroke-width:1px
                        style E fill:#66BB6A,stroke:#333,stroke-width:1px
Time-Saving Customization Workflows
For professionals under deadline pressure, I've developed efficient workflows that maximize visual impact while minimizing production time:
- Create a visual language guide at the project start that defines key styles, colors, and visual motifs
- Develop a slide master with component library containing pre-styled elements that can be quickly assembled
- Use batch processing techniques for applying consistent treatments across multiple slides
- Leverage AI tools like PageOn.ai to rapidly generate initial design concepts
- Implement progressive enhancement by starting with a minimal viable design and adding sophistication as time permits
Template Customization Strategies
While templates can provide useful starting points, I've developed specific techniques for customizing them to avoid the "seen-it-before" template look:
Template Customization Impact
I've found that the most effective approach is often a hybrid one—starting with a template for efficiency but applying significant customization to align with brand identity and specific presentation goals.
Implementation: From Concept to Polished Presentation
Having the right visual customization techniques is only half the battle—implementing them efficiently and effectively is equally important. I've developed systematic approaches to move from concept to polished presentation with minimal friction.
Workflow Strategies for Efficient Visual Customization
My implementation workflow typically follows these phases:
Visual Customization Workflow
A systematic approach to implementing visual customization:
                    flowchart LR
                        A[Content Audit] --> B[Visual Strategy]
                        B --> C[Style Framework]
                        C --> D[Component Design]
                        D --> E[Assembly & Integration]
                        E --> F[Refinement & Testing]
                        style A fill:#FF8000,stroke:#333,stroke-width:2px
                        style B fill:#FF8000,stroke:#333,stroke-width:2px
                        style C fill:#42A5F5,stroke:#333,stroke-width:1px
                        style D fill:#42A5F5,stroke:#333,stroke-width:1px
                        style E fill:#66BB6A,stroke:#333,stroke-width:1px
                        style F fill:#66BB6A,stroke:#333,stroke-width:1px
Within this framework, I focus on creating reusable components and establishing clear visual patterns early in the process. This approach allows for rapid assembly while maintaining visual consistency.
Quality Control Processes
To ensure visual consistency across presentations, I implement these quality control processes:
Visual Audit Checklist
A systematic review of all visual elements against established style guidelines to catch inconsistencies.
Presentation Rhythm Analysis
Evaluating the pacing and visual flow of the presentation to ensure appropriate variation and consistency.
Accessibility Screening
Testing color contrast, text size, and other elements to ensure the presentation is accessible to all audience members.
Cross-Device Testing
Reviewing the presentation on multiple devices and screen sizes to ensure visual elements display as intended.
Adaptation Techniques for Different Delivery Formats
I've found that effective presentations require format-specific optimizations:

Adaptation of visual elements for different delivery formats
In-Person Presentations
- Higher contrast ratios for variable lighting conditions
- Simplified visuals visible from the back of the room
- Strategic use of builds and reveals to maintain attention
Virtual Presentations
- More frequent visual changes to maintain engagement
- Greater detail possible due to viewers' proximity to screens
- Interactive elements that leverage digital delivery
Hybrid Presentations
- Dual-optimized visuals that work for both in-room and remote viewers
- Engagement techniques that include both audience segments
- Backup visual options for technical contingencies
Using PageOn.ai for Rapid Iteration
One of the most transformative aspects of my workflow has been using PageOn.ai to rapidly iterate through visual concepts without technical barriers. I can now:
- Generate multiple visual approaches to the same content in minutes rather than hours
- Quickly test different visual metaphors to see which best conveys complex concepts
- Iterate based on stakeholder feedback without extensive manual redesign
- Create consistent visual systems across extensive presentation decks
Collaborative Visual Development
For team presentations, I implement collaborative visual development approaches that maintain consistency while leveraging diverse perspectives. This typically involves creating a shared visual language document, establishing component libraries that team members can use, and implementing regular visual alignment sessions to ensure the final presentation has a cohesive look and feel despite having multiple contributors.
Measuring Visual Effectiveness and Continuous Improvement
I believe that truly advanced visual customization requires not just implementation but measurement and refinement. By systematically evaluating the effectiveness of visual choices, I can continuously improve my approach and deliver increasingly impactful presentations.
Audience Feedback Mechanisms
I use several approaches to gather specific feedback on visual impact:
Post-Presentation Surveys
Targeted questions about which visuals were most memorable and effective.
Heat Mapping
For digital presentations, tracking where viewers focus attention on slides.
Facilitated Feedback Sessions
Structured discussions with key stakeholders about visual effectiveness.
Retention Testing
Follow-up questions to determine which visually-presented information was retained.
Analytics Approaches for Digital Presentations
For presentations delivered digitally, I leverage analytics to measure engagement:
Visual Engagement Metrics
A/B Testing Frameworks
For critical presentations, I sometimes implement A/B testing to refine visual approaches:
A/B testing different visual approaches with audience feedback metrics
This approach is particularly valuable when:
- The presentation will be delivered multiple times to similar audiences
- The stakes are high (major sales pitch, investor presentation, etc.)
- There are competing theories about which visual approach will be most effective
- You have access to representative audience members for testing
Building a Personal Visual Language
Over time, I've developed a personal visual language that evolves with my professional growth. This consists of:
- A curated collection of visual approaches that I know work for specific types of content
- Signature visual elements that subtly brand my presentations
- A consistent approach to certain visual challenges (like data visualization or concept illustration)
- An evolving set of visual principles that guide my design decisions
I find that having this personal visual language makes me more efficient while creating a distinctive style that audiences come to recognize and associate with quality content.
Using PageOn.ai for Visual Refinement
PageOn.ai has become an invaluable tool in my continuous improvement process. The platform's capabilities allow me to quickly implement visual refinements based on feedback, experimenting with multiple approaches without the time investment traditionally required for design iterations.
I particularly value the ability to:
- Generate variations on successful visual approaches to keep presentations fresh
- Quickly adapt visuals based on audience feedback
- Test different visual metaphors for complex concepts
- Create consistent visual systems that can evolve based on performance data
By combining systematic measurement with tools that enable rapid refinement, I've been able to continuously improve the effectiveness of my visual presentations over time, creating increasingly powerful visual experiences that drive understanding and action.
Transform Your Visual Expressions with PageOn.ai
Ready to take your presentation visuals from ordinary to extraordinary? PageOn.ai provides the intelligent tools you need to create stunning visual customizations without specialized design skills. From data visualizations to conceptual frameworks, our AI-powered platform helps you communicate complex ideas with clarity and impact.
Conclusion: The Future of Visual Customization
As I look to the future of presentation design, I see visual customization becoming increasingly important as audiences grow more sophisticated and attention spans more selective. The professionals who will stand out are those who can harness both design principles and emerging technologies to create visual experiences that truly resonate.
The most exciting development I see is the democratization of advanced design capabilities through AI-powered tools like PageOn.ai. These platforms are removing technical barriers, allowing professionals to focus on strategic communication rather than technical execution. As these tools continue to evolve, I expect we'll see even more innovative approaches to visual customization that enhance understanding, engagement, and retention.
Whether you're creating data-heavy financial presentations, conceptual strategy decks, or persuasive sales pitches, investing in advanced visual customization techniques will continue to provide a competitive edge in professional settings. The principles and approaches I've shared here provide a foundation, but the most powerful presentations will come from those who continue to experiment, measure, and refine their visual approach over time.
You Might Also Like
Mastering Visual Harmony: The Art and Science of Cohesive Slide Layouts
Discover how to create visually harmonious slide layouts through color theory, typography, and spatial design. Learn professional techniques to elevate your presentations with PageOn.ai.
Revolutionizing Slides: The Power of AI Presentation Tools | PageOn.ai
Discover how AI presentation tools are transforming slide creation, saving hours of work while enhancing design quality. Learn how PageOn.ai can help visualize your ideas instantly.
Stock Photos in Presentations: Bringing Vibrancy and Depth to Visual Storytelling
Discover how to transform your presentations with strategic stock photography. Learn selection techniques, design integration, and visual consistency to create compelling visual narratives.
Bringing Google Slides to Life with Dynamic Animations | Complete Guide
Transform static presentations into engaging visual stories with our comprehensive guide to Google Slides animations. Learn essential techniques, advanced storytelling, and practical applications.