AI-Enhanced Pattern Detection in TradingView
Transforming Technical Analysis with Advanced Visualization
Discover how automated pattern recognition tools can enhance your trading decisions when combined with powerful visualization techniques.
The Power of Automated Pattern Recognition
I've spent years analyzing charts manually, and I can tell you that the evolution from manual identification to AI-assisted pattern detection has been revolutionary for technical traders. Pattern recognition is fundamental to technical analysis, but human bias and cognitive limitations can lead to inconsistent results.
Evolution of Chart Analysis
- Manual pattern identification is time-consuming and subjective
- Human eyes can miss subtle formations or see patterns that aren't truly there
- Automated tools provide consistency and reduce confirmation bias
- AI assistance allows traders to focus on strategy rather than identification
TradingView's Revolution
- Built-in indicators offer institutional-quality pattern detection
- Community-developed tools expand detection capabilities
- Real-time scanning across multiple timeframes
- Customizable filters to match individual trading styles
"The best traders understand that automated pattern detection is a powerful tool, but it's the integration with human judgment and proper visualization that creates a truly effective trading system."
Core Automated Pattern Detection Tools in TradingView
TradingView offers several sophisticated pattern detection indicators that can identify everything from simple candlestick patterns to complex harmonic formations. Let's explore the most powerful tools available and how they can enhance your technical analysis workflow.
The All Chart Patterns Indicator
This flagship indicator is TradingView's most comprehensive pattern detection tool, capable of identifying classic chart formations in real-time.
Key Features:
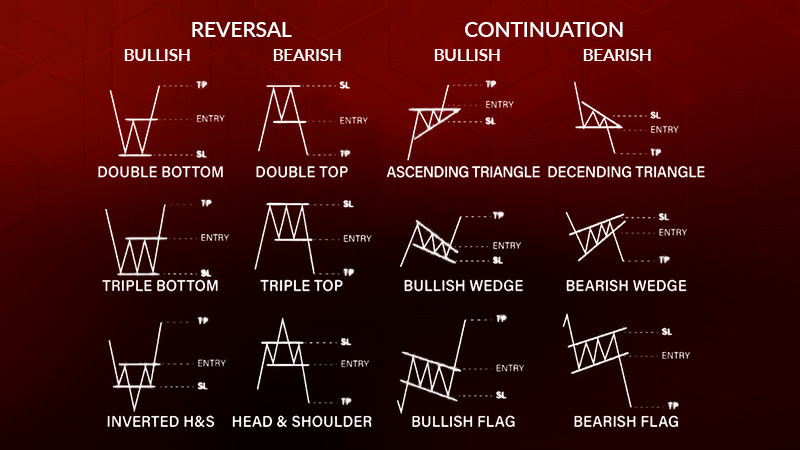
- Detects head and shoulders, double tops/bottoms, triangles, wedges, and more
- Provides visual price targets based on pattern measurements
- Customizable settings for pattern selection and display preferences
- Filters patterns based on completion status and confidence levels
flowchart TD
    A[Chart Data] --> B[Pattern Detection Engine]
    B --> C{Pattern Type}
    C -->|Reversal Patterns| D[Head & Shoulders\nDouble Top/Bottom\nRounding Bottom]
    C -->|Continuation Patterns| E[Flags\nPennants\nTriangles]
    C -->|Harmonic Patterns| F[Gartley\nButterfly\nBat\nCrab]
    D --> G[Visual Display & Alerts]
    E --> G
    F --> G
Advanced Pattern Detection System
This community-developed indicator takes pattern detection to the next level with over 50 detectable patterns and sophisticated validation mechanisms.
Standout Capabilities:
- Confidence ratings (60-95%) for each identified pattern
- Visual explanations of why each pattern was identified
- Automatic calculation of theoretical price targets
- Customizable panel positioning and timeframe flexibility

Specialized Pattern Recognition Tools
Beyond the comprehensive indicators, TradingView offers specialized tools for specific pattern types:
Harmonic Pattern Detectors
Identifies Fibonacci-based patterns like Gartley, Butterfly, and Bat patterns with precise ratio measurements.
Candlestick Pattern Dashboards
Scans for Japanese candlestick patterns with reliability scoring based on confirmation factors.
Elliott Wave Detectors
Identifies potential Elliott Wave structures with Fibonacci validation and wave labeling.
Auto Chart Patterns
Automatically identifies chart patterns using zigzag methodology with customizable sensitivity.
Understanding the Technology Behind Pattern Recognition
The magic behind TradingView's pattern detection capabilities lies in sophisticated algorithms that transform raw price data into recognizable formations. Understanding these mechanisms helps traders optimize their use of these tools and interpret the results more effectively.
TradingView's Pattern Detection Algorithms
flowchart TD
    A[Price Data] --> B[Zigzag Algorithm]
    B --> C[Pivot Point Identification]
    C --> D[Geometric Pattern Analysis]
    D --> E{Pattern Type}
    E --> F[Classic Patterns]
    E --> G[Harmonic Patterns]
    F --> H[Shape Recognition]
    G --> I[Fibonacci Ratio Validation]
    H --> J[Pattern Validation]
    I --> J
    J --> K[Display & Alerting]
Zigzag-Based Pivot Identification
The foundation of pattern detection is the zigzag algorithm that identifies significant pivot points in price action, filtering out market noise.
Geometric Shape Recognition
Algorithms analyze the relationships between pivot points to identify geometric shapes that match known pattern templates.
Mathematical Ratio Validation
For harmonic patterns, precise mathematical ratios between pattern legs are calculated and validated against ideal Fibonacci values.
Filtering Mechanisms to Reduce False Signals
Pattern detection tools incorporate several filtering mechanisms to improve signal quality:
| Filter Type | Function | Implementation |
|---|---|---|
| Trend Alignment | Ensures patterns align with the underlying trend | Uses moving averages (SMA50, SMA200) to determine trend direction |
| Volume Confirmation | Validates patterns with volume behavior | Checks for increasing volume at breakouts or decreasing volume during consolidations |
| Pattern Completion | Verifies pattern structure is fully formed | Requires breakout/breakdown confirmation before signaling |
| Historical Validity | Checks pattern against historical performance | Assigns confidence ratings based on past success rates |

Visualizing Complex Market Structures with PageOn.ai
While TradingView's pattern detection tools are powerful, transforming that raw data into clear, actionable insights requires effective visualization. This is where PageOn.ai excels, offering a platform to create custom visual frameworks that enhance pattern-based trading strategies.
Transforming Raw Pattern Data into Clear Visuals
Pattern detection generates complex data that can be overwhelming in its raw form. I've found that using PageOn.ai to transform this data into structured visual frameworks makes it significantly easier to interpret and act upon.
Key Visualization Benefits:
- Convert fuzzy pattern concepts into clear visual structures
- Create consistent visual templates for pattern identification
- Build comprehensive pattern libraries for training and reference
- Develop custom dashboards that highlight the most relevant patterns
Creating Dynamic Pattern Analysis Workspaces
PageOn.ai's AI Blocks feature allows traders to organize pattern detection insights hierarchically, creating interactive workspaces that adapt to changing market conditions.
flowchart TD
    A[TradingView Pattern Data] --> B[PageOn.ai Integration]
    B --> C[AI Blocks Processing]
    C --> D{Pattern Category}
    D --> E[Reversal Patterns]
    D --> F[Continuation Patterns]
    D --> G[Harmonic Patterns]
    E --> H[Visual Pattern Library]
    F --> H
    G --> H
    H --> I[Interactive Trading Dashboard]
    I --> J[Trading Decision Support]
I've developed a workflow that combines TradingView's pattern detection with PageOn.ai's visualization capabilities:
- Export pattern detection data from TradingView
- Import into PageOn.ai to create structured visual frameworks
- Organize patterns by type, confidence level, and timeframe
- Create interactive dashboards that highlight high-probability setups
- Generate custom visual reports for trading journal documentation
Leveraging PageOn.ai: When I needed to explain complex harmonic patterns to my trading group, I used PageOn.ai's AI Blocks to create a visual hierarchy that organized patterns by their Fibonacci ratios and potential profit targets. This transformed abstract mathematical concepts into an intuitive visual framework that dramatically improved pattern recognition skills among the group.

Practical Implementation Strategies
Implementing automated pattern detection effectively requires careful configuration and strategic integration into your broader trading approach. Here's how I've optimized these tools for different trading styles and market conditions.
Optimizing Pattern Detection Settings
| Trading Style | Timeframe | Pattern Types | Optimal Settings |
|---|---|---|---|
| Day Trading | 1-minute to 15-minute | Flags, Pennants, Double Tops/Bottoms | Higher sensitivity, shorter lookback periods |
| Swing Trading | Hourly to Daily | Head & Shoulders, Triangles, Channels | Medium sensitivity, trend filter enabled |
| Position Trading | Daily to Weekly | Rounding Patterns, Cup & Handle, Inverse H&S | Lower sensitivity, volume confirmation required |
For volatile markets like cryptocurrencies, I've found these specific adjustments helpful:
Crypto-Specific Pattern Detection Settings
- Increase pattern sensitivity by 10-15% to account for higher volatility
- Enable strong volume confirmation requirements to filter false breakouts
- Use higher timeframe trend filters (4H or daily) even when trading lower timeframes
- Focus on continuation patterns during strong trends rather than reversal patterns
Building a Multi-Layered Pattern Recognition System
flowchart TD
    A[Market Data] --> B[Automated Pattern Detection]
    A --> C[Manual Chart Analysis]
    B --> D{Pattern Identified?}
    C --> E{Confirmation?}
    D -->|Yes| F[Pattern Classification]
    E -->|Yes| F
    F --> G[Pattern Quality Assessment]
    G --> H{High Quality?}
    H -->|Yes| I[Trading Opportunity]
    H -->|No| J[Monitor or Reject]
    I --> K[Position Sizing & Risk Management]
    I --> L[Entry & Exit Planning]
I recommend a multi-layered approach that combines automated detection with manual verification:
- Use automated tools for initial pattern identification across multiple assets
- Apply manual verification to confirm pattern validity and context
- Create pattern confluence zones by identifying overlapping patterns
- Use PageOn.ai to visualize these confluence zones for clearer decision-making
- Develop a scoring system for pattern quality based on multiple factors
Advanced Applications and Integration
For experienced traders, automated pattern detection can be integrated into sophisticated trading systems and multi-timeframe analysis frameworks. These advanced applications leverage the full power of pattern recognition technology.
Pattern-Based Trading Systems
I've developed rule-based trading systems that use pattern detection as their foundation. These systems define specific entry and exit rules based on pattern type, quality, and market context.
System Components:
- Pattern identification rules (automated + manual verification)
- Entry criteria based on pattern completion and confirmation
- Position sizing rules tied to pattern quality metrics
- Pattern-specific stop loss and take profit levels
- Pattern performance tracking for system refinement
Setting up custom alerts for pattern completion events allows traders to monitor multiple assets efficiently:
Pattern Alert Configuration Examples:
- Head & Shoulders Completion Alert: "H&S pattern completed on {{ticker}} - Neckline at {{price}}, target at {{target}}"
- Harmonic Pattern Alert: "{{pattern}} detected on {{ticker}} - Potential reversal zone between {{priceA}} and {{priceB}}"
- Pattern Confluence Alert: "Multiple patterns detected at {{price}} on {{ticker}} - Strong {{direction}} signal"
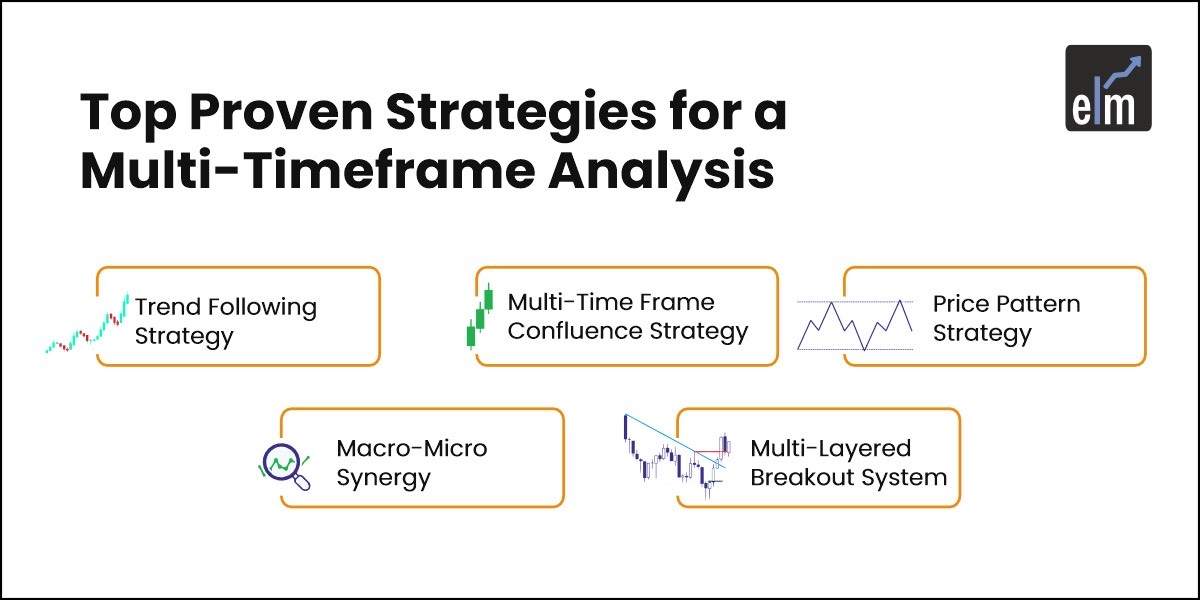
Multi-Timeframe Pattern Analysis
One of the most powerful applications of automated pattern detection is multi-timeframe analysis, which identifies patterns across different timeframes to find high-probability trading opportunities.
flowchart TD
    A[Higher Timeframe\nPattern Detection] --> B{Pattern Found?}
    B -->|Yes| C[Determine Pattern Direction]
    B -->|No| D[No Trade Setup]
    C --> E[Lower Timeframe\nPattern Detection]
    E --> F{Aligned Pattern?}
    F -->|Yes| G[High Probability Setup]
    F -->|No| H[Conflicting Signals - Wait]
    G --> I[Entry on Lower TF]
    G --> J[Stop Loss from Higher TF]
    G --> K[Targets from Both TFs]
I use a structured approach to multi-timeframe pattern analysis:
- Start with higher timeframe (daily/weekly) to identify major patterns and trend direction
- Move to intermediate timeframe (4H/hourly) to confirm trend and identify potential entry zones
- Drop to lower timeframe (15min/5min) for precise entry timing using smaller patterns
- Use PageOn.ai to create visual dashboards showing pattern alignment across timeframes
- Prioritize trades where patterns align in the same direction across multiple timeframes
Showcasing PageOn.ai: For a recent trading workshop, I created a multi-timeframe pattern dashboard using PageOn.ai that displayed pattern detection results from daily, 4-hour, and 1-hour timeframes side-by-side. The visual clarity of seeing patterns align across timeframes helped participants understand the concept of confluence much more quickly than textual explanations ever could.
Future Directions in AI-Powered Pattern Recognition
The field of automated pattern detection is rapidly evolving, with machine learning and AI pushing the boundaries of what's possible. Understanding these emerging trends can help traders stay ahead of the curve.
Machine Learning Enhancements
Machine learning is transforming pattern detection by moving beyond rigid rule-based systems to more adaptive, context-aware algorithms.
Emerging AI Capabilities:
- Deep learning models that improve pattern detection accuracy
- Adaptive algorithms that learn from market-specific pattern behavior
- Personalized pattern detection based on individual trading histories
- Context-aware systems that consider broader market conditions
- Natural language processing for pattern description and explanation

Visual Communication of Pattern Intelligence
As pattern detection technology becomes more sophisticated, so too must the visual interfaces that communicate these insights to traders. This is where tools like PageOn.ai are leading the way.
flowchart TD
    A[AI Pattern Detection] --> B[Raw Pattern Data]
    B --> C[PageOn.ai Integration]
    C --> D[Pattern Visualization]
    D --> E[Interactive Exploration]
    D --> F[Visual Pattern Training]
    D --> G[Custom Trading Dashboards]
    E --> H[Trading Decisions]
    F --> H
    G --> H
The future of pattern visualization includes:
- Interactive pattern exploration environments that allow traders to "walk through" pattern formation and historical performance
- Personalized visual training systems that adapt to individual learning styles and trading preferences
- Real-time pattern dashboards that integrate multiple data sources and timeframes
- AI-assisted visual explanations of why specific patterns are forming and their historical reliability
- Collaborative pattern libraries that improve through community contributions and feedback
Leveraging PageOn.ai: I'm currently developing a pattern intelligence dashboard using PageOn.ai's AI Blocks that not only displays detected patterns but also provides visual explanations of their formation, historical performance statistics, and contextual factors affecting their reliability. This transforms raw pattern data into actionable intelligence that can be quickly understood and applied to trading decisions.

Balancing Automation with Trader Intuition
As we've explored throughout this guide, automated pattern detection tools offer powerful capabilities for technical traders. However, the most successful approach is one that balances technological assistance with human judgment and intuition.
The Complementary Relationship
I've found that the most effective trading approach uses automated pattern detection as a powerful tool within a broader system that incorporates human judgment, market context, and risk management principles.
Balanced Approach Benefits:
- Automation handles the repetitive task of scanning for patterns
- Human judgment evaluates pattern quality and market context
- Technology provides consistency and reduces cognitive biases
- Trader intuition adds nuance and adaptability to changing conditions
- Visualization bridges the gap between data and decision-making

My recommended workflow combines the strengths of both automated detection and human expertise:
- Use automated tools to scan multiple assets and timeframes efficiently
- Apply human judgment to evaluate pattern quality and market context
- Leverage PageOn.ai to create visual frameworks that enhance understanding
- Maintain a pattern trading journal to track performance and refine your approach
- Continuously educate yourself on both pattern theory and technological advancements
Key Takeaways:
- Automated pattern detection tools significantly enhance efficiency and consistency
- TradingView offers comprehensive pattern recognition capabilities for all trading styles
- PageOn.ai transforms complex pattern data into clear visual frameworks
- Multi-timeframe pattern analysis identifies high-probability trading opportunities
- The most effective approach combines technology with human judgment and intuition
- The future of pattern trading lies in AI enhancement and improved visualization
Transform Your Visual Expressions with PageOn.ai
Ready to take your pattern analysis to the next level? PageOn.ai offers powerful tools to transform complex trading data into clear, actionable visual insights that enhance your decision-making process.
Start Creating with PageOn.ai TodayResources for Further Pattern Recognition Mastery
Recommended TradingView Indicators
- All Chart Patterns - TradingView's built-in comprehensive pattern detector
- Pattern Detector [theUltimator5] - Community-developed multi-pattern recognition tool
- Auto Chart Patterns [Trendoscope] - Advanced pattern classification system
- Harmonic Patterns + Fib [CRT Trader] - Specialized harmonic pattern detector
- Candlestick Patterns Dashboard Pro+ - Comprehensive candlestick pattern analyzer
Educational Materials
- Encyclopedia of Chart Patterns by Thomas Bulkowski
- Technical Analysis of the Financial Markets by John J. Murphy
- Harmonic Trading by Scott Carney
- Japanese Candlestick Charting Techniques by Steve Nison
- TradingView's Pattern Recognition Tutorial Series (available in the Learning Center)
For practical implementation guidance and visual pattern frameworks, explore these resources:
You Might Also Like
Streamlining Presentation Automation: Combining VBA and AI for Next-Generation Slide Decks
Discover how to combine VBA and AI technology to create automated, intelligent presentations. Learn technical implementation, practical applications, and future trends in presentation automation.
Mastering Your First AI-Powered PowerPoint Automation Workflow | Complete Guide
Learn how to set up your first PowerPoint automation workflow with AI tools. Step-by-step guide covering Power Automate, Microsoft Copilot, and advanced techniques for efficient presentations.
Mastering MCP Architecture: The Ultimate Blueprint for Seamless AI-Data Integration
Explore the Model Context Protocol architecture that solves the N×M integration problem. Learn how MCP creates standardized connections between AI systems and data sources.
Mastering Object Animations: Transform Static Slides into Engaging Visual Stories
Learn how to enhance your presentations with dynamic object animations. Discover techniques for entrance effects, motion paths, interactive elements, and more for PowerPoint and Google Slides.