Building Scalable Data Warehouses with Spark
Visualizing Complex Architecture for Modern Processing
In my experience working with enterprise data systems, I've found that visualizing complex data architectures is the key to building scalable, efficient data warehouses. Join me as we explore how Apache Spark and modern processing techniques can transform your data infrastructure.
Evolution of Modern Data Warehousing
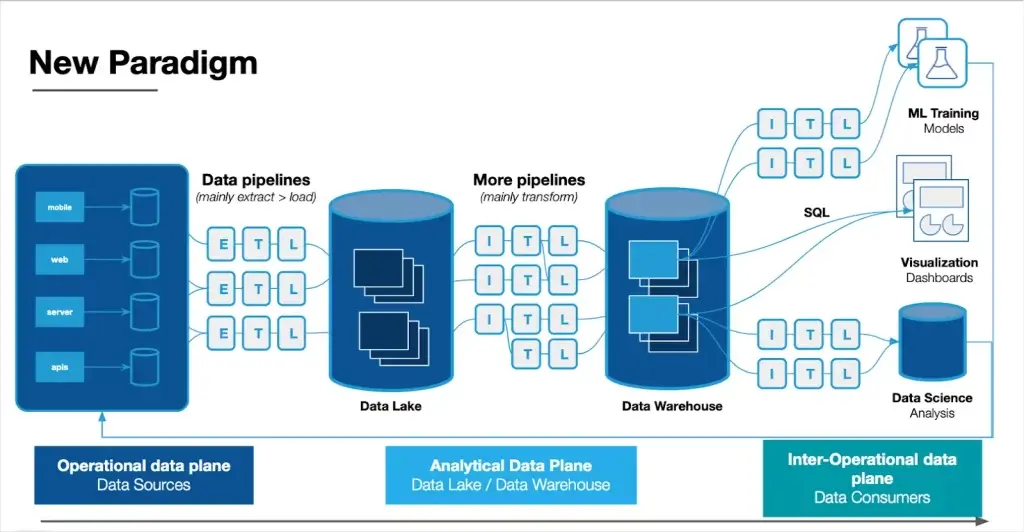
I've witnessed firsthand how data warehousing has transformed over the past decade. Traditional data warehouses were once monolithic systems with limited scalability, but today's solutions embrace cloud-native architectures that can handle petabytes of data effortlessly. This evolution hasn't been without challenges.

Modern enterprises face significant challenges when managing big data volumes. These include scaling storage and compute resources independently, ensuring data quality across disparate sources, and maintaining performance as data volumes grow. When I work with clients on data visualization graph tools, I emphasize how visual representations can transform these complex architectures into understandable models.
One of the most significant shifts I've observed is the convergence of data lakes and data warehouses. Rather than separate entities, modern architectures treat them as complementary components of a unified data platform. Data lakes store raw, unprocessed data in its native format, while data warehouses provide structured, optimized storage for analytical queries.
Key Evolution Milestones
Core Components of Scalable Data Warehouse Architecture
Apache Spark as the Processing Engine
In my work with large-scale data systems, I've found Apache Spark to be the cornerstone of modern data processing. Its distributed computing model allows processing to be parallelized across hundreds or thousands of nodes, dramatically reducing computation time for large datasets.
Spark's Distributed Processing Architecture
flowchart TD
    Client[Client Application] -->|Submit Job| Driver[Driver Program]
    Driver -->|Create| SC[SparkContext]
    SC -->|Divide into Tasks| Cluster[Cluster Manager]
    Cluster -->|Allocate Resources| W1[Worker Node 1]
    Cluster -->|Allocate Resources| W2[Worker Node 2]
    Cluster -->|Allocate Resources| W3[Worker Node 3]
    W1 -->|Execute Tasks| E1[Executor 1]
    W2 -->|Execute Tasks| E2[Executor 2]
    W3 -->|Execute Tasks| E3[Executor 3]
    E1 -->|Process| P1[Partitioned Data]
    E2 -->|Process| P2[Partitioned Data]
    E3 -->|Process| P3[Partitioned Data]
    P1 -->|Results| Driver
    P2 -->|Results| Driver
    P3 -->|Results| Driver
What makes Spark particularly powerful is its integration with other ecosystem tools. I regularly connect Spark with data sources like Kafka for streaming data, Hadoop HDFS or cloud storage for persistent data, and various database systems for enrichment and output. This flexibility is crucial when designing agent-to-data connection mapping solutions that need to handle diverse data types and sources.
Storage Layer Options
Delta Lake
Provides ACID transactions, schema enforcement, and time travel capabilities on top of data lakes. I've found it invaluable for maintaining data integrity in large-scale systems.
MinIO
A high-performance, S3-compatible object storage solution that I often recommend for on-premises deployments requiring cloud-like storage capabilities.
ClickHouse
A column-oriented database that excels at analytical queries. In my projects, it's been the go-to solution for real-time analytics on massive datasets.
Integration Frameworks
Connecting disparate systems through visual workflow mapping is essential for maintaining a clear understanding of complex data architectures. When I design data systems, I create visual representations of data flows that help both technical and business stakeholders understand how information moves through the organization.
Data Pipeline Orchestration
flowchart LR
    subgraph "Data Sources"
        S1[Relational DB]
        S2[API Endpoints]
        S3[Streaming Events]
        S4[Files/Documents]
    end
    subgraph "Ingestion Layer"
        I1[Batch ETL]
        I2[Change Data Capture]
        I3[Stream Processing]
    end
    subgraph "Storage Layer"
        ST1[Raw Zone]
        ST2[Processed Zone]
        ST3[Curated Zone]
    end
    subgraph "Processing Layer"
        P1[Spark Jobs]
        P2[SQL Transformations]
        P3[ML Pipelines]
    end
    subgraph "Serving Layer"
        SV1[Data Warehouse]
        SV2[Data Marts]
        SV3[Feature Store]
        SV4[API Services]
    end
    S1 --> I1
    S2 --> I1
    S3 --> I3
    S4 --> I1
    S1 --> I2
    I1 --> ST1
    I2 --> ST1
    I3 --> ST1
    ST1 --> P1
    P1 --> ST2
    ST2 --> P2
    P2 --> ST3
    ST2 --> P3
    P3 --> ST3
    ST3 --> SV1
    ST3 --> SV2
    ST3 --> SV3
    SV1 --> SV4
    SV2 --> SV4
    SV3 --> SV4
Building Effective Data Processing Pipelines
ETL vs. ELT Approaches
Throughout my career, I've worked with both ETL (Extract, Transform, Load) and ELT (Extract, Load, Transform) approaches. The choice between them depends on your specific use case, data volumes, and processing requirements.
ETL vs. ELT Comparison
When deciding between ETL and ELT, I consider factors like data volume, transformation complexity, and query patterns. For projects requiring sophisticated build knowledge graph RAG systems, I often lean toward ELT approaches that preserve data fidelity while enabling flexible transformations.
Real-time vs. Batch Processing
In my experience, the decision between real-time and batch processing depends on the business requirements for data freshness and the nature of the data sources. Modern data warehouses often employ a hybrid approach to balance efficiency and timeliness.
Streaming Data Flow Architecture
flowchart LR
    subgraph "Data Sources"
        S1[IoT Devices]
        S2[User Activity]
        S3[System Logs]
    end
    subgraph "Stream Processing"
        K[Apache Kafka] --> SP[Spark Streaming]
        SP --> W[Processing Window]
        W -->|Micro-batch| T[Transformations]
    end
    subgraph "Storage & Serving"
        T -->|Real-time View| RT[Real-time Layer]
        T -->|Aggregated View| BT[Batch Layer]
        RT --> Q[Query Interface]
        BT --> Q
    end
    S1 -->|Events| K
    S2 -->|Events| K
    S3 -->|Events| K
Code Implementation Examples
When implementing data pipelines, I work with various programming languages and frameworks. Here are some examples I've used in real-world projects:
PySpark Example
spark = SparkSession.builder \
    .appName("Data Warehouse ETL") \
    .config("spark.hadoop.fs.s3a.endpoint", "http://minio:9000") \
    .config("spark.hadoop.fs.s3a.access.key", "minioadmin") \
    .config("spark.hadoop.fs.s3a.secret.key", "minioadmin") \
    .config("spark.hadoop.fs.s3a.path.style.access", "true") \
    .config("spark.hadoop.fs.s3a.impl", "org.apache.hadoop.fs.s3a.S3AFileSystem") \
    .getOrCreate()
df = spark.read.parquet("s3a://data-lake/raw/sales/")
transformed_df = df.withColumn(
    "total_amount",
    col("quantity") * col("unit_price")
).filter(col("total_amount") > 100)
transformed_df.write \
    .format("delta") \
    .mode("overwrite") \
    .partitionBy("date") \
    .save("s3a://data-lake/processed/sales/")
C# with .NET for Spark
using Microsoft.Spark.Sql;
using Microsoft.Spark.Sql.Types;
using static Microsoft.Spark.Sql.Functions;
// Create Spark session
var spark = SparkSession.Builder()
    .AppName("DotNet Spark ETL")
    .Config("spark.hadoop.fs.s3a.endpoint", "http://minio:9000")
    .Config("spark.hadoop.fs.s3a.access.key", "minioadmin")
    .Config("spark.hadoop.fs.s3a.secret.key", "minioadmin")
    .Config("spark.hadoop.fs.s3a.path.style.access", "true")
    .Config("spark.hadoop.fs.s3a.impl", "org.apache.hadoop.fs.s3a.S3AFileSystem")
    .GetOrCreate();
// Read data
var df = spark.Read().Parquet("s3a://data-lake/raw/sales/");
// Transform data
var transformedDf = df
    .WithColumn("total_amount", Col("quantity") * Col("unit_price"))
    .Filter(Col("total_amount") > 100);
// Write to Delta format
transformedDf.Write()
    .Format("delta")
    .Mode("overwrite")
    .PartitionBy("date")
    .Save("s3a://data-lake/processed/sales/");
These code examples demonstrate how I transform complex logic into executable data pipelines. When working with teams, I find that data visualization for business intelligence helps bridge the gap between technical implementation and business understanding.
Optimizing for Scale and Performance
Partitioning Strategies
In my work with large-scale data warehouses, I've found that effective partitioning is crucial for performance. The right partitioning strategy can dramatically reduce query times by limiting the amount of data scanned.

| Partitioning Strategy | Best For | Advantages | Disadvantages |
|---|---|---|---|
| Date/Time | Time-series data, logs | Easy pruning for time-based queries | Potential for skewed partitions |
| Hash | Even distribution needs | Balanced data distribution | Poor for range queries |
| Range | Numeric/ordered data | Efficient for range-based queries | Can lead to hotspots |
| List | Categorical data | Great for filtering on categories | Limited to discrete values |
Caching and Memory Management
Effective memory management is critical when working with Spark. I've learned to carefully balance memory allocation between execution and storage to optimize performance without causing out-of-memory errors.
Memory Allocation in Distributed Systems
Query Optimization Techniques
Query optimization is an art I've refined over years of working with data warehouses. Understanding execution plans and applying the right optimization techniques can transform slow queries into lightning-fast ones.
Query Execution Plan Visualization
flowchart TD
    Q[SQL Query] --> P[Parser]
    P --> LA[Logical Analyzer]
    LA --> LO[Logical Optimizer]
    LO --> PP[Physical Planner]
    PP --> PO[Physical Optimizer]
    subgraph "Optimization Steps"
        PO --> F[Filter Pushdown]
        F --> CP[Column Pruning]
        CP --> JP[Join Optimization]
        JP --> PP2[Partition Pruning]
    end
    PP2 --> E[Execution]
    E --> R[Results]
    style Q fill:#f9d5e5,stroke:#333,stroke-width:1px
    style PO fill:#eeeeee,stroke:#333,stroke-width:1px
    style F fill:#d5f9e8,stroke:#333,stroke-width:1px
    style CP fill:#d5f9e8,stroke:#333,stroke-width:1px
    style JP fill:#d5f9e8,stroke:#333,stroke-width:1px
    style PP2 fill:#d5f9e8,stroke:#333,stroke-width:1px
    style R fill:#e8f9d5,stroke:#333,stroke-width:1px
Key Query Optimization Techniques
- Filter pushdown: Move filtering operations closer to data sources to reduce data transfer
- Column pruning: Only read the columns needed for your query
- Join optimization: Choose the right join strategy (broadcast vs. shuffle) based on table sizes
- Partition pruning: Leverage partitioning to scan only relevant data segments
- Predicate reordering: Evaluate the most selective predicates first to reduce intermediate results
- Statistics collection: Maintain up-to-date statistics for the query optimizer
Democratizing Data Access Through Self-Service Analytics
In my experience, the true value of a data warehouse is unlocked when data becomes accessible to business users through self-service analytics. This requires careful attention to user experience, security, and governance.
Building User-Friendly Data Interfaces
I've found that translating complex data structures into intuitive visual models is essential for adoption. When designing data interfaces, I focus on making the underlying complexity invisible to the end user while still providing powerful analytical capabilities.

For users who prefer structured data organization, I often recommend exploring ways of managing Notion databases as a lightweight alternative to traditional BI tools. This approach can significantly lower the barrier to entry for non-technical users.
Security and Governance Considerations
Data Access Control Framework
flowchart TD
    subgraph "Authentication"
        IdP[Identity Provider]
        Auth[Authentication Service]
        IdP --> Auth
    end
    subgraph "Authorization"
        RBAC[Role-Based Access]
        ABAC[Attribute-Based Access]
        RLS[Row-Level Security]
        CLS[Column-Level Security]
        MFA[Multi-Factor Auth]
    end
    subgraph "Data Access Layer"
        API[API Gateway]
        Cache[Query Cache]
        Proxy[SQL Proxy]
    end
    Auth --> RBAC
    Auth --> ABAC
    RBAC --> RLS
    RBAC --> CLS
    ABAC --> RLS
    ABAC --> CLS
    Auth --> MFA
    MFA --> API
    RLS --> API
    CLS --> API
    API --> Cache
    API --> Proxy
    Cache --> DW[Data Warehouse]
    Proxy --> DW
Security is non-negotiable in data warehouse implementations. I always implement comprehensive access controls, encryption, and audit logging to ensure that sensitive data is protected while still being available to authorized users.
Enabling Cross-Functional Collaboration
Breaking down technical barriers through visual data storytelling has been one of my most rewarding achievements. When business and technical teams share a common understanding of data, innovation flourishes.
Cross-Functional Data Collaboration Benefits
Case Studies: Real-World Implementation Examples
Enterprise-Scale Data Warehouse Transformation
I recently led a project to transform a legacy data warehouse for a Fortune 500 retail company. The existing system couldn't handle the growing data volumes and was becoming a bottleneck for business analytics.
Before
- Monolithic on-premises data warehouse
- 8-hour ETL windows causing data freshness issues
- Limited to structured data only
- Query performance degrading with data growth
- Rigid schema limiting business agility
After
- Cloud-based lakehouse architecture
- Near real-time data processing with Spark Streaming
- Support for structured, semi-structured, and unstructured data
- Auto-scaling compute resources based on demand
- Schema-on-read flexibility with governance guardrails
Performance Improvement Metrics
IoT Data Processing at Scale
I worked with a manufacturing client to build a real-time IoT data processing platform that ingests data from thousands of sensors across multiple factories. The system needed to detect anomalies and trigger maintenance alerts in near real-time.
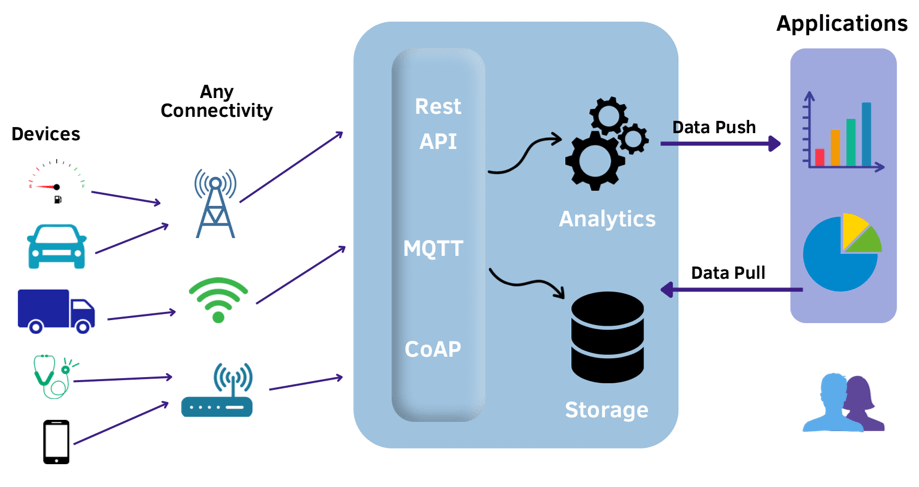
The solution used Apache Spark Streaming to process sensor data in micro-batches, with machine learning models deployed for anomaly detection. The architecture scaled to handle over 1 million events per second while maintaining sub-second alerting latency.
Financial Services Data Platform
For a financial services client, I designed a data platform that balanced stringent regulatory requirements with the need for agile analytics. Compliance was a primary concern, requiring comprehensive audit trails and data lineage.
Financial Services Data Governance Framework
flowchart TD
    subgraph "Data Sources"
        CRM[CRM Data]
        Trans[Transaction Data]
        Market[Market Data]
        Risk[Risk Models]
    end
    subgraph "Ingestion & Governance"
        DI[Data Ingestion]
        PII[PII Detection]
        Mask[Data Masking]
        Lin[Lineage Tracking]
        Audit[Audit Logging]
    end
    subgraph "Processing Layer"
        Spark[Spark Processing]
        Compliance[Compliance Rules]
        Retention[Retention Policies]
    end
    subgraph "Consumption Layer"
        BI[BI Dashboards]
        Reports[Regulatory Reports]
        API[Client APIs]
    end
    CRM --> DI
    Trans --> DI
    Market --> DI
    Risk --> DI
    DI --> PII
    PII --> Mask
    Mask --> Lin
    Lin --> Audit
    Audit --> Spark
    Spark --> Compliance
    Compliance --> Retention
    Retention --> BI
    Retention --> Reports
    Retention --> API
Future-Proofing Your Data Warehouse Architecture
Integration with AI and Machine Learning Workflows
As data warehouses evolve, integration with AI and machine learning workflows becomes increasingly important. I design data architectures that support seamless feature engineering and model deployment.
ML Feature Engineering Pipeline
flowchart TD
    subgraph "Data Sources"
        Raw[Raw Data]
        Curated[Curated Data]
    end
    subgraph "Feature Engineering"
        Extract[Feature Extraction]
        Transform[Feature Transformation]
        Select[Feature Selection]
    end
    subgraph "Feature Store"
        Online[Online Store]
        Offline[Offline Store]
        Registry[Feature Registry]
    end
    subgraph "ML Pipeline"
        Train[Model Training]
        Validate[Validation]
        Deploy[Deployment]
        Serve[Serving]
    end
    Raw --> Extract
    Curated --> Extract
    Extract --> Transform
    Transform --> Select
    Select --> Offline
    Select --> Online
    Select --> Registry
    Offline --> Train
    Registry --> Train
    Train --> Validate
    Validate --> Deploy
    Deploy --> Serve
    Online --> Serve
Adapting to Evolving Data Sources
The data landscape is constantly evolving, with new sources and formats emerging regularly. I design flexible architectures that can incorporate unstructured and semi-structured data alongside traditional structured data.
Data Type Distribution in Modern Enterprises
Cost Optimization Strategies
As data volumes grow, cost optimization becomes increasingly important. I implement strategies like automated scaling, storage tiering, and workload management to optimize resource utilization.
Cloud Data Warehouse Cost Components
Transform Your Data Warehouse Visualizations with PageOn.ai
I've shown you how to build scalable data warehouses with Spark. Now, take your visual expressions to the next level with PageOn.ai's intuitive visualization tools. Create stunning diagrams, flowcharts, and interactive dashboards that make complex data architectures clear and actionable.
Start Creating with PageOn.ai TodayConclusion
Building scalable data warehouses with Spark and modern processing techniques is a complex but rewarding endeavor. By focusing on architecture visualization, performance optimization, and democratizing data access, you can create systems that deliver tremendous business value.
Throughout my career, I've found that the most successful data warehouse implementations are those that balance technical excellence with business usability. Visualization plays a critical role in bridging this gap, making complex systems comprehensible to all stakeholders.
As you embark on your own data warehouse journey, I encourage you to embrace visual thinking and communication. Tools like PageOn.ai can help you transform complex architectural concepts into clear, compelling visual expressions that drive understanding and adoption across your organization.
You Might Also Like
Visualizing the AI Revolution: From AlphaGo to AGI Through Key Visual Milestones
Explore the visual journey of AI evolution from AlphaGo to AGI through compelling timelines, infographics and interactive visualizations that map key breakthroughs in artificial intelligence.
Bridging Worlds: How Diffusion Models Are Reshaping Language Generation | PageOn.ai
Explore the revolutionary convergence of diffusion models and language generation. Discover how diffusion techniques are creating new paradigms for NLP, bridging visual and linguistic domains.
The AI Superpower Timeline: Visualizing US-China AI Race & Tech Developments
Explore the narrowing US-China AI performance gap, historical milestones, technical battlegrounds, and future projections in the global artificial intelligence race through interactive visualizations.
Prompt Chaining Techniques That Scale Your Business Intelligence | Advanced AI Strategies
Master prompt chaining techniques to transform complex business intelligence workflows into scalable, automated insights. Learn strategic AI methodologies for data analysis.