From Extinction to Recovery: Visualizing Wolf Population Dynamics
Tracking Wolf Populations Through Advanced Technology
I've spent years studying how we can transform complex ecological data into powerful visual stories. In this guide, I'll show you how modern tracking technologies and innovative visualization techniques are revolutionizing wolf conservation efforts across North America and Europe.
The Wolf Population Crisis: Setting the Stage
When I first began researching wolf populations, I was struck by the dramatic story of their decline and ongoing recovery. Once abundant across North America and Europe, wolves experienced a catastrophic population collapse during the 19th and early 20th centuries. In the United States alone, wolf numbers plummeted from hundreds of thousands to mere hundreds by the 1970s.
Historical distribution map showing the dramatic reduction in wolf territories across North America from 1900-1950
This decline wasn't merely a conservation issue—it represented a fundamental disruption of ecosystem balance. Wolves are what ecologists call "keystone species," playing a critical role in what we now understand as "trophic cascades." These cascades occur when changes at the top of the food web ripple throughout the entire ecosystem.
The power of storytelling with data becomes particularly evident when examining wolf conservation milestones. The 1973 Endangered Species Act listing marked a turning point, followed by reintroduction efforts in places like Yellowstone National Park in 1995, which have since become textbook examples of successful conservation interventions.
Wolf Population Decline and Recovery in the Continental US
From a data visualization perspective, tracking wolf populations presents unique challenges. These elusive predators roam vast territories, often in remote wilderness areas. Traditional monitoring methods like direct observation are impractical, making advanced tracking technologies and innovative data visualization techniques essential for conservation efforts.
Modern Tracking Technologies Revolutionizing Wolf Conservation
In my work with conservation biologists, I've witnessed firsthand how technological innovations have transformed our ability to monitor wolf populations. What began with basic radio telemetry has evolved into sophisticated systems that provide unprecedented insights into wolf behavior and population dynamics.
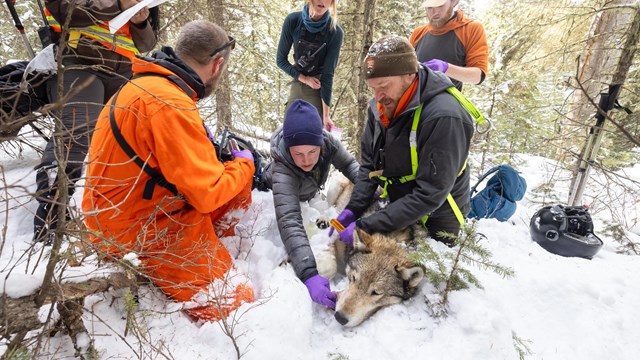
Wildlife biologist fitting a GPS collar on a sedated gray wolf during a monitoring operation
Evolution of Wolf Tracking Technologies
                    flowchart TD
                        A[Traditional Tracking
1960s-1980s] -->|Evolution| B[Radio Telemetry
1980s-2000s]
                        B -->|Evolution| C[GPS Collars
2000s-Present]
                        C -->|Integration| D[Satellite & Remote Sensing
2010s-Present]
                        E[Field Observations] -->|Supplemented by| F[Camera Traps
1990s-Present]
                        F -->|Enhanced with| G[AI Image Recognition
2015-Present]
                        H[Genetic Sampling
1990s-Present] -->|Advanced to| I[Environmental DNA
2010s-Present]
                        J[Acoustic Monitoring
2000s-Present] -->|Automated with| K[AI Howl Recognition
2015-Present]
                        C --> L[Integrated
Monitoring
Systems]
                        G --> L
                        I --> L
                        K --> L
GPS Collar Technology
Modern wolf collars now weigh under 1% of the animal's body weight and can track location, activity patterns, body temperature, and even heart rate. Data transmission occurs via satellite uplink, eliminating the need for researchers to recapture animals.
Environmental DNA (eDNA)
By collecting water, soil, or snow samples, researchers can identify DNA traces left behind by wolves. This non-invasive approach allows us to confirm wolf presence in areas where direct observation is difficult.
Camera Trap Networks
Motion-activated cameras strategically placed across landscapes capture wolf movements. New AI systems can automatically identify individual wolves based on coat patterns, reducing thousands of hours of manual image review.
Acoustic Monitoring
Specialized microphones record wolf howls across vast areas. Machine learning algorithms can now identify specific packs and even individual wolves, providing crucial data on territory size and pack composition.
Creating effective map data visualizations from these diverse data sources requires specialized approaches. Each technology provides unique insights that, when combined, create a comprehensive picture of wolf population dynamics.
Transforming Complex Wolf Data into Compelling Visualizations
The true challenge I've encountered in wolf conservation isn't just collecting data—it's transforming complex ecological information into visual narratives that resonate with diverse audiences. From scientific publications to public education materials, effective visualization is essential for conservation success.

Interactive 3D visualization of wolf pack territories and movement patterns in Yellowstone National Park
Key Visualization Approaches for Wolf Conservation Data
Territorial Mapping
Dynamic maps showing seasonal territory shifts and pack boundaries.
Predator-Prey Visualization
Interactive networks showing relationships between wolves and various prey species.
Population Trend Analysis
Specialized graphs accounting for confidence intervals and detection probability.
Wolf Pack Movement Visualization Framework
                    flowchart TD
                        subgraph "Data Collection Layer"
                            A1[GPS Collar Data]
                            A2[Camera Trap Images]
                            A3[Field Observations]
                            A4[Genetic Samples]
                        end
                        subgraph "Data Processing Layer"
                            B1[Location Mapping]
                            B2[Movement Pattern Analysis]
                            B3[Territory Calculation]
                            B4[Pack Identification]
                        end
                        subgraph "Visualization Layer"
                            C1[Interactive Maps]
                            C2[Temporal Animations]
                            C3[Statistical Dashboards]
                            C4[Narrative Storyboards]
                        end
                        A1 --> B1
                        A1 --> B2
                        A2 --> B4
                        A3 --> B3
                        A3 --> B4
                        A4 --> B4
                        B1 --> C1
                        B2 --> C2
                        B3 --> C1
                        B3 --> C3
                        B4 --> C3
                        B4 --> C4
Wolf Conservation Stakeholder Dashboard Design
Visualization priorities by stakeholder group (higher values indicate greater importance)
I've found that growth strategies visualization principles can be applied to wolf population recovery efforts. By clearly showing positive trends and ecosystem benefits, we can build broader support for conservation initiatives.
Case Studies: Visual Storytelling of Wolf Recovery Success Stories
Throughout my career, I've had the privilege of working on several landmark wolf conservation visualization projects. These case studies demonstrate how effective visual storytelling can transform technical ecological data into compelling narratives that inspire action.

Before/after visualization showing ecological changes in Yellowstone's Northern Range following wolf reintroduction
Yellowstone National Park: Trophic Cascade Visualization
The reintroduction of wolves to Yellowstone in 1995 provided a natural experiment that revolutionized our understanding of ecosystem dynamics. My team created interactive visualizations that showed how the presence of wolves triggered cascading effects throughout the ecosystem:
                    flowchart TD
                        A[Wolf Reintroduction] -->|Predation| B[Elk Population Reduction]
                        A -->|Behavioral Change| C[Elk Movement Patterns]
                        B --> D[Reduced Browsing Pressure]
                        C --> D
                        D --> E[Riparian Vegetation Recovery]
                        E --> F[Beaver Population Increase]
                        E --> G[Bird Diversity Increase]
                        F --> H[Dam Building Activity]
                        H --> I[Stream Morphology Changes]
                        I --> J[Fish Habitat Improvement]
                        B --> K[Carcass Availability]
                        K --> L[Scavenger Community Benefits]
                        style A fill:#FF8000,stroke:#333,stroke-width:2px
                        style E fill:#90EE90,stroke:#333,stroke-width:1px
                        style F fill:#ADD8E6,stroke:#333,stroke-width:1px
                        style I fill:#ADD8E6,stroke:#333,stroke-width:1px
Great Lakes Region Recovery
Unlike Yellowstone, wolf recovery in Minnesota, Wisconsin, and Michigan occurred naturally as wolves dispersed from Canada. Our visualizations mapped this gradual recolonization process, highlighting how wolves navigated through a fragmented landscape of public and private lands.
Using PageOn.ai's Vibe Creation feature, we transformed complex movement data into accessible educational materials that helped local communities understand wolf behavior in their regions.
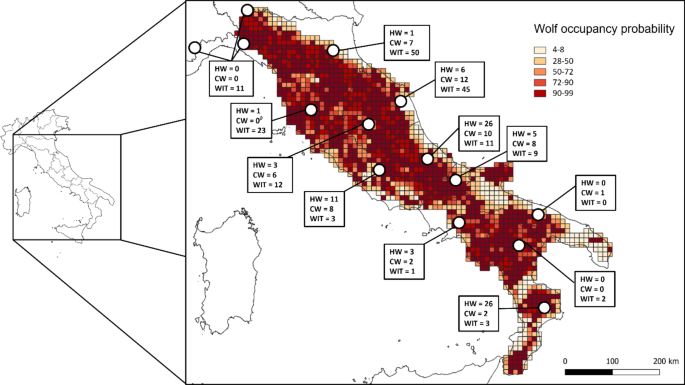
Iberian Wolf Recovery
The Iberian wolf population in Spain and Portugal presents a unique case study in human-wildlife coexistence. Our visualizations focused on showing how traditional livestock management practices, like using guardian dogs, created zones of successful coexistence.
These visualizations helped shift the narrative from conflict to coexistence by highlighting practical solutions that benefited both wolves and human communities.
Mexican Gray Wolf Recovery: Genetic Diversity Challenge
Mexican gray wolf population growth vs. genetic diversity trends (1998-2022)
The Mexican gray wolf reintroduction program faces unique challenges due to the small founding population. Our visualizations highlight the tension between population growth and genetic diversity maintenance, helping conservation managers make informed decisions about cross-fostering and captive breeding programs.
Challenges in Wolf Population Data Visualization
Despite technological advances, visualizing wolf population data presents significant challenges that I've had to address in my work. These challenges span technical, ethical, and communication domains.

Visualization showing confidence intervals and uncertainty ranges in wolf population estimates across different monitoring methods
Key Challenges in Wolf Data Visualization
| Challenge Category | Specific Issue | Visualization Solution |
|---|---|---|
| Detection Probability | Wolves are elusive; not all individuals are detected during surveys | Incorporate confidence intervals and detection probability metrics in population charts |
| Monitoring Gaps | Remote areas may have limited or no monitoring coverage | Use transparent overlay maps showing monitoring intensity across regions |
| Data Privacy | Exact wolf locations can lead to poaching or harassment | Apply geographic generalization techniques to mask precise locations |
| Stakeholder Conflicts | Different audiences interpret same data through different values | Create targeted visualizations for specific stakeholder groups with relevant context |
| Technical Complexity | Wildlife data often requires specialized statistical knowledge | Develop layered visualizations with adjustable complexity for different users |
One particularly challenging aspect of wolf conservation visualization is representing uncertainty. Population estimates always contain a degree of uncertainty, which must be clearly communicated without undermining confidence in the data.
Visualizing Uncertainty in Wolf Population Estimates
Wolf population estimates showing minimum confirmed counts and potential ranges across regions
I've found that PageOn.ai's Agentic capabilities are particularly valuable when creating balanced visual presentations for diverse audiences. The platform helps develop visualizations that acknowledge different perspectives while still maintaining scientific accuracy and conservation objectives.
The Future of Wolf Conservation Technology and Visualization
As I look to the future of wolf conservation, I'm excited by emerging technologies that will transform how we monitor, visualize, and understand wolf populations. These innovations promise to make conservation efforts more effective, efficient, and engaging.
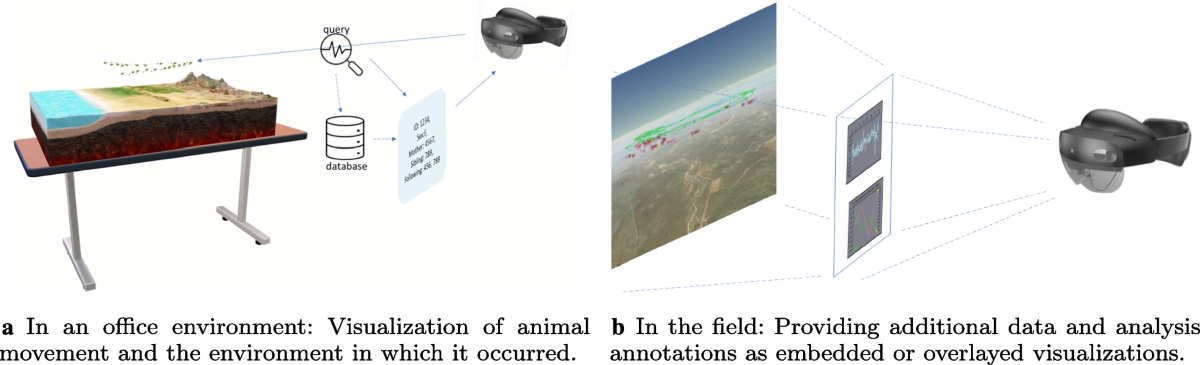
Conceptual augmented reality visualization showing predicted wolf habitat corridors under climate change scenarios
Future Wolf Conservation Technology Landscape
                    flowchart TD
                        A[Current State
2023] --> B[Near Future
2025-2030]
                        B --> C[Long Term
2030+]
                        subgraph "Monitoring Technologies"
                            D1[Advanced Biometric
GPS Collars]
                            D2[Miniaturized
Tracking Devices]
                            D3[Autonomous Drone
Monitoring Networks]
                            D4[Satellite-Based
Individual Recognition]
                        end
                        subgraph "Data Processing"
                            E1[AI-Powered
Image Analysis]
                            E2[Predictive Population
Modeling]
                            E3[Real-Time
Ecosystem Monitoring]
                            E4[Digital Twin
Wolf Ecosystems]
                        end
                        subgraph "Visualization & Engagement"
                            F1[AR/VR Conservation
Experiences]
                            F2[Real-Time Public
Dashboards]
                            F3[Immersive Ecosystem
Simulations]
                            F4[Citizen Science
Integration Platforms]
                        end
                        B --> D1
                        B --> D2
                        B --> E1
                        B --> E2
                        B --> F1
                        B --> F2
                        B --> F4
                        C --> D3
                        C --> D4
                        C --> E3
                        C --> E4
                        C --> F3
Predictive Modeling & Climate Change
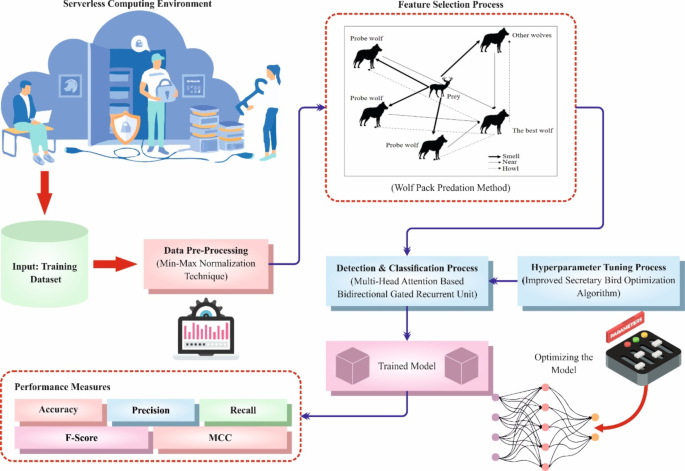
Advanced machine learning models are now being developed to predict wolf population growth and dispersal patterns under different climate scenarios. These models integrate vast datasets on prey availability, habitat connectivity, and human development to forecast how wolf populations might respond to changing conditions.
Citizen Science Integration
The future of wolf monitoring will likely involve sophisticated integration of professional research with citizen science contributions. New platforms are being developed that can validate and incorporate public wolf sightings, trail camera images, and acoustic recordings into formal monitoring networks, dramatically expanding data collection capacity.
Climate Change Impact on Wolf Habitat
Projected changes in suitable wolf habitat across different biomes under climate change scenarios
My experience with great depression visualization techniques has shown that historical recovery patterns can inform how we visualize future resilience scenarios for wolf populations facing climate change and habitat fragmentation.
PageOn.ai offers powerful tools for transforming complex ecological datasets into clear conservation action plans. The platform's ability to integrate diverse data types and create cohesive visual narratives makes it particularly valuable for wildlife conservation projects where communication across diverse stakeholder groups is essential.
Creating Your Own Wolf Conservation Visualization Project
Based on my years of experience in this field, I want to share practical guidance for creating your own wolf conservation visualizations. Whether you're a conservation professional, educator, or concerned citizen, these resources and techniques can help you develop compelling visual stories.
Step-by-step workflow for creating effective wolf conservation visualizations from data collection to presentation
Essential Wolf Data Sources
Government Resources
- U.S. Fish & Wildlife Service Wolf Recovery Reports
- State Wildlife Agency Population Surveys
- National Park Service Monitoring Data
- IUCN Red List Population Assessments
Research Organizations
- International Wolf Center Databases
- University Research Publications
- Wolf Conservation Center Reports
- Yellowstone Wolf Project Annual Reports
Wolf Visualization Project Workflow
                    flowchart TD
                        A[Define Project Goals] --> B[Identify Target Audience]
                        B --> C[Gather & Clean Data]
                        C --> D[Choose Visualization Type]
                        D --> E[Create Initial Design]
                        E --> F[Get Feedback]
                        F --> G[Refine & Finalize]
                        G --> H[Publish & Share]
                        subgraph "Key Considerations"
                            I1[Ethical Data Use]
                            I2[Scientific Accuracy]
                            I3[Narrative Focus]
                            I4[Visual Accessibility]
                        end
                        I1 -.-> C
                        I2 -.-> D
                        I3 -.-> E
                        I4 -.-> G
Tools for Different Audience Needs
| Audience | Visualization Focus | Recommended Tools | Key Considerations |
|---|---|---|---|
| Scientific Community | Statistical accuracy, methodological transparency | R (ggplot2), Python (matplotlib), specialized GIS software | Include confidence intervals, methodology notes, raw data access |
| Policy Makers | Clear trends, economic impacts, management options | Tableau, PowerBI, PageOn.ai dashboards | Focus on actionable insights, regional comparisons, cost-benefit analyses |
| General Public | Engaging narratives, emotional connection | Infographics, interactive web tools, PageOn.ai Vibe Creation | Simplify complex concepts, use compelling imagery, focus on key messages |
| Conservation Organizations | Advocacy tools, fundraising support | StoryMaps, PageOn.ai, Adobe Creative Suite | Balance emotional appeal with scientific credibility, clear calls to action |
Ethical Considerations in Wolf Data Visualization
Location Privacy
Always generalize location data for sensitive species. Consider using grid cells, administrative units, or intentionally imprecise coordinates to prevent targeting of individual animals.
Balanced Representation
Acknowledge multiple stakeholder perspectives, even when creating advocacy-oriented visualizations. Represent data in ways that don't unfairly villainize groups with legitimate concerns.
Transparent Uncertainty
Always clearly communicate data limitations and uncertainty. Avoid creating false impressions of precision when working with estimates or projections.
Using PageOn.ai has significantly streamlined my wolf conservation visualization workflow. The platform's intuitive interface allows me to rapidly prototype and refine data stories without specialized technical skills, making it accessible for conservation professionals who may not have extensive data science backgrounds.
Transform Your Conservation Data with PageOn.ai
Ready to create compelling wolf conservation visualizations? PageOn.ai's powerful tools can help you transform complex ecological data into clear, engaging visual stories that inspire action and understanding.
Whether you're a researcher tracking wolf populations, a conservation organization advocating for protection, or an educator teaching about ecosystem dynamics, effective visualization is key to communicating your message. With the right tools and approaches, you can create powerful visual narratives that advance wolf conservation efforts.
Transform Your Visual Expressions with PageOn.ai
Ready to create your own compelling conservation data visualizations? PageOn.ai provides the tools you need to transform complex ecological data into clear, engaging visual stories that drive understanding and action.
You Might Also Like
The Visual Evolution of American Infrastructure: Canals to Digital Networks | PageOn.ai
Explore America's infrastructure evolution from historic canal networks to railroads, interstate highways, and digital networks with interactive visualizations and timelines.
Google's 9-Hour Prompt Engineering Path to AI Mastery | Complete Visual Guide
Master AI communication through Google's comprehensive 9-hour prompt engineering framework. Learn visual strategies for effective AI interaction and professional success.
Creating Visual AI Ethics Frameworks: A Leadership Guide for Modern Business | PageOn.ai
Discover how to develop comprehensive visual AI ethics frameworks for your organization. This guide helps business leaders translate complex ethical principles into clear visual guidelines.
First Principles Framework for Building Powerful AI Commands | Master AI Prompt Engineering
Learn the first principles approach to crafting powerful AI commands. Master prompt engineering with proven frameworks, templates, and visualization techniques for optimal AI interaction.