Mastering AI-Powered Diagram Creation
A Comprehensive Learning Pathway for Visual Communicators
I've created this guide to help you navigate the exciting intersection of artificial intelligence and visual communication. Whether you're a complete beginner or looking to refine your skills, this step-by-step resource will take you from understanding the basics to achieving mastery in AI-powered diagram creation.
Foundations of AI Diagram Creation
I've found that understanding the intersection between AI and visual communication is essential before diving into the tools themselves. Let me walk you through the foundational concepts that will set you up for success.
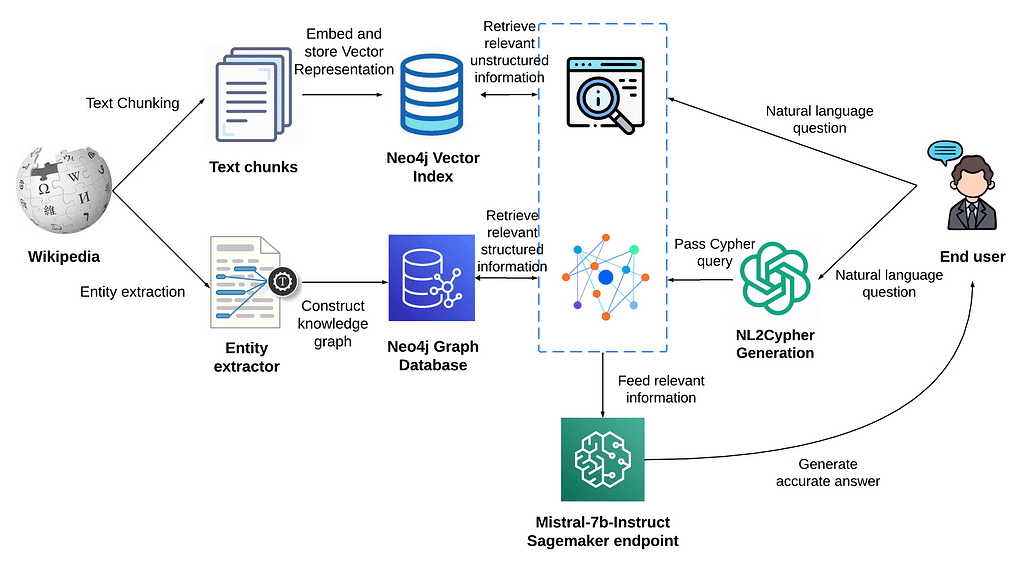
The fundamental process of AI-powered diagram creation: transforming text instructions into structured visual elements
Key Benefits Over Traditional Methods
When I first started exploring ai diagrams, I was amazed by how quickly I could transform complex ideas into visual representations. The efficiency gains are substantial—what used to take hours now takes minutes.
Essential Terminology for Beginners
Prompt Engineering
The practice of crafting effective text instructions that guide AI in generating desired visual outputs.
Visual Grammar
The systematic rules that govern how visual elements relate to each other in diagrams.
Node-Edge Relationships
The connections between elements (nodes) in a diagram through connecting lines (edges).
Visual Hierarchy
The arrangement of elements to show their order of importance through size, color, and positioning.
How AI Interprets Text Instructions
                    flowchart TD
                        A[Text Input] -->|Natural Language Processing| B[Semantic Analysis]
                        B --> C{Pattern Recognition}
                        C -->|Identifies Relationships| D[Node Creation]
                        C -->|Determines Structure| E[Edge Mapping]
                        C -->|Extracts Attributes| F[Visual Styling]
                        D --> G[Visual Assembly]
                        E --> G
                        F --> G
                        G --> H[Rendered Diagram]
                        style A fill:#FF8000,color:white
                        style H fill:#FF8000,color:white
I've learned that AI systems parse your text instructions through several layers of processing. First, they identify key entities and relationships, then determine how these should be visually represented, and finally apply appropriate styling and layout algorithms to create the finished diagram.
Identifying Your Learning Objectives
Before diving deeper into AI diagram tools, I recommend taking a moment to clarify your specific needs and current skill level. This self-assessment will help you navigate the learning resources more effectively:
- Beginner: Focus on simple diagrams like basic flowcharts and mind maps
- Intermediate: Work toward multi-layered diagrams with custom styling
- Advanced: Aim for complex systems diagrams with data integration
Throughout my journey with AI diagram creation, I've found that setting clear learning objectives helps maintain focus and provides a sense of achievement as you progress through increasingly complex visualization techniques.
Getting Started with AI Diagram Tools
Once you understand the foundations, it's time to select the right tools and set up your workspace. I'll guide you through this process to ensure a smooth start to your AI diagram creation journey.
Selecting the Right Tools for Your Skill Level
I've experimented with numerous AI-powered flowchart tools and found that choosing the right one depends on your specific needs and current abilities. Here's my breakdown of options based on skill level:

Comparative overview of popular AI diagram creation tools by skill level requirements and feature sets
| Tool Type | Best For | Learning Curve | Key Features |
|---|---|---|---|
| Text-to-Diagram Converters | Beginners | Low | Simple prompting, template libraries, quick results |
| AI-Enhanced Diagram Editors | Intermediate | Medium | Combined manual and AI capabilities, style customization |
| Advanced AI Visualization Platforms | Advanced | High | Data integration, complex systems modeling, API connectivity |
Setting Up Your First AI Diagram Workspace
I recommend creating a dedicated workspace that allows for focused learning and experimentation. Here's my step-by-step approach to setting up an effective environment:
- Create an account on your chosen AI diagram platform (I recommend PageOn.ai for its intuitive interface)
- Set up a folder structure to organize your learning projects
- Bookmark useful resources and reference materials
- Prepare a collection of sample text descriptions for practice
- Configure any available workspace settings to match your preferences
Understanding Basic Commands and Prompting
                    flowchart LR
                        A[Prompt Structure] --> B[Action Command]
                        A --> C[Content Description]
                        A --> D[Style Specification]
                        A --> E[Output Format]
                        B --> F[Create a flowchart]
                        C --> G[showing user registration process]
                        D --> H[with blue nodes and orange connections]
                        E --> I[optimized for presentation slides]
                        style A fill:#FF8000,color:white
I've found that effective prompting is the key to successful AI diagram creation. Start with clear, specific instructions that include these elements:
- Diagram type: Specify exactly what kind of diagram you want (flowchart, mind map, etc.)
- Content description: Clearly describe the information to be visualized
- Relationship indicators: Use words like "connects to," "leads to," or "includes" to define relationships
- Style preferences: Mention any color schemes, layouts, or visual styles you prefer
Example Prompt:
"Create a flowchart showing the customer support process. Start with 'Customer Inquiry' which branches to 'Simple Question' and 'Complex Issue'. Simple questions lead to 'Quick Response', while complex issues require 'Ticket Creation' followed by 'Specialist Assignment'. After specialist involvement, there's 'Issue Resolution' and finally 'Customer Feedback'. Use green for positive outcomes and orange for process steps."
Common Beginner Mistakes to Avoid
Vague Instructions
Being too general with your prompts leads to unpredictable results. Be specific about elements and relationships.
Overcomplicating
Starting with diagrams that are too complex. Build complexity gradually as you learn.
Ignoring Iterations
Expecting perfect results on the first try. AI diagram creation is an iterative process.
Inconsistent Terminology
Using different terms for the same elements, which confuses the AI's interpretation.
In my early attempts at AI diagram creation, I made all of these mistakes. Learning to be precise, consistent, and patient dramatically improved my results.
Core Skills Development
After getting comfortable with the basics, I focused on developing the core skills that would allow me to create more sophisticated diagrams. Here's my approach to building these fundamental capabilities.
Mastering Prompt Engineering for Diagrams
Before and after examples showing how refined prompts lead to dramatically improved diagram outputs
I've learned that prompt engineering for diagrams is both an art and a science. The way you structure your instructions significantly impacts the quality and accuracy of the generated visualizations. Here are my proven techniques:
The CLEAR Prompting Framework
- Context: Briefly explain the purpose of the diagram
- Layout: Specify the structure (hierarchical, circular, linear)
- Elements: List all components that should appear
- Associations: Define how elements relate to each other
- Refinements: Add styling preferences and special requirements
Using this framework has helped me transform text into professional diagrams with much greater consistency and precision.
Learning Visual Grammar for AI Tools
                    flowchart TD
                        subgraph "Visual Grammar Elements"
                            A[Nodes/Objects] --- B[Connections/Relationships]
                            A --- C[Containment/Grouping]
                            A --- D[Sequence/Order]
                            A --- E[Hierarchy/Importance]
                        end
                        subgraph "AI Interpretation"
                            F[Entity Recognition] --- G[Relationship Mapping]
                            F --- H[Structural Analysis]
                            F --- I[Priority Assignment]
                        end
                        A --> F
                        B --> G
                        C --> H
                        D --> H
                        E --> I
                        style A fill:#FF8000,color:white
                        style B fill:#FF8000,color:white
                        style C fill:#FF8000,color:white
                        style D fill:#FF8000,color:white
                        style E fill:#FF8000,color:white
I've discovered that AI diagram tools understand certain patterns and structures better than others. Learning this visual grammar has been crucial to getting predictable results:
- Entity clarity: Clearly define distinct elements with specific names
- Relationship directness: Use explicit directional language (A leads to B, X depends on Y)
- Hierarchical indicators: Use consistent terminology for levels (parent/child, contains/belongs to)
- Attribute association: Clearly link properties to their respective elements
Building a Personal Library of Successful Prompts
One of the most valuable practices I've developed is maintaining a collection of successful prompts and their resulting diagrams. This library serves as:
- A reference for future similar diagrams
- A learning tool to identify patterns in effective prompting
- A time-saving resource for common diagram types
- A progress tracker showing my skill development
Prompt Library Structure Example:
PROMPT: "Create a flowchart showing the customer journey from awareness to purchase.
Include stages for Discovery, Consideration, Decision, and Post-Purchase.
Each stage should have 2-3 key touchpoints. Use blue for stages and green for touchpoints."
PROMPT: "Generate a mind map for project planning with the central node 'New Product Launch'.
Branch into main categories: Timeline, Resources, Marketing, Development, and Budget.
Each category should have 3-4 relevant sub-elements. Use a colorful scheme with distinct
colors for each main branch."
Developing an Iterative Improvement Process
I've learned that the most effective approach to AI diagram creation is iterative. My process typically follows these steps:
- Initial prompt: Create a basic version of the desired diagram
- Critical assessment: Identify specific areas for improvement
- Targeted refinement: Modify prompts to address those specific issues
- Comparison: Evaluate the new version against the original
- Final adjustments: Make minor tweaks to perfect the diagram
This iterative approach has consistently yielded better results than trying to get everything perfect in a single attempt. With each iteration, I gain insights that improve not just the current diagram but my overall skills.
Advanced Diagram Techniques
As I became more comfortable with the fundamentals, I began exploring advanced techniques that allow for the creation of truly sophisticated diagrams. Here's what I've learned about pushing the boundaries of AI-powered visualization.
Creating Multi-layered, Complex Visual Systems
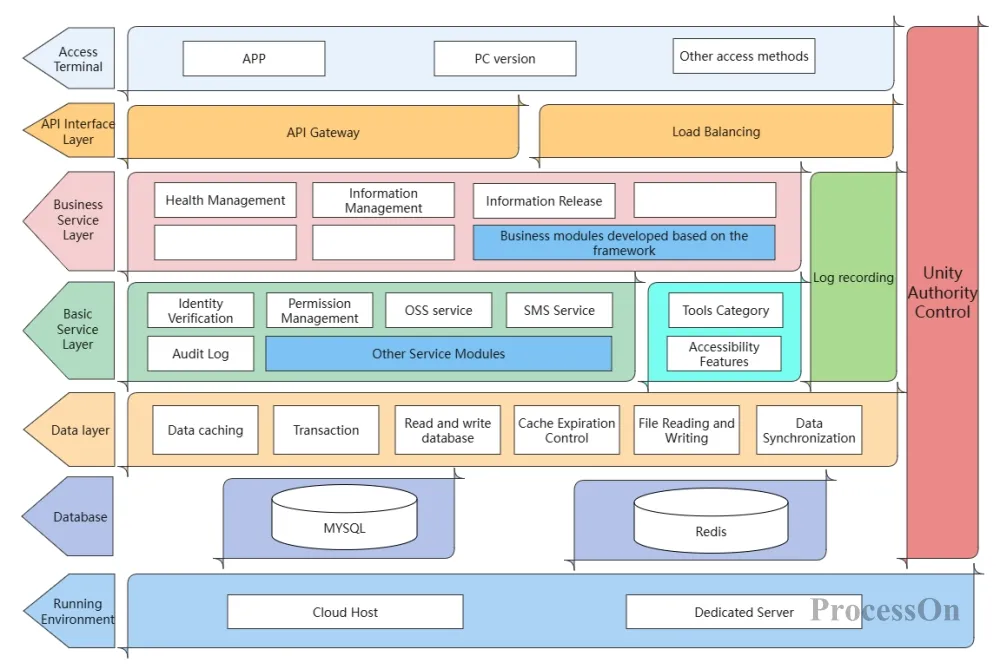
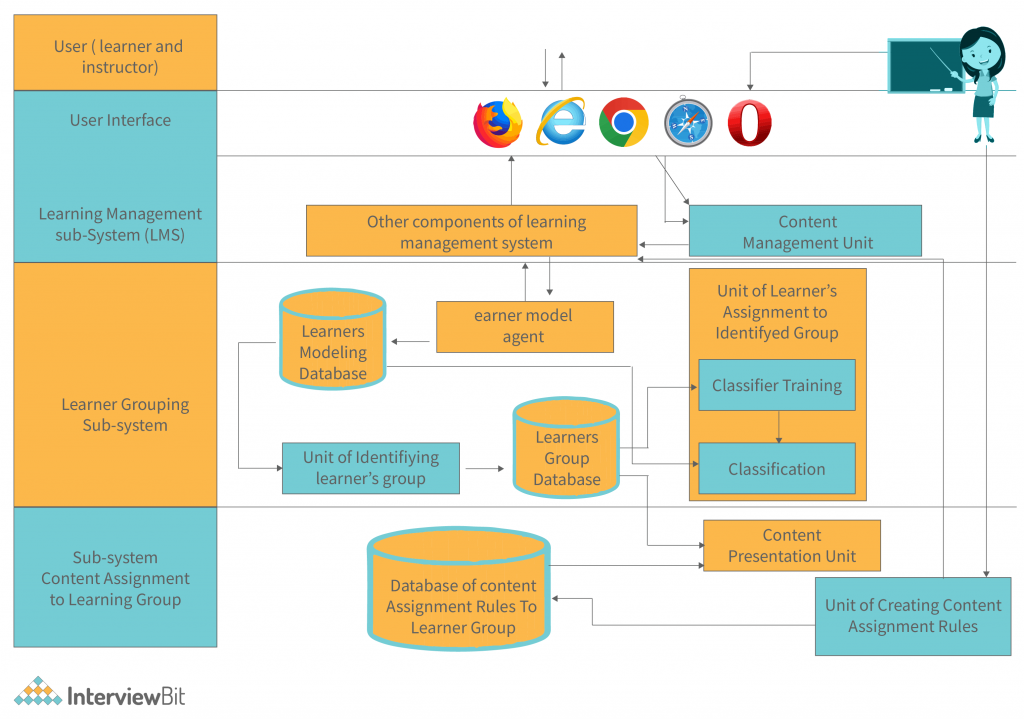
Example of a multi-layered system diagram created using advanced AI prompting techniques
I've discovered that creating complex, multi-layered diagrams requires a structured approach. Rather than attempting to generate the entire system at once, I break it down into logical components:
- Define the core layers or domains of your system
- Create individual diagrams for each layer
- Establish clear interface points between layers
- Use consistent naming conventions across all components
- Gradually integrate the layers using PageOn.ai's AI Blocks feature
                    flowchart TD
                        subgraph "User Interface Layer"
                            UI1[Dashboard] --- UI2[Forms]
                            UI2 --- UI3[Reports]
                        end
                        subgraph "Application Layer"
                            A1[Controllers] --- A2[Services]
                            A2 --- A3[Utilities]
                        end
                        subgraph "Data Layer"
                            D1[Models] --- D2[Repositories]
                            D2 --- D3[Database]
                        end
                        UI1 --> A1
                        UI2 --> A1
                        UI3 --> A2
                        A1 --> D1
                        A2 --> D2
                        A3 --> D1
                        A3 --> D2
                        style UI1 fill:#FF8000,color:white
                        style UI2 fill:#FF8000,color:white
                        style UI3 fill:#FF8000,color:white
                        style A1 fill:#42A5F5,color:white
                        style A2 fill:#42A5F5,color:white
                        style A3 fill:#42A5F5,color:white
                        style D1 fill:#66BB6A,color:white
                        style D2 fill:#66BB6A,color:white
                        style D3 fill:#66BB6A,color:white
Customizing AI-Generated Diagrams for Brand Consistency
One of the challenges I faced was making AI-generated diagrams match specific brand guidelines. I've developed these strategies for consistent customization:
- Color palette specification: Include exact hex codes in your prompts
- Typography guidance: Mention font preferences where supported
- Style templates: Create a library of style-specific prompts
- Post-generation editing: Use PageOn.ai's editing features to refine visual elements
Style-Specific Prompt Example:
"Create a process flow diagram showing the content approval workflow. Use our brand colors: primary blue (#0052CC) for main process nodes, accent green (#36B37E) for decision points, and light gray (#F4F5F7) for connecting arrows. Apply a minimalist style with rounded rectangles and adequate white space between elements."
Combining Different Diagram Types
Hybrid diagram combining multiple visualization types to tell a comprehensive story
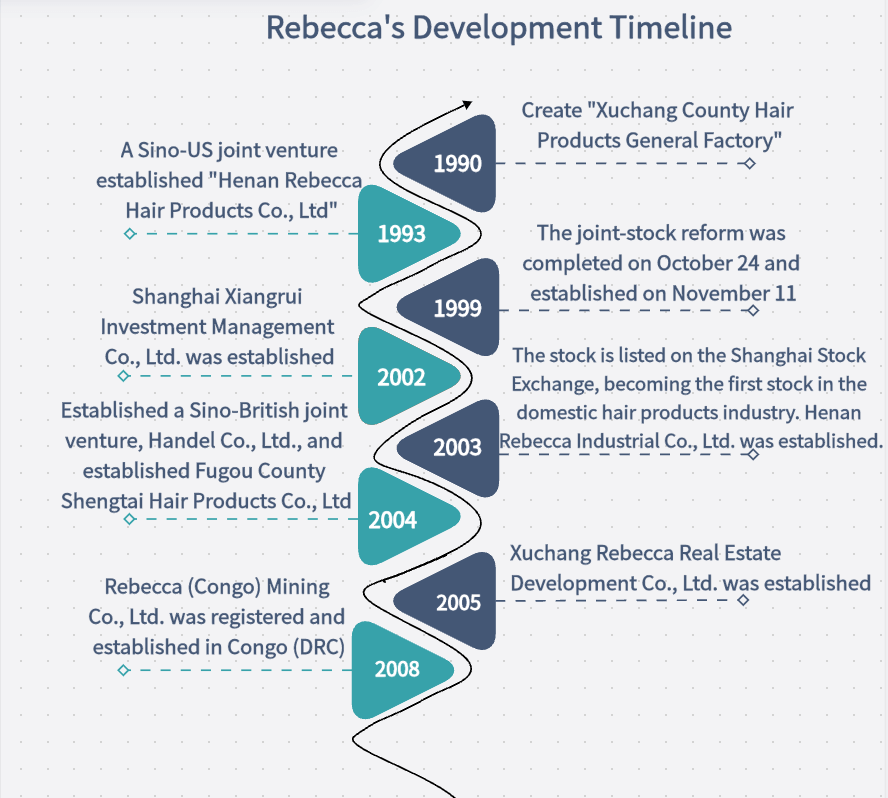
Some of my most effective visualizations combine multiple diagram types within a single coherent narrative. I've found success with these combinations:
Flowchart + Timeline
Perfect for showing processes that evolve over time or have distinct phases.
Mind Map + Data Charts
Combines conceptual relationships with quantitative insights.
System Diagram + User Journey
Shows both technical architecture and the user experience it enables.
Hierarchy Chart + Process Flow
Illustrates both organizational structure and operational procedures.
Leveraging PageOn.ai's AI Blocks
One of my favorite advanced techniques is using PageOn.ai's AI Blocks feature to build sophisticated diagram components that can be reused and combined. This modular approach offers several advantages:
- Create consistent visual elements across multiple diagrams
- Build complex visualizations incrementally
- Maintain libraries of common diagram patterns
- Easily update components across multiple diagrams
By mastering these advanced techniques, I've been able to create diagrams that not only communicate complex information clearly but also maintain visual consistency and professional polish across all my projects.
Specialized Diagram Applications
As I've developed my skills, I've explored how AI-powered diagram creation can be applied to specific domains and use cases. Each field has unique visualization requirements and conventions that can be addressed with tailored approaches.
Technical Diagram Creation
                    flowchart TD
                        subgraph "Frontend"
                            A[Web Client] --- B[Mobile App]
                            A --- C[Admin Portal]
                        end
                        subgraph "API Layer"
                            D[API Gateway] --- E[Authentication]
                            D --- F[Rate Limiting]
                        end
                        subgraph "Backend Services"
                            G[User Service] --- H[Content Service]
                            H --- I[Analytics Service]
                        end
                        subgraph "Data Storage"
                            J[SQL Database] --- K[NoSQL Database]
                            K --- L[Object Storage]
                        end
                        A --> D
                        B --> D
                        C --> D
                        D --> G
                        D --> H
                        D --> I
                        G --> J
                        H --> K
                        I --> L
                        style A fill:#FF8000,color:white
                        style B fill:#FF8000,color:white
                        style C fill:#FF8000,color:white
                        style D fill:#42A5F5,color:white
                        style E fill:#42A5F5,color:white
                        style F fill:#42A5F5,color:white
When creating technical diagrams for software architecture or systems design, I've found these techniques particularly effective:
- Use consistent shapes for similar components (e.g., cylinders for databases)
- Apply color coding to distinguish system layers or domains
- Include clear directional flow indicators for data or process movement
- Add annotations for important technical details or constraints
- Maintain appropriate levels of abstraction based on the audience
Business Process Mapping
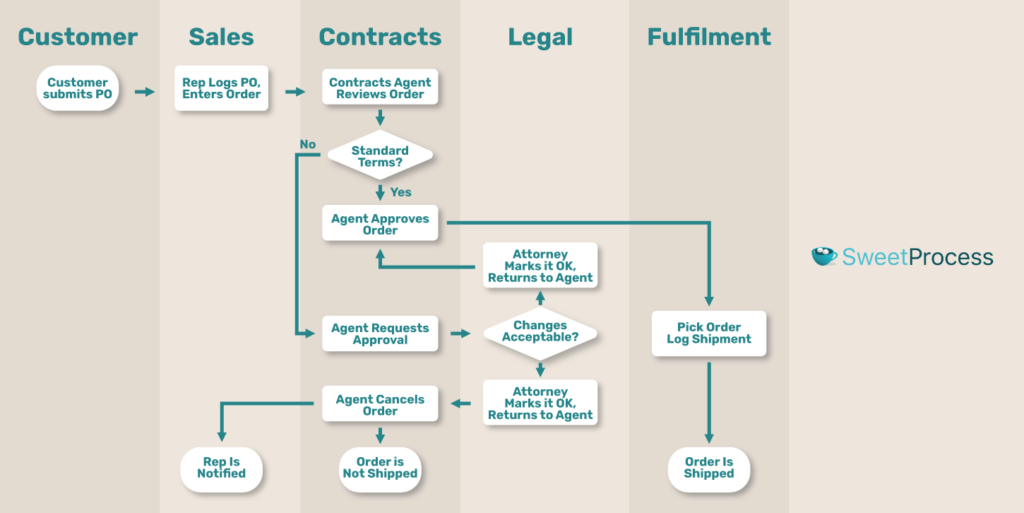
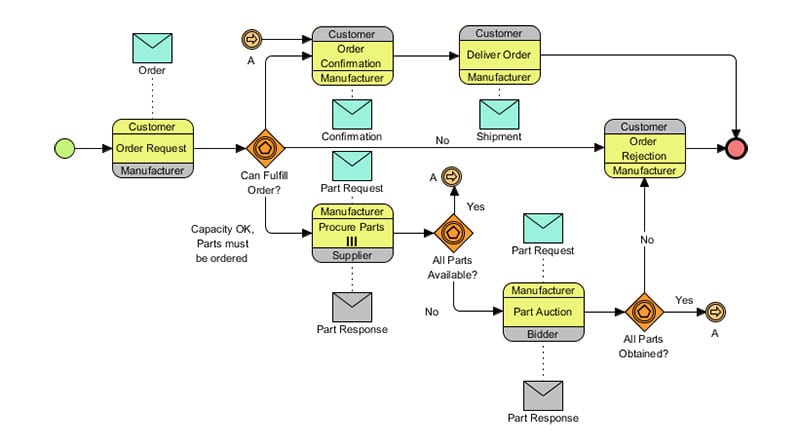
Business process diagram with role-based swimlanes and optimization opportunities highlighted
For business process mapping, I focus on creating diagrams that clearly show workflow optimization opportunities:
- Use swimlanes to clarify responsibilities across departments or roles
- Highlight decision points and their impact on process flow
- Identify and visually distinguish value-adding vs. non-value-adding steps
- Include time estimates for each process step when relevant
- Use color coding to indicate process health (red for bottlenecks, green for efficient steps)
Educational and Training Materials
When creating educational diagrams, I've learned to implement progressive disclosure techniques that gradually build understanding:
- Start with simplified overview diagrams that establish core concepts
- Create sequential diagrams that add layers of complexity in logical order
- Use consistent visual language across the learning sequence
- Include clear annotations that explain key elements
- Provide comparison diagrams to highlight differences and similarities
Marketing and Presentation Diagrams
For compelling storytelling in marketing materials, I focus on creating visually striking diagrams that:
- Emphasize benefits rather than features
- Use metaphorical visualization when appropriate (e.g., journey, growth, transformation)
- Incorporate brand colors and styling consistently
- Simplify complex concepts for quick comprehension
- Create visual hierarchy that guides the viewer's attention
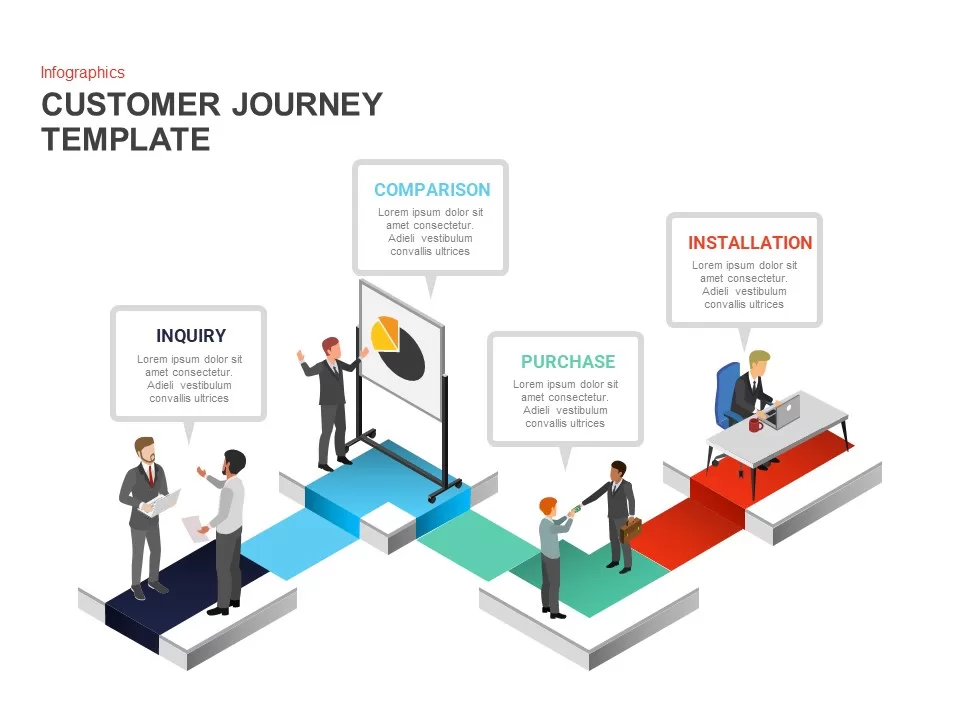
Marketing-focused customer journey visualization using metaphorical elements and brand styling
I've found that comparing different ai art tools helps me select the right approach for each diagram need, especially when creating marketing materials that need to be visually distinctive.
Resource Optimization and Efficiency
As I've become more experienced with AI diagram creation, I've developed strategies to optimize resources and maximize efficiency. These approaches help me create high-quality visualizations while managing costs and time effectively.
Cost-Effective Diagram Creation
I've explored various free AI tools for generating images and diagrams, finding that a strategic approach helps balance quality with cost:
Free Tools for Basics
Use free tools for initial concepts and simple diagrams where advanced features aren't necessary.
Tiered Approach
Reserve premium tools for client-facing or complex visualizations where quality is paramount.
Batch Processing
Group similar diagram tasks to maximize subscription value during active periods.
Template Reuse
Create base templates that can be modified for multiple projects to reduce generation costs.
Understanding Computational Requirements
Understanding the ai compute visual guide has helped me plan my diagram creation more efficiently. I've learned that:
- Diagram complexity directly impacts processing requirements and generation time
- Breaking complex diagrams into modular components reduces compute needs
- Providing clearer instructions often results in faster, more efficient generation
- Local processing options may be more cost-effective for frequent, simple diagrams
- Cloud-based solutions scale better for complex or occasional diagram needs
Time-Saving Techniques
Time comparison between traditional and optimized AI diagram creation workflows
I've developed several strategies that significantly reduce the time needed to create professional diagrams:
- Prompt libraries: Maintain a collection of pre-tested prompts for common diagram types
- Style presets: Create reusable style definitions that can be applied consistently
- Batched generation: Group similar diagram tasks to minimize context-switching
- Progressive refinement: Start with a simple version and iteratively add detail
- Component reuse: Build a library of diagram components that can be combined
Creating Reusable Templates with PageOn.ai
                    flowchart TD
                        A[Template Library] --> B{Select Base Template}
                        B --> C[Customize Content]
                        B --> D[Adjust Styling]
                        B --> E[Modify Structure]
                        C --> F[Generate Variant]
                        D --> F
                        E --> F
                        F --> G[Save as New Template]
                        F --> H[Export Final Diagram]
                        G --> A
                        style A fill:#FF8000,color:white
                        style F fill:#42A5F5,color:white
                        style H fill:#66BB6A,color:white
One of the most powerful efficiency techniques I've discovered is using PageOn.ai's AI Blocks to create reusable templates. This approach offers several benefits:
- Ensures visual consistency across multiple diagrams
- Dramatically reduces creation time for similar diagrams
- Simplifies updates when information or styling needs change
- Enables team collaboration through shared template libraries
- Maintains brand consistency across different creators
By implementing these resource optimization strategies, I've been able to create more diagrams in less time while maintaining high quality and managing costs effectively.
Practical Learning Projects
I've found that the most effective way to develop AI diagram skills is through hands-on practice with structured projects. Here are some practical exercises I've created to help build proficiency in a systematic way.
Step-by-Step Tutorial: Organizational Chart
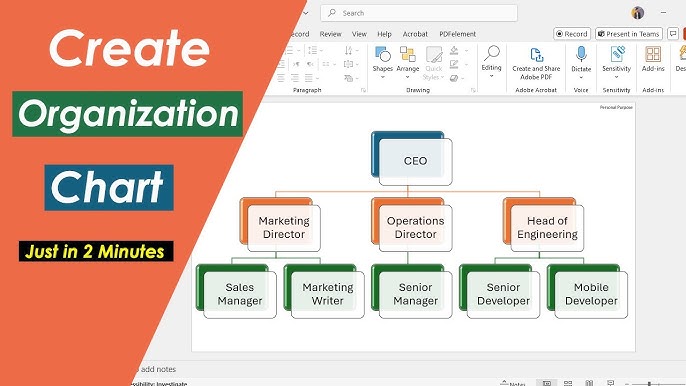
Step-by-step process for creating an organizational chart from text description
Let me walk you through creating an organizational chart from a text description:
- Prepare your text description: Write out the organizational structure with clear reporting relationships
- Structure your prompt: Specify that you want an organizational chart with hierarchical layout
- Add style guidance: Request appropriate styling (e.g., "Use blue for executive level, green for management, and gray for staff positions")
- Generate initial chart: Create the first version of your chart
- Refine structure: Adjust any incorrect reporting relationships or missing positions
- Enhance with details: Add names, departments, or other relevant information
Sample Organizational Chart Prompt:
"Create an organizational chart for a marketing department. The Chief Marketing Officer (Sarah Johnson) leads the department. Reporting to the CMO are the Director of Digital Marketing (Michael Chen), Director of Brand Management (Aisha Patel), and Director of Market Research (David Rodriguez). The Digital Marketing team includes a Social Media Manager (Taylor Wilson), SEO Specialist (James Kim), and Content Strategist (Emma Davis). The Brand Management team includes a Brand Designer (Carlos Mendez) and Brand Strategist (Olivia Thompson). The Market Research team includes a Data Analyst (Zoe Martin) and Research Coordinator (Liam Johnson). Use blue for executive level, green for director level, and gray for team members."
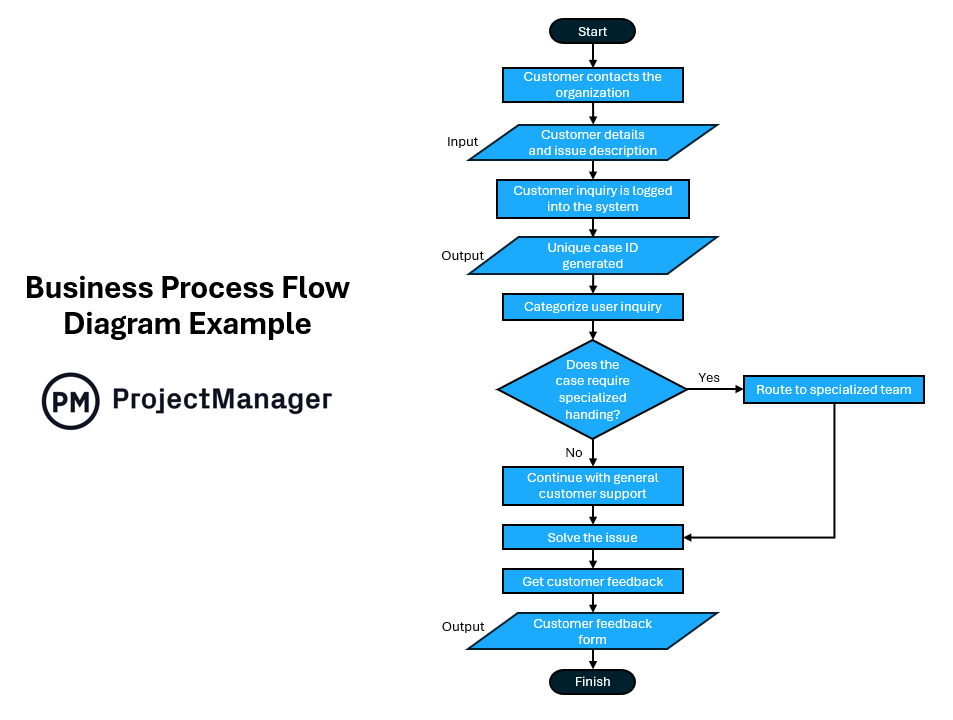
Guided Practice: Complex Process Visualization
                    flowchart TD
                        A[Product Request] --> B{Initial Review}
                        B -->|Approved| C[Requirements Gathering]
                        B -->|Rejected| D[Feedback to Requestor]
                        D --> A
                        C --> E[Design Phase]
                        E --> F[Design Review]
                        F -->|Approved| G[Development]
                        F -->|Changes Needed| E
                        G --> H[QA Testing]
                        H -->|Passes| I[User Acceptance]
                        H -->|Fails| G
                        I -->|Approved| J[Deployment]
                        I -->|Rejected| K[Revision Planning]
                        K --> E
                        J --> L[Post-Launch Review]
                        style A fill:#FF8000,color:white
                        style J fill:#66BB6A,color:white
                        style L fill:#42A5F5,color:white
For this guided practice, I'll demonstrate how to transform a complex product development process into a clear visual workflow:
- Identify process stages: List all major steps in the process
- Map decision points: Identify where the process branches based on decisions
- Note feedback loops: Identify where the process may return to earlier stages
- Create initial flow: Generate a basic flowchart showing the main path
- Add decision branches: Incorporate decision points with multiple outcomes
- Include feedback loops: Add paths that return to earlier stages
- Refine and style: Improve clarity and apply appropriate visual styling
Challenge Exercise: Technical Document Visualization
This more advanced exercise challenges you to convert a technical document into a comprehensive visual system map:
- Document analysis: Identify key systems, components, and relationships
- Information architecture: Organize components into logical groups
- Layer planning: Decide which aspects to represent in different visual layers
- Component visualization: Create individual diagrams for major subsystems
- Integration mapping: Show how the components interconnect
- Review and refinement: Ensure the visualization accurately represents the document
- Add annotations: Include explanatory notes for complex elements
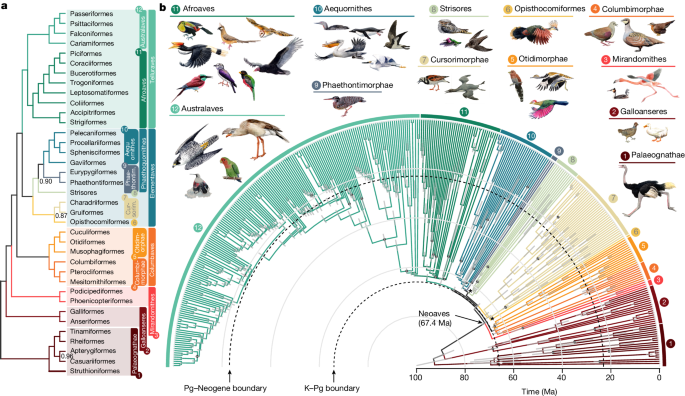
Example of a technical document converted into a comprehensive system architecture diagram
Portfolio Development Project
To showcase your growing skills, I recommend creating a diverse portfolio of diagram samples:
- Process flowchart: Visualize a business or technical process
- Concept map: Create a diagram showing relationships between ideas
- System architecture: Design a technical system visualization
- Decision tree: Map out a complex decision-making process
- Data visualization: Present information in a visually compelling way
- Timeline: Show progression of events or project phases
For each portfolio piece, document your process, including the initial prompt, any iterations, and the final result. This documentation demonstrates your systematic approach and problem-solving abilities.
By completing these practical learning projects, you'll develop both technical skills and creative approaches to diagram creation. Each project builds on previous knowledge while introducing new challenges, ensuring steady progress toward mastery.
Continuous Improvement and Mastery
As I've progressed in my AI diagram creation journey, I've learned that mastery is an ongoing process. Here are the strategies I use to continuously improve my skills and stay at the cutting edge.
Establishing a Personal Learning Roadmap
Example of a personal learning roadmap for mastering AI diagram creation
I recommend creating a structured learning roadmap that outlines your skill development journey:
- Skill assessment: Honestly evaluate your current strengths and weaknesses
- Goal setting: Define specific, measurable objectives for improvement
- Learning resources: Identify tutorials, courses, and practice opportunities
- Progress tracking: Establish milestones and methods to measure advancement
- Feedback mechanism: Create a system for getting input on your work
- Revision schedule: Plan regular reviews of your roadmap to adjust as needed
Advanced Prompt Engineering Techniques
                    flowchart TD
                        A[Basic Prompt] --> B[Contextual Prompt]
                        B --> C[Structured Prompt]
                        C --> D[Iterative Prompt]
                        D --> E[System-Aware Prompt]
                        A1[Simple instructions] --> A
                        B1[Domain context] --> B
                        B2[Purpose definition] --> B
                        C1[Component breakdown] --> C
                        C2[Relationship mapping] --> C
                        D1[Feedback integration] --> D
                        D2[Progressive refinement] --> D
                        E1[Tool-specific syntax] --> E
                        E2[Advanced parameters] --> E
                        style A fill:#FF8000,color:white
                        style E fill:#FF8000,color:white
As I've advanced in my journey, I've developed more sophisticated prompting techniques:
- Chain prompting: Breaking complex diagrams into sequential generation steps
- Comparative prompting: Requesting variations with specific differences for comparison
- Constraint-based prompting: Setting explicit boundaries and requirements
- Style transfer: Using reference images to guide visual styling
- Hybrid prompting: Combining text instructions with visual examples
Advanced Prompt Example:
"Create a system architecture diagram for a cloud-based e-commerce platform. Use a modern, minimalist style with a light blue background (#F5F9FF). Organize components into three distinct layers: Frontend (top), Application Services (middle), and Data Infrastructure (bottom). In the Frontend layer, include Web Interface, Mobile App, and Admin Portal components connected to an API Gateway. In the Application Services layer, include User Management, Product Catalog, Order Processing, Payment System, and Inventory Management. In the Data Infrastructure layer, include Relational Database, Document Store, Cache System, and Data Warehouse. Show connections between related components with dotted lines. Use consistent icons for each component type: user interfaces should have screen icons, services should have gear icons, and data components should have cylinder icons. Add a brief description for each component using annotations."
Keeping Up with New Capabilities
The field of AI-powered visualization is evolving rapidly. I stay current through these practices:
- Subscribe to updates from major AI diagram tool providers
- Participate in online communities focused on AI visualization
- Regularly experiment with new features as they're released
- Follow thought leaders in the field on social media and blogs
- Allocate time specifically for learning and testing new capabilities
Building a Community of Practice
I've found tremendous value in connecting with other AI diagram creators. Here's how I build and engage with my community:
- Join online forums and discussion groups focused on AI visualization
- Share your work and process to get feedback from peers
- Participate in challenges or group projects to practice new skills
- Contribute to open-source diagram libraries or templates
- Organize or attend virtual meetups to discuss techniques and trends
Developing Your Unique Style
As you advance in your journey, I encourage you to develop your own distinctive approach to AI diagram creation:
- Identify visual elements that resonate with your aesthetic preferences
- Develop signature patterns or layouts that become recognizable
- Create a personal color palette that you use consistently
- Experiment with unique combinations of diagram types
- Incorporate personal insights from your professional background
Evolution of a personal diagram style showing progressive refinement and distinctive elements
By focusing on continuous improvement and developing your unique approach, you'll not only master AI diagram creation but also establish your own visual voice that makes your work instantly recognizable and valuable.
Transform Your Visual Expressions with PageOn.ai
Ready to put these learning resources into practice? PageOn.ai provides the perfect platform to master AI-powered diagram creation, with intuitive tools that make it easy to transform complex ideas into clear, professional visualizations.
Your Journey to AI Diagram Mastery
Throughout this guide, I've shared my step-by-step approach to mastering AI-powered diagram creation. From understanding the foundations to developing advanced techniques, each stage builds upon the previous one to develop comprehensive visualization skills.
Remember that mastery is an ongoing journey rather than a destination. As AI technology continues to evolve, so too will the possibilities for creating increasingly sophisticated and impactful diagrams. The learning pathway I've outlined provides a structure for continuous growth and improvement.
I encourage you to start with simple projects that build confidence, then gradually tackle more complex visualization challenges. By following this progressive approach and regularly practicing with tools like PageOn.ai, you'll develop the skills to transform any concept into a clear, compelling visual representation.
The ability to create powerful AI-powered diagrams is increasingly valuable across industries and roles. Whether you're explaining complex systems, mapping business processes, creating educational materials, or developing marketing assets, the skills you develop through this learning pathway will serve as a valuable professional asset.
You Might Also Like
Building New Slides from Prompts in Seconds | AI-Powered Presentation Creation
Discover how to create professional presentations instantly using AI prompts. Learn techniques for crafting perfect prompts that generate stunning slides without design skills.
Advanced Shape Effects for Professional Slide Design | Transform Your Presentations
Discover professional slide design techniques using advanced shape effects. Learn strategic implementation, customization, and optimization to create stunning presentations that engage audiences.
Stock Photos in Presentations: Bringing Vibrancy and Depth to Visual Storytelling
Discover how to transform your presentations with strategic stock photography. Learn selection techniques, design integration, and visual consistency to create compelling visual narratives.
Beyond Bullet Points: Transform Your Text with Animated Visuals | PageOn.ai
Discover how to transform static bullet points into dynamic animated visuals that boost engagement by 40%. Learn animation fundamentals, techniques, and AI-powered solutions from PageOn.ai.