The PDR Security Framework
Visualizing Protection, Detection, and Response for Modern Security Teams
I've spent years implementing security frameworks across organizations of all sizes. The PDR approach has consistently proven to be the most effective way to structure comprehensive security programs that can adapt to evolving threats.
Understanding the PDR Security Framework Foundations
I've found that the most effective security programs are built on a strong conceptual foundation. The PDR framework—Protection, Detection, Response—provides exactly that structure. Unlike traditional security models that often focus heavily on preventative measures, PDR acknowledges the reality that no protection is perfect, making detection and response equally crucial components.
flowchart TD
    subgraph "PDR Framework"
        P[Protection]
        D[Detection]
        R[Response]
    end
    P -->|"Prevents known threats"| D
    D -->|"Identifies breaches"| R
    R -->|"Improves"| P
    classDef pillar fill:#FF8000,stroke:#333,stroke-width:2px,color:white;
    class P,D,R pillar;
Figure 1: The cyclical relationship between Protection, Detection, and Response
The PDR approach addresses modern threat landscape challenges through comprehensive coverage. Where traditional security models might focus predominantly on building stronger walls (protection), PDR acknowledges that breaches are inevitable and builds equally robust capabilities to identify (detection) and address (response) security incidents.
Key Advantages of PDR Framework
I've found that visualizing the cyclical nature of PDR implementation helps teams understand how these components work together. By using agentic workflows with PageOn.ai's AI Blocks, security teams can create dynamic representations of their security posture that evolve as threats and defenses change.
When I implement PDR frameworks for clients, I always emphasize that these three pillars aren't separate initiatives—they're deeply interconnected systems that must work in harmony. The visual representation helps stakeholders understand this crucial relationship.
The Protection Pillar: Preventative Security Measures
The Protection pillar forms the foundation of any security program. I've learned that effective protection isn't just about deploying security tools—it's about understanding your assets, their value, and implementing appropriate safeguards based on risk.
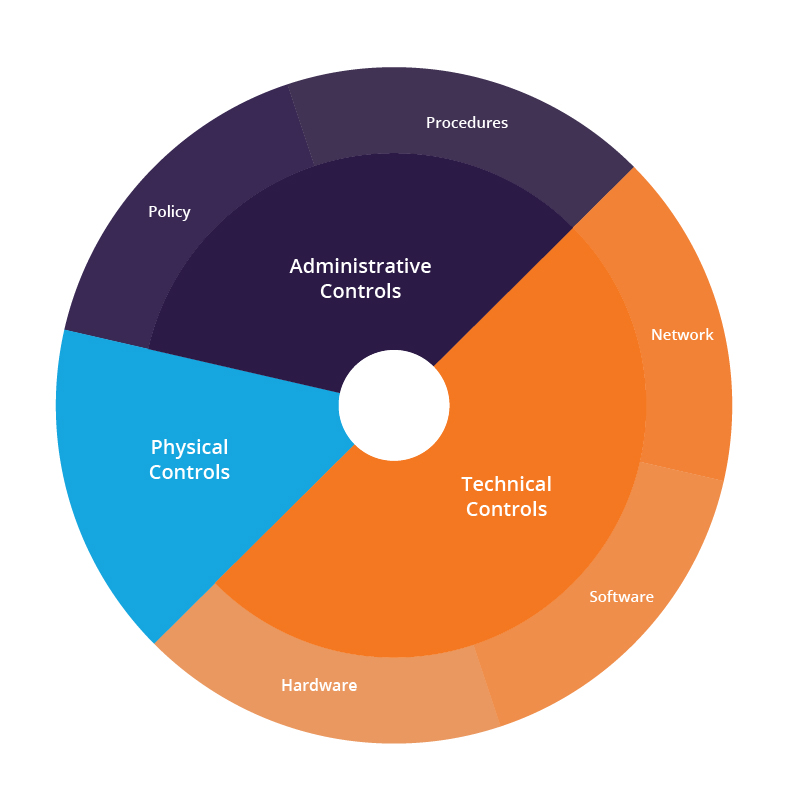
Figure 2: Layered protection model illustrating defense-in-depth strategy
Mapping Critical Protection Mechanisms
When mapping protection mechanisms, I create visual asset inventories with risk profiles attached. This approach helps organizations prioritize their security investments based on the potential impact of compromises.
flowchart TD
    subgraph "Network Security"
        FW[Firewalls]
        IPS[Intrusion Prevention]
        VPN[VPN Access]
        SEG[Network Segmentation]
    end
    subgraph "Endpoint Security"
        EPP[Endpoint Protection]
        EDR[Endpoint Detection & Response]
        DLP[Data Loss Prevention]
        PATCH[Patch Management]
    end
    subgraph "Identity & Access"
        IAM[Identity Management]
        MFA[Multi-Factor Auth]
        PAM[Privileged Access]
        RBAC[Role-Based Access]
    end
    subgraph "Data Security"
        ENC[Encryption]
        CLASS[Data Classification]
        DRM[Digital Rights Management]
        MASK[Data Masking]
    end
    classDef critical fill:#FF4136,stroke:#333,stroke-width:1px,color:white;
    classDef high fill:#FF851B,stroke:#333,stroke-width:1px,color:white;
    classDef medium fill:#FFDC00,stroke:#333,stroke-width:1px,color:black;
    classDef standard fill:#2ECC40,stroke:#333,stroke-width:1px,color:white;
    class FW,IAM,MFA,PAM,ENC critical;
    class IPS,EDR,DLP,RBAC,CLASS high;
    class VPN,EPP,PATCH,DRM medium;
    class SEG,MASK standard;
Figure 3: Protection mechanisms mapped by domain and criticality
Developing protection policies requires aligning security controls with organizational risk tolerance. I use protocol documentation to clearly communicate these requirements across the organization.
Zero-Trust Architecture Visualization
I've found that implementing zero-trust architecture is one of the most effective protection strategies for modern organizations. By visualizing security boundaries and trust relationships between systems, teams can identify potential weaknesses in their protection strategy.

Figure 4: Zero-trust architecture visualization showing verification at every access point
Using PageOn.ai's Deep Search integration, I can create dynamic visualizations of zero-trust implementations that help teams understand how to apply the "never trust, always verify" principle across their infrastructure.
In my experience, the protection pillar is where most organizations have the most mature capabilities. However, I often find that these protections aren't properly documented or visualized, making it difficult to identify gaps. Creating visual representations of your protection mechanisms is crucial for comprehensive security.
The Detection Pillar: Identifying Security Events
The Detection pillar is often where I see the biggest opportunities for improvement in security programs. With the volume of security events growing exponentially, organizations need structured approaches to identify genuine threats amidst the noise.
Detection Coverage Visualization

Figure 5: Detection coverage heat map across enterprise environments
Creating detection matrices that map threats to monitoring capabilities helps identify blind spots in your security monitoring. I've developed a framework for visualizing detection coverage that helps security teams prioritize investments in monitoring capabilities.
Alert Prioritization Framework
Building alert prioritization frameworks with visual severity indicators helps security teams focus on the most significant threats. I've implemented detection workflows that reduce alert fatigue by categorizing alerts based on impact and confidence levels.
Transforming SIEM Data into Visual Insights
One of the biggest challenges in security operations is making sense of the massive volume of data collected by Security Information and Event Management (SIEM) systems. Using PageOn.ai's data visualization capabilities, I've helped teams transform complex SIEM data into actionable visual insights.

Figure 6: SIEM data visualization showing attack patterns and anomalies
Detection is where I see the most significant evolution in security practices. The shift from signature-based detection to behavior analytics and AI-powered anomaly detection requires new visualization approaches to help analysts understand complex patterns and relationships in security data.
The Response Pillar: Effective Incident Handling
The Response pillar is where preparation meets execution. In my experience, the effectiveness of incident response often determines the ultimate impact of a security breach. Well-prepared teams with clear playbooks consistently achieve better outcomes.
Visual Incident Response Playbooks
flowchart TD
    START((Incident Detected)) --> ASSESS[Initial Assessment]
    ASSESS --> CLASSIFY{Classify Severity}
    CLASSIFY -->|Critical| CRITICAL[Activate Crisis Team]
    CLASSIFY -->|High| HIGH[Escalate to Security Lead]
    CLASSIFY -->|Medium| MEDIUM[Standard Response]
    CLASSIFY -->|Low| LOW[Routine Handling]
    CRITICAL --> CONTAIN1[Emergency Containment]
    HIGH --> CONTAIN2[Priority Containment]
    MEDIUM --> CONTAIN3[Standard Containment]
    LOW --> CONTAIN4[Monitor & Document]
    CONTAIN1 --> COMMUNICATE1[Executive Briefing]
    CONTAIN2 --> COMMUNICATE2[Management Notification]
    CONTAIN3 --> COMMUNICATE3[Team Notification]
    CONTAIN4 --> COMMUNICATE4[Ticket Update]
    COMMUNICATE1 --> REMEDIATE[Remediate]
    COMMUNICATE2 --> REMEDIATE
    COMMUNICATE3 --> REMEDIATE
    COMMUNICATE4 --> REMEDIATE
    REMEDIATE --> RECOVER[Recovery Operations]
    RECOVER --> REVIEW[Post-Incident Review]
    REVIEW --> IMPROVE[Implement Improvements]
    IMPROVE --> END((Close Incident))
    classDef critical fill:#FF4136,stroke:#333,stroke-width:1px,color:white;
    classDef high fill:#FF851B,stroke:#333,stroke-width:1px,color:white;
    classDef medium fill:#FFDC00,stroke:#333,stroke-width:1px,color:black;
    classDef low fill:#2ECC40,stroke:#333,stroke-width:1px,color:white;
    classDef default fill:#FF8000,stroke:#333,stroke-width:1px,color:white;
    class CRITICAL,CONTAIN1,COMMUNICATE1 critical;
    class HIGH,CONTAIN2,COMMUNICATE2 high;
    class MEDIUM,CONTAIN3,COMMUNICATE3 medium;
    class LOW,CONTAIN4,COMMUNICATE4 low;
Figure 7: Visual incident response playbook with severity-based workflows
Developing visual incident response playbooks has been one of the most impactful improvements I've implemented for security teams. These visual guides provide clear direction during high-stress incidents, when detailed text procedures might be difficult to follow.
Decision Trees for Incident Classification
Creating decision trees for security incident classification helps teams quickly determine the appropriate response level and escalation path. These visual tools are particularly valuable for junior analysts who may not have extensive experience with different incident types.
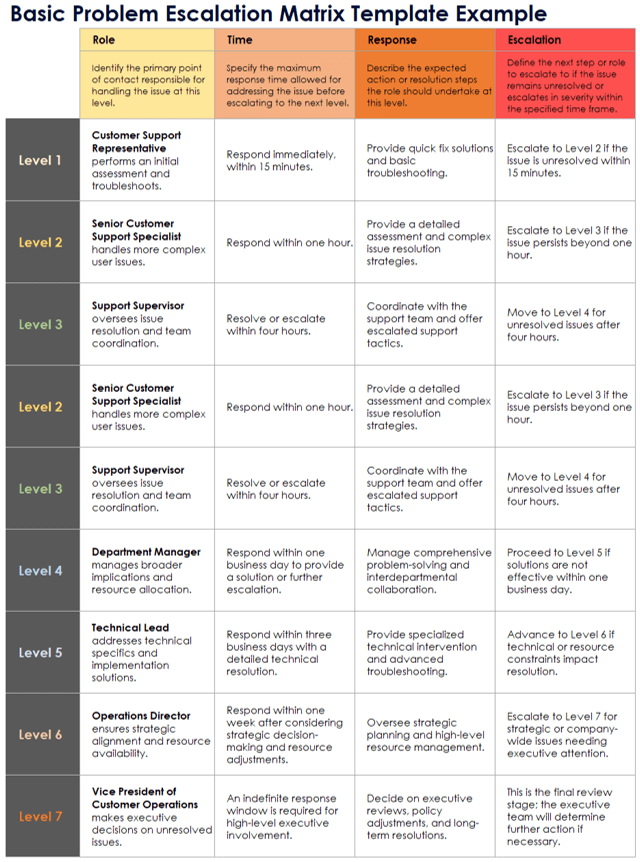
Figure 8: Decision tree for security incident classification and escalation
After-Action Review Templates
Implementing after-action review templates with PageOn.ai's collaborative features has helped my clients continuously improve their response capabilities. These templates capture lessons learned and track the implementation of improvements over time.
I've seen firsthand how visualizing response procedures transforms incident handling. Teams that practice with visual playbooks respond more confidently and effectively during actual incidents, significantly reducing mean time to resolution (MTTR) and limiting breach impact.
Integration Points: Creating a Cohesive Security Ecosystem
The true power of the PDR framework emerges when we integrate the three pillars into a cohesive security ecosystem. In my experience, visualizing these integration points helps teams understand how their actions in one area impact the entire security posture.
Data Flows Between PDR Components
flowchart TD
    subgraph Protection
        FW[Firewalls]
        EDR[Endpoint Protection]
        IAM[Identity Management]
    end
    subgraph Detection
        SIEM[SIEM Platform]
        TI[Threat Intelligence]
        UBA[User Behavior Analytics]
    end
    subgraph Response
        SOAR[Security Orchestration]
        IRP[Incident Response Platform]
        CM[Case Management]
    end
    FW -->|"Logs"| SIEM
    EDR -->|"Events"| SIEM
    IAM -->|"Access Data"| UBA
    TI -->|"IOCs"| SIEM
    SIEM -->|"Alerts"| SOAR
    UBA -->|"Anomalies"| SOAR
    SOAR -->|"Playbooks"| IRP
    IRP -->|"Cases"| CM
    CM -->|"Lessons Learned"| FW
    CM -.->|"Control Updates"| EDR
    CM -.->|"Policy Updates"| IAM
    classDef protection fill:#FF8000,stroke:#333,stroke-width:1px,color:white;
    classDef detection fill:#0074D9,stroke:#333,stroke-width:1px,color:white;
    classDef response fill:#2ECC40,stroke:#333,stroke-width:1px,color:white;
    class FW,EDR,IAM protection;
    class SIEM,TI,UBA detection;
    class SOAR,IRP,CM response;
Figure 9: Data flows between protection, detection, and response systems
Visualizing data flows between protection, detection, and response systems helps identify integration opportunities and potential gaps. I've used MCP architecture blueprint techniques to create comprehensive views of security ecosystems.
Automated Security Workflows
Mapping automated security workflows across the PDR framework helps identify opportunities for increased efficiency and consistency. When properly visualized, these workflows highlight how automation can enhance security operations.
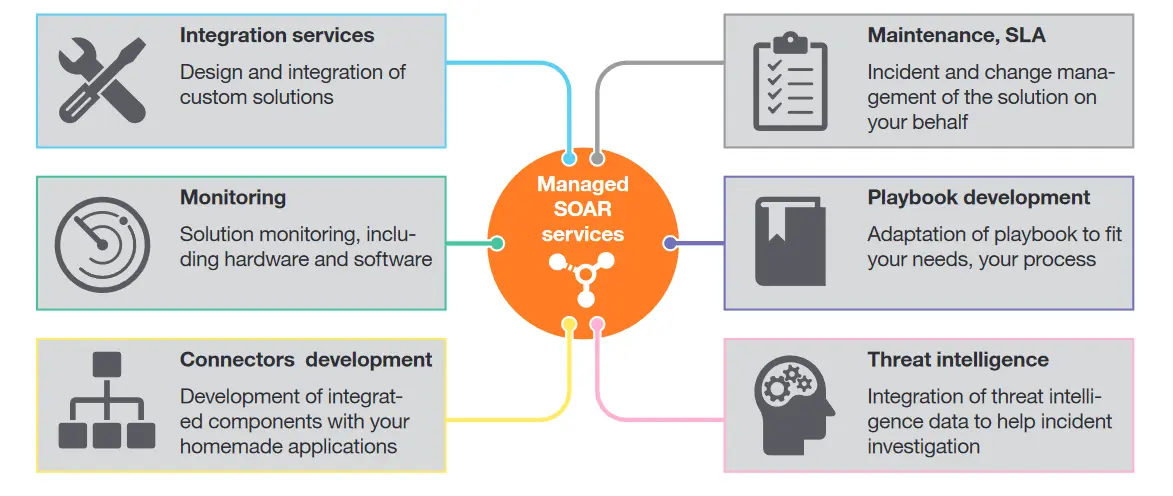
Figure 10: Automated security workflow visualization with SOAR integration
Holistic Security Posture Dashboards
Creating dashboards that provide holistic security posture awareness helps executives and security leaders understand the organization's overall security health. These visual tools bring together metrics from across the PDR framework.
Building visual documentation of security dependencies using PageOn.ai's AI Blocks helps teams understand how different security components interact and depend on each other. This visualization is particularly valuable when planning changes to the security architecture.
Integration is often the most challenging aspect of implementing a PDR framework. I've found that visualization is the key to helping teams understand these complex relationships and dependencies. When security teams can see how their systems interact, they make better decisions about architecture and operations.
PDR Metrics and Measurement
What gets measured gets improved. I've found that developing clear metrics for each pillar of the PDR framework helps organizations track progress and demonstrate the value of security investments.
Visual KPIs for Each PDR Pillar
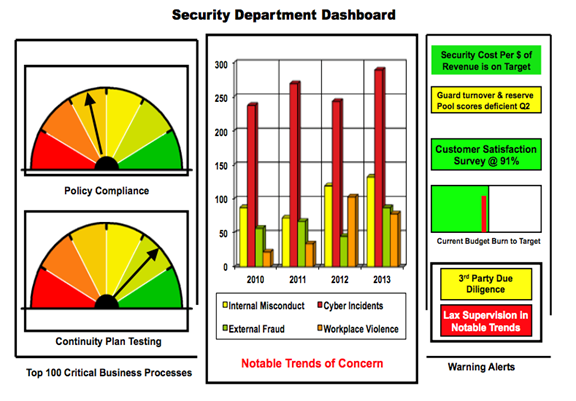
Figure 11: Executive-friendly security posture dashboard with PDR KPIs
Creating executive-friendly security posture dashboards helps communicate the value of security investments to business leaders. These visual tools translate technical security metrics into business impact measures that executives can understand.
Security Program Maturity Visualization
Visualizing security program maturity across the PDR spectrum helps organizations understand their current capabilities and plan for improvement. I've used MCP implementation roadmap techniques to create clear paths for security program evolution.
Compliance Mapping Visualization
Mapping compliance requirements to PDR framework components helps organizations understand how their security program supports regulatory obligations. These visualizations make it easier to identify gaps and prioritize compliance efforts.
flowchart TD
    subgraph "Compliance Standards"
        PCI["PCI DSS"]
        HIPAA["HIPAA"]
        GDPR["GDPR"]
        ISO["ISO 27001"]
    end
    subgraph "PDR Framework"
        P["Protection"]
        D["Detection"]
        R["Response"]
    end
    PCI -->|"Req 1-4, 6, 8-9"| P
    PCI -->|"Req 5, 10-11"| D
    PCI -->|"Req 12"| R
    HIPAA -->|"Security Rule: Access Controls"| P
    HIPAA -->|"Security Rule: Audit Controls"| D
    HIPAA -->|"Security Rule: Contingency Plan"| R
    GDPR -->|"Art. 25, 32: Protection by Design"| P
    GDPR -->|"Art. 33-34: Breach Notification"| D
    GDPR -->|"Art. 35-36: Impact Assessment"| R
    ISO -->|"A.8-A.14"| P
    ISO -->|"A.12.4, A.16.1"| D
    ISO -->|"A.16, A.17"| R
    classDef compliance fill:#B10DC9,stroke:#333,stroke-width:1px,color:white;
    classDef framework fill:#FF8000,stroke:#333,stroke-width:1px,color:white;
    class PCI,HIPAA,GDPR,ISO compliance;
    class P,D,R framework;
Figure 12: Compliance requirements mapped to PDR framework components
Generating automated reports that track security improvements over time helps demonstrate the value of security investments. These reports can be customized for different audiences, from technical teams to executive leadership.
Metrics are essential for demonstrating security program value. I've found that visualizing these metrics makes them more accessible to non-technical stakeholders and helps secure ongoing support for security initiatives. The key is selecting metrics that align with business objectives and tell a compelling story about security's contribution to the organization.
Implementation Roadmap for PDR Framework
Implementing a PDR framework is a journey, not a destination. I've developed a structured approach to help organizations adopt this framework in phases, focusing on high-value improvements that build momentum for the security program.
Phased Implementation Plan
gantt
    title PDR Framework Implementation Roadmap
    dateFormat  YYYY-MM
    axisFormat %b %Y
    section Foundation
    Security Assessment           :a1, 2023-01, 2m
    Define Security Strategy      :a2, after a1, 2m
    Establish Governance          :a3, after a2, 3m
    section Protection
    Critical Asset Protection     :b1, after a3, 3m
    Identity & Access Controls    :b2, after b1, 3m
    Data Protection Implementation :b3, after b2, 4m
    section Detection
    SIEM Implementation           :c1, after a3, 4m
    Detection Use Case Development :c2, after c1, 3m
    Threat Hunting Program        :c3, after c2, 3m
    section Response
    Incident Response Procedures  :d1, after a3, 3m
    Playbook Development          :d2, after d1, 3m
    Tabletop Exercises            :d3, after d2, ongoing
    section Integration
    Tool Integration              :e1, 2023-10, 4m
    Automation Implementation     :e2, after e1, 4m
    Continuous Improvement        :e3, after e2, ongoing
Figure 13: Phased implementation plan with visual milestones
Creating phased implementation plans with clear visual milestones helps organizations understand the journey ahead and track progress along the way. These roadmaps can be adjusted as the security landscape evolves and new priorities emerge.
Resource Allocation Visualization
Designing resource allocation visualizations for security initiatives helps organizations understand the investment required for successful implementation. These visualizations can be used to secure budget and staffing for security programs.
Stakeholder Communication Materials
Developing stakeholder communication materials with intuitive visuals helps secure buy-in for security initiatives. Different stakeholders have different priorities, and visual communication can be tailored to address their specific concerns.

Figure 14: Stakeholder communication materials with tailored security messaging
Building training materials that explain PDR concepts to different audiences helps create a security-aware culture. These materials can be customized for technical teams, business users, and executives.
Implementation is where theory meets practice. I've found that organizations that take a methodical, phased approach to PDR implementation are more successful than those that try to do everything at once. Visual roadmaps help maintain focus and momentum throughout the implementation journey.
Case Studies: PDR Framework in Action
Real-world examples demonstrate the practical value of the PDR framework across different industries. I've collected case studies that highlight successful implementations and the specific benefits realized by organizations.
Financial Services Sector Implementation
A global financial services organization implemented the PDR framework to address increasing regulatory requirements and evolving cyber threats. The implementation focused on:
- Integrating fraud detection with cybersecurity monitoring
- Creating automated response workflows for common financial threats
- Developing comprehensive protection for customer financial data
- Establishing clear metrics aligned with regulatory requirements
The result was a 65% reduction in incident response time and improved regulatory compliance scores across multiple jurisdictions.
Healthcare Organization's Approach to PDR Compliance
Figure 15: Healthcare organization's PDR compliance mapping visualization
A large healthcare provider implemented the PDR framework with a focus on patient data protection and regulatory compliance. By mapping HIPAA requirements to specific PDR components, they created a comprehensive security program that satisfied both compliance and security objectives.
Technology Company's DevSecOps Integration
flowchart LR
    subgraph "Development"
        CODE[Code Repository]
        SCAN[Security Scanning]
        BUILD[Build Pipeline]
    end
    subgraph "Protection"
        IAC[Infrastructure as Code]
        POLICY[Policy as Code]
        SECRETS[Secrets Management]
    end
    subgraph "Detection"
        MONITOR[Runtime Monitoring]
        VULN[Vulnerability Scanning]
        THREAT[Threat Detection]
    end
    subgraph "Response"
        AUTO[Automated Remediation]
        ALERT[Alert Management]
        ROLL[Rollback Capability]
    end
    CODE -->|"Commit"| SCAN
    SCAN -->|"Secure Code"| BUILD
    BUILD -->|"Deploy"| IAC
    IAC -->|"Secure Infrastructure"| MONITOR
    POLICY -->|"Enforce"| MONITOR
    SECRETS -->|"Protect"| MONITOR
    MONITOR -->|"Detect"| AUTO
    VULN -->|"Identify"| ALERT
    THREAT -->|"Recognize"| ALERT
    AUTO -->|"Fix"| CODE
    ALERT -->|"Notify"| CODE
    ROLL -->|"Revert"| BUILD
    classDef dev fill:#FF8000,stroke:#333,stroke-width:1px,color:white;
    classDef prot fill:#0074D9,stroke:#333,stroke-width:1px,color:white;
    classDef det fill:#2ECC40,stroke:#333,stroke-width:1px,color:white;
    classDef resp fill:#B10DC9,stroke:#333,stroke-width:1px,color:white;
    class CODE,SCAN,BUILD dev;
    class IAC,POLICY,SECRETS prot;
    class MONITOR,VULN,THREAT det;
    class AUTO,ALERT,ROLL resp;
Figure 16: Technology company's DevSecOps integration with PDR principles
A technology company integrated the PDR framework with their DevOps practices to create a comprehensive DevSecOps program. This integration ensured that security was built into every stage of the software development lifecycle, from code creation to production deployment.
Government Agency's Critical Infrastructure Protection
A government agency responsible for critical infrastructure implemented the PDR framework to protect essential services from cyber threats. The implementation included specialized protection for industrial control systems, advanced threat detection for nation-state actors, and coordinated response procedures with other government entities.
Retail Business Implementation
A retail business implemented the PDR framework with a focus on customer data protection and payment card security. The implementation included specialized protection for point-of-sale systems, detection capabilities for unusual purchasing patterns, and response procedures for potential data breaches.
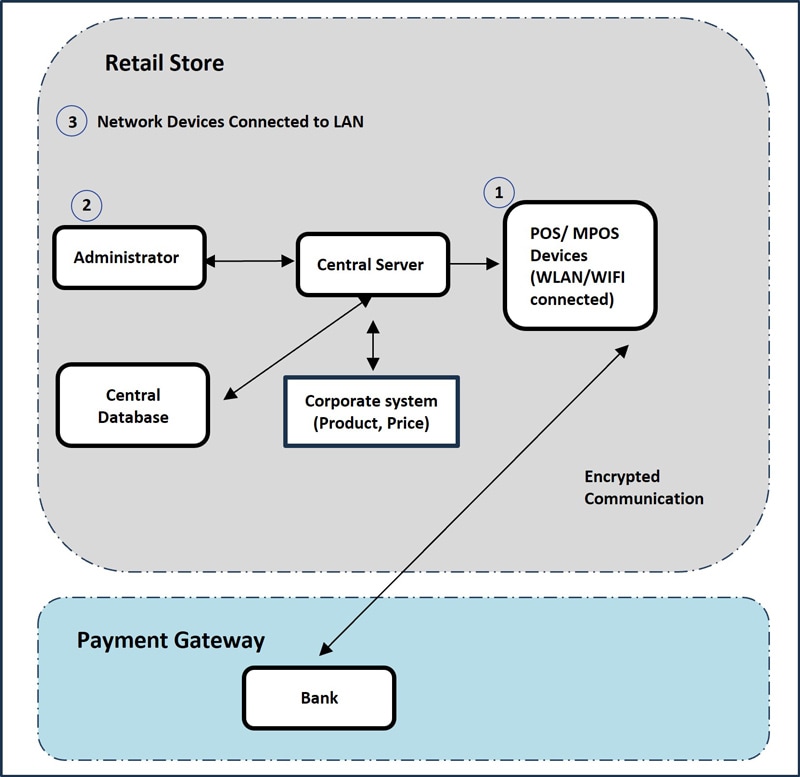
Figure 17: Retail business implementation focusing on customer data protection
Case studies demonstrate that the PDR framework can be adapted to any industry's specific needs. I've seen successful implementations across financial services, healthcare, technology, government, and retail sectors, each with unique adaptations that address industry-specific threats and compliance requirements.
Future-Proofing Your PDR Implementation
Security is a constantly evolving discipline. I've found that organizations need to anticipate future threats and adapt their PDR implementations accordingly to maintain effective security postures.
Emerging Threat Vectors
flowchart TD
    THREATS[Emerging Threats]
    THREATS --> AI[AI-Powered Attacks]
    THREATS --> SUPPLY[Supply Chain Compromises]
    THREATS --> CLOUD[Cloud Service Vulnerabilities]
    THREATS --> IOT[IoT Exploitation]
    THREATS --> RANSOM[Ransomware Evolution]
    AI --> AI1[Deepfake Social Engineering]
    AI --> AI2[Adversarial ML Attacks]
    SUPPLY --> SUP1[Software Dependencies]
    SUPPLY --> SUP2[Hardware Backdoors]
    CLOUD --> CLD1[Multi-Cloud Complexity]
    CLOUD --> CLD2[Serverless Security Gaps]
    IOT --> IOT1[Industrial IoT Risks]
    IOT --> IOT2[Consumer Device Exploitation]
    RANSOM --> RAN1[Double Extortion Tactics]
    RANSOM --> RAN2[Critical Infrastructure Targeting]
    subgraph "PDR Adaptations"
        P[Protection Evolution]
        D[Detection Enhancement]
        R[Response Advancement]
    end
    AI1 & AI2 --> P & D
    SUP1 & SUP2 --> P & D & R
    CLD1 & CLD2 --> P & D
    IOT1 & IOT2 --> P & D
    RAN1 & RAN2 --> R
    classDef threat fill:#FF4136,stroke:#333,stroke-width:1px,color:white;
    classDef vector fill:#FF851B,stroke:#333,stroke-width:1px,color:white;
    classDef specific fill:#FFDC00,stroke:#333,stroke-width:1px,color:black;
    classDef pdr fill:#FF8000,stroke:#333,stroke-width:1px,color:white;
    class THREATS threat;
    class AI,SUPPLY,CLOUD,IOT,RANSOM vector;
    class AI1,AI2,SUP1,SUP2,CLD1,CLD2,IOT1,IOT2,RAN1,RAN2 specific;
    class P,D,R pdr;
Figure 18: Emerging threat vectors and their impact on PDR components
Visualizing emerging threat vectors and their impact on PDR components helps organizations prepare for future security challenges. By anticipating new threats, security teams can adapt their protection, detection, and response capabilities before attacks materialize.
Adaptable Security Architecture
Creating adaptable security architecture diagrams that evolve with threats helps organizations maintain effective security postures over time. I use visual framework for ai safety principles to design security architectures that can adapt to changing threat landscapes.
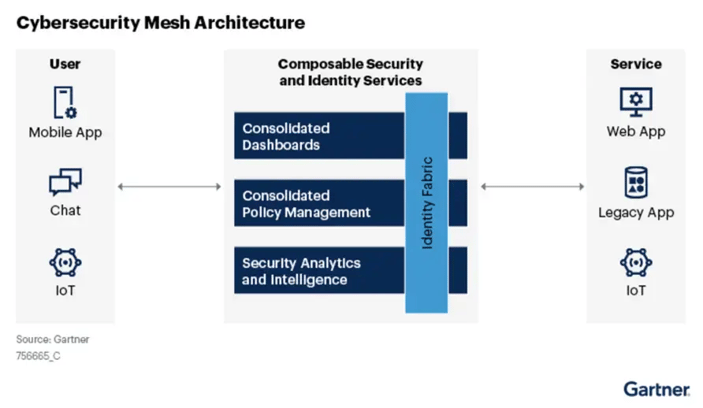
Figure 19: Adaptable security architecture with modular components
Security Automation and Orchestration
Building visual frameworks for security automation and orchestration helps organizations scale their security operations efficiently. These frameworks identify opportunities for automation across the PDR lifecycle, from automated protection controls to orchestrated incident response.
AI and ML Integration
Designing AI and ML integration points across the PDR framework helps organizations leverage advanced technologies to enhance their security capabilities. From anomaly detection to automated response, AI and ML can significantly improve security operations.

Figure 20: AI and ML integration points across the PDR framework
Future-proofing is about building adaptability into your security program. I've found that organizations that regularly revisit and update their PDR implementations are better prepared to address emerging threats. The key is creating visual frameworks that can evolve as the threat landscape changes.
Transform Your Security Visualizations with PageOn.ai
Ready to bring clarity to your security framework? PageOn.ai helps you create stunning visual expressions that make complex security concepts accessible to all stakeholders—from technical teams to executive leadership.
Start Creating with PageOn.ai TodayYou Might Also Like
Unleashing the Power of Agentic Workflows: Visual Clarity for Complex AI Processes
Discover how to transform complex agentic workflows into clear visual representations. Learn to design, implement and optimize AI agent processes with PageOn's visualization tools.
How 85% of Marketers Transform Content Strategy with AI Visual Tools | PageOn.ai
Discover how 85% of marketers are revolutionizing content strategy with AI tools, saving 3 hours per piece while improving quality and output by 82%.
Mapping the Great Depression: Visualizing Economic Devastation and Recovery
Explore how data visualization transforms our understanding of the Great Depression, from unemployment heat maps to New Deal program impacts, bringing America's greatest economic crisis to life.
The Visual Evolution of American Infrastructure: Canals to Digital Networks | PageOn.ai
Explore America's infrastructure evolution from historic canal networks to railroads, interstate highways, and digital networks with interactive visualizations and timelines.