Piktochart vs Canva: The Ultimate Comparison Guide for Content Creators
Navigate the visual design landscape to choose the perfect tool for your creative needs in 2024
As visual content continues to dominate digital spaces, choosing the right design platform has never been more crucial. I've spent years working with both Piktochart and Canva, and in this comprehensive guide, I'll help you understand which tool best aligns with your creative workflow, budget constraints, and specific content needs.
Introduction to Visual Design Platforms
In 2024, visual content has become the cornerstone of effective digital communication. As a content creator myself, I've witnessed firsthand how the right visual design platform can dramatically elevate messaging and audience engagement. The demand for eye-catching graphics, infographics, presentations, and social media content has never been higher.
Piktochart and Canva have emerged as two leading solutions in the visual design space, each with distinct approaches to empowering creators. Canva has positioned itself as an all-in-one design platform with an intuitive drag-and-drop interface, while Piktochart initially built its reputation around powerful infographic creation before expanding its offerings.
Modern content creators face increasingly diverse demands—from creating short-form video content for TikTok to designing comprehensive data visualizations for business reports. The ideal design platform needs to be versatile, efficient, and capable of producing professional results without requiring advanced design skills.
Perhaps most significantly, AI-powered design is revolutionizing the visual content landscape. Tools that leverage artificial intelligence to streamline creation processes, suggest design elements, and even generate content are gaining traction. This shift is changing expectations around what's possible for non-designers and how quickly quality visual assets can be produced.
The Evolution of Visual Design Tools
The visual design landscape has evolved significantly over the past decade:
                    timeline
                        title Visual Design Platform Evolution
                        2012 : Traditional desktop design software dominates
                        2013 : Canva launches with drag-and-drop interface
                        2014 : Piktochart gains popularity for infographics
                        2016 : Social media templates become standard
                        2018 : Collaboration features expand
                        2020 : Video capabilities integrated
                        2022 : AI design assistance emerges
                        2024 : Conversational AI design tools like PageOn.ai
Core Capabilities Comparison
When evaluating Piktochart and Canva, I find it essential to start with their fundamental capabilities that form the backbone of any design workflow. These core features determine how quickly you can get started and how efficiently you can produce content on an ongoing basis.
Ease of Use and Learning Curve
Both platforms prioritize user-friendly interfaces, but there are notable differences in approach. Canva excels with its highly intuitive drag-and-drop editor that feels immediately accessible even to complete beginners. Piktochart offers a similarly straightforward experience but requires slightly more time to master its specialized visualization features.
Template Variety and Customization
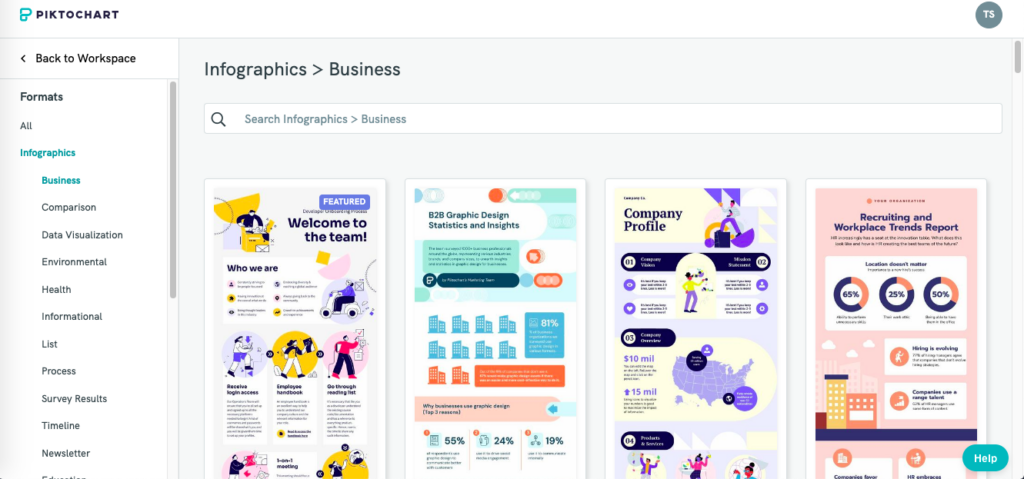
Canva boasts an extensive library with thousands of templates spanning virtually every content format imaginable—from Instagram stories to business proposals. The sheer volume and variety give content creators immediate starting points for almost any project. In contrast, Piktochart offers fewer templates overall but provides more specialized options for data visualization and infographics, often with more structured layouts designed to communicate complex information.
When examining template quality, I've found that Canva consistently delivers contemporary, on-trend designs that feel current with modern aesthetic preferences. Piktochart's templates, while professional, sometimes feel slightly more conservative in their design approach, which may appeal more to corporate and educational users.
Template Library Comparison
Comparing the template offerings across different content categories:
Design Flexibility and Creative Control
Canva strikes an excellent balance between simplicity and flexibility, offering enough design controls to customize projects without overwhelming users with too many options. Piktochart provides deeper customization for specific elements like charts and data visualizations but can sometimes feel more constrained in other design aspects.
When working on visual presentations with ChatGPT and Canva, I've appreciated how easily the platform adapts to AI-generated content, allowing for seamless integration of text and visual elements.
Collaboration Features
For team projects, both platforms offer collaborative editing capabilities, but Canva's implementation feels more robust and intuitive. Canva provides real-time collaboration similar to Google Docs, with visible cursor positions and changes appearing instantly. Piktochart offers team workspaces and sharing options but with a slightly less seamless real-time experience.
Mobile Functionality
Canva's mobile app delivers a remarkably complete experience, allowing for sophisticated design work even on smaller screens. Piktochart's mobile capabilities are more limited, positioning it primarily as a desktop-first tool with mobile viewing rather than comprehensive editing capabilities.
Specialized Features Analysis
Beyond core capabilities, both platforms offer specialized features that cater to specific content creation needs. These specialized tools often become the deciding factor for creators with particular requirements.
Infographic Creation
Piktochart truly shines in the infographic domain, offering robust data visualization tools that make translating complex information into visual stories relatively straightforward. The platform provides numerous chart types, customizable data widgets, and specialized infographic sections that can be easily connected to create cohesive visual narratives.

Canva has significantly improved its infographic capabilities in recent years but still approaches data visualization with a design-first rather than data-first mindset. While you can create visually appealing infographics in Canva, the process of importing and manipulating data feels less intuitive than in Piktochart, often requiring more manual work to achieve similar results.
Infographic Creation Workflow Comparison
The typical workflow differences when creating data-driven infographics:
                    flowchart TD
                        subgraph Canva
                        C1[Choose Template] --> C2[Add Design Elements]
                        C2 --> C3[Manually Create Charts]
                        C3 --> C4[Customize Visuals]
                        C4 --> C5[Add Data Labels]
                        end
                        subgraph Piktochart
                        P1[Choose Template] --> P2[Import Data]
                        P2 --> P3[Auto-Generate Charts]
                        P3 --> P4[Connect Visual Sections]
                        P4 --> P5[Fine-tune Design]
                        end
Social Media Content Creation
For social media content creators, Canva offers a comprehensive ecosystem with platform-specific templates precisely sized for every major network and post type. The platform excels with its extensive library of animated elements and the ability to create simple animations directly within the editor.
I've found that creating interactive slides on Canva has significantly improved engagement for my social content, allowing for more dynamic storytelling approaches.
Piktochart provides social media templates but with less variety and fewer platform-specific optimizations. Its strength remains in creating information-rich graphics rather than the quick, attention-grabbing content often needed for social channels.
Social Media Feature Comparison
Comparing key social media creation capabilities:
Video Capabilities
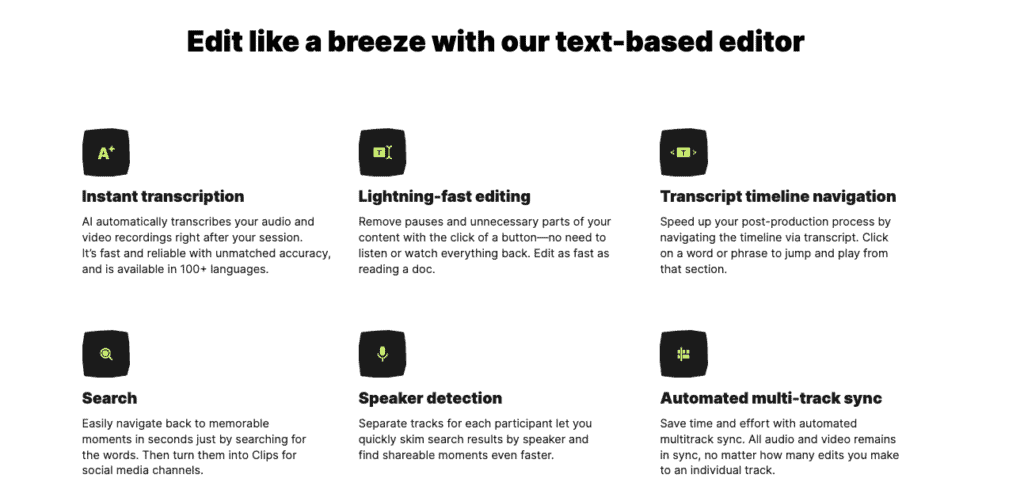
Piktochart has expanded into video with its Piktostory feature, which focuses on creating captioned video content from longer recordings—ideal for repurposing webinars or interviews into social media clips. The tool specializes in adding captions, basic editing, and creating highlight reels rather than comprehensive video production.
Canva's video creation tools take a broader approach, offering timeline-based editing, transitions, animations, and a growing library of video templates. The Canva AI Image Generator has also enhanced video production capabilities by allowing creators to quickly produce custom imagery that can be animated within video projects.
For content creators focused on video, Canva currently provides a more comprehensive solution, though neither platform rivals dedicated video editing software. The integration of the Canva AI Presentation Maker has further streamlined the process of turning static designs into animated video content.
Pricing Structure and Value Analysis
Understanding the pricing models of both platforms is crucial for content creators working within budget constraints. Both Piktochart and Canva operate on freemium models but with significant differences in their free and paid offerings.
Free Plan Comparison
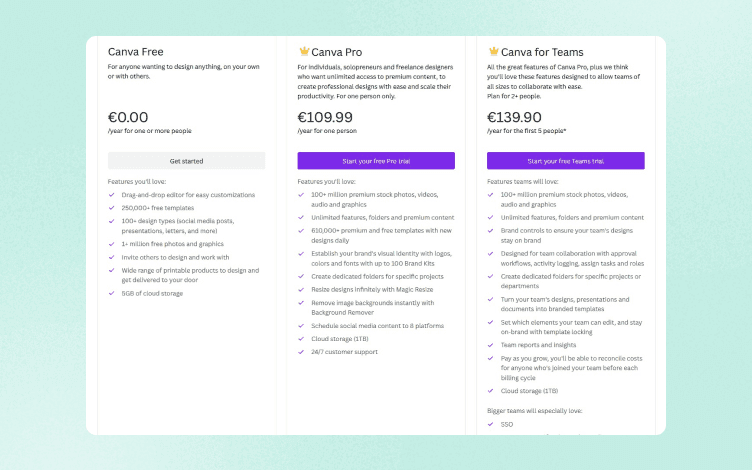
Canva's free plan is remarkably generous, offering access to thousands of templates, numerous design elements, and core functionality that enables creating professional-looking content without payment. The primary limitations revolve around premium templates, certain stock photos, and brand kit features.
Piktochart's free plan is more restrictive, limiting users to five active projects, applying watermarks to exported content, and restricting download options. The free tier is essentially a trial rather than a sustainable long-term option for regular content creation.
Pricing Tier Comparison
Monthly subscription costs across different tiers:
Paid Tier Value
Canva Pro (approximately $12.99/month) unlocks the platform's full potential with unlimited access to over 100 million stock photos, videos, and graphics, along with premium templates, background removal tools, and brand kit functionality. The value proposition is compelling for regular content creators who need diverse assets.
Piktochart Pro (approximately $14/month) focuses its premium value on removing export restrictions, eliminating watermarks, and providing access to premium templates and icons. For data visualization specialists, the advanced chart options and data linking features may justify the slightly higher price point.
Team and Enterprise Options
Both platforms offer team plans that add collaboration features, shared asset libraries, and admin controls. Canva's team plan (around $30/month for the first 5 users) provides excellent value for small creative teams, while Piktochart's team plan (approximately $29/month per user) targets organizations needing specialized data visualization capabilities.
Hidden Costs
It's worth noting that both platforms may incur additional costs beyond subscription fees. Canva charges for certain premium elements on a per-use basis, even for Pro subscribers. Piktochart may require upgrades for specific advanced features or higher export quality options. These costs can accumulate for creators producing high volumes of content.
Integration Ecosystem
A design platform's ability to connect with other tools in your workflow can significantly impact productivity. The integration ecosystem determines how seamlessly these tools fit into your broader content creation process.
Third-Party App Connections
Canva has invested heavily in its integration ecosystem, offering connections to numerous third-party applications including Dropbox, Google Drive, Instagram, YouTube, Mailchimp, and many others. These integrations allow for streamlined workflows where content can move directly between platforms without cumbersome export-import processes.
Piktochart offers fewer integrations overall, focusing primarily on data sources like Google Sheets, CSV imports, and basic publishing options. This narrower approach may be sufficient for data-focused workflows but can create friction for creators who work across multiple platforms and tools.
Integration Ecosystem Comparison
Key integration categories and platform support:
                    flowchart TD
                        subgraph Canva
                        C1[Cloud Storage] --> C1a[Google Drive]
                        C1[Cloud Storage] --> C1b[Dropbox]
                        C1[Cloud Storage] --> C1c[Box]
                        C2[Social Media] --> C2a[Instagram]
                        C2[Social Media] --> C2b[Facebook]
                        C2[Social Media] --> C2c[Pinterest]
                        C2[Social Media] --> C2d[Twitter]
                        C2[Social Media] --> C2e[LinkedIn]
                        C3[Video] --> C3a[YouTube]
                        C3[Video] --> C3b[TikTok]
                        C4[Marketing] --> C4a[Mailchimp]
                        C4[Marketing] --> C4b[HubSpot]
                        C5[Stock Assets] --> C5a[Unsplash]
                        C5[Stock Assets] --> C5b[Pixabay]
                        C5[Stock Assets] --> C5c[Pexels]
                        end
                        subgraph Piktochart
                        P1[Cloud Storage] --> P1a[Google Drive]
                        P2[Social Media] --> P2a[Facebook]
                        P2[Social Media] --> P2b[Twitter]
                        P3[Data Sources] --> P3a[Google Sheets]
                        P3[Data Sources] --> P3b[CSV Import]
                        P3[Data Sources] --> P3c[Excel]
                        P4[Publishing] --> P4a[WordPress]
                        P5[Stock Assets] --> P5a[Unsplash]
                        end
Stock Photo and Asset Libraries
Canva's integrated stock library is vast, with millions of photos, illustrations, videos, audio tracks, and graphics available directly within the editor. The Pro subscription includes access to most of these assets without additional fees, creating a seamless design experience.
Piktochart offers a more limited selection of stock photos and icons, though its library is well-curated for business and informational graphics. For extensive projects, users may need to source additional assets externally and import them.
Data Import/Export Capabilities
Piktochart excels in data handling with direct connections to spreadsheets and CSV files, allowing charts to update automatically when source data changes. This feature is particularly valuable for recurring reports or dashboards that need regular updating.
Canva's data import capabilities are more basic, typically requiring manual input or updates to charts and data visualizations. While functional for simple needs, this can become cumbersome for data-heavy projects.
CMS and Social Media Integrations
Canva offers direct publishing to various social media platforms, WordPress sites, and content management systems. This streamlined publishing workflow saves time and reduces the need for downloading and re-uploading content across platforms.
Piktochart provides more limited publishing options, primarily focusing on generating shareable links or embedding options rather than direct platform integration.

Content Creator Use Cases and Workflows
Different types of content creators have distinct needs and workflows. Understanding how each platform performs in specific scenarios can help determine which tool aligns best with your particular requirements.
Solo Content Creators vs. Team Environments
For solo creators, Canva's intuitive interface and comprehensive template library provide an efficient way to produce diverse content types without specialized skills. The platform's all-in-one nature means less switching between tools and a faster learning curve.
In team environments, Canva's robust collaboration features shine, with real-time editing, commenting, and approval workflows that streamline the creative process. The brand kit feature ensures visual consistency across team members, which is particularly valuable for marketing teams.
Piktochart works well for solo creators focused on data storytelling but may feel limiting for those needing to produce varied content types. Its team features are functional but less seamlessly implemented than Canva's collaborative environment.
Time Efficiency by Content Type
Average time required to create different content types (in minutes):
Industry-Specific Advantages
For marketing professionals, Canva's extensive social media templates, scheduling capabilities, and brand consistency tools create a powerful ecosystem for campaign creation and management. The platform's video capabilities also support the growing demand for multimedia marketing content.
Educational users often benefit from Piktochart's structured approach to information design, particularly when creating learning materials that explain complex concepts. The platform's strength in data visualization makes it valuable for academic presentations and research posters.
Non-profit organizations with limited design resources may find Canva's free tier particularly valuable, as it provides access to professional-looking templates without budget strain. Piktochart's data visualization tools can help these organizations effectively communicate impact metrics to stakeholders and donors.
Workflow Efficiency
Content creators working across multiple formats will likely find Canva's unified platform more efficient, as skills and assets transfer easily between different project types. The consistent interface reduces cognitive load when switching from creating social media graphics to presentations or print materials.
For specialized data visualization workflows, Piktochart's focused tools can actually increase efficiency despite its narrower scope. The direct connection to data sources and specialized chart options streamlines the process of transforming data into visual stories.
Real-World Time Savings
In my experience creating weekly social media content, Canva's templates and brand kit functionality reduced production time from approximately 5 hours to 2 hours per week—a 60% efficiency improvement compared to previous workflows combining multiple tools.
For quarterly data reports, Piktochart's ability to connect directly to updated spreadsheets saved approximately 3 hours per report cycle by eliminating manual chart recreation, representing a significant time saving for recurring data visualization needs.

Limitations and Workarounds
While both platforms offer powerful design capabilities, they each have limitations that may impact specific workflows. Understanding these constraints—and potential workarounds—can help manage expectations and develop effective strategies.
Common Frustrations with Both Platforms
Both Canva and Piktochart can struggle with precision design control compared to professional tools like Adobe Illustrator or InDesign. Fine-tuning exact positioning, advanced typography, or complex layering can be challenging within their simplified interfaces.
Another shared limitation is offline access—both platforms require internet connectivity to function fully, which can be problematic for creators who work in locations with unreliable internet access.
Common User Frustrations
Frequency of reported limitations by platform users:
Platform-Specific Constraints
Canva's limitations include:
- Limited advanced data visualization options beyond basic charts
- Restricted ability to create truly custom designs outside of template frameworks
- Performance issues with very complex or lengthy documents
- Limited vector editing capabilities compared to specialized tools
Piktochart's constraints include:
- Less intuitive interface for non-data content creation
- More limited template variety outside of infographics and presentations
- Fewer animation and interactive options
- More restrictive free tier with watermarking
Effective Workarounds
For Canva's data visualization limitations, I've found that creating charts in specialized tools like Google Sheets or Excel and importing them as images works well for more complex data needs. This approach combines Canva's design strengths with more powerful data tools.
When facing Piktochart's template limitations, starting with a blank canvas rather than a template often provides more flexibility. Building custom sections from scratch can overcome the constraints of pre-designed templates while still leveraging the platform's visualization tools.
Both platforms benefit from using the Canva AI Presentation Maker or similar AI tools to generate initial content that can then be refined within the platform's constraints.
Learning Resources and Community Support
Canva offers extensive official tutorials, a design school, and a large user community that shares tips and templates. The platform's popularity means solutions to common problems are readily available through forums and social media groups.
Piktochart provides good documentation but has a smaller user community. Their support team is responsive, but peer-to-peer learning resources are less abundant than for Canva.
When to Consider Alternative Tools
Despite their strengths, there are scenarios where neither Canva nor Piktochart may be the ideal solution:
- For highly complex data visualization requiring interactive elements, tools like Tableau or PowerBI may be more appropriate
- When precise design control is paramount, professional tools like Adobe Creative Suite remain the standard
- For specialized animation needs, dedicated animation software will offer more capabilities
- When working with very large documents or books, publishing-specific software provides better management features
Future-Proofing Your Visual Content Strategy
As visual content continues to evolve rapidly, choosing platforms that will grow with emerging trends and technologies becomes increasingly important. Understanding the development trajectories of these tools can help inform longer-term strategic decisions.
Recent Platform Updates
Canva has been aggressively expanding its feature set, with recent updates focused on video capabilities, website creation tools, and enhanced collaboration features. The platform's development pace is rapid, with new features and templates released frequently to address emerging content formats.
Piktochart has been evolving more gradually, with focused improvements to its core strengths in data visualization and the addition of specialized tools like Piktostory for video content. Their development approach appears more targeted toward refining existing capabilities rather than broad expansion.
AI Integration and Automation
Canva has made significant investments in AI capabilities, including Magic Write for text generation, Magic Design for automatic layouts, and image generation tools. These AI features are increasingly integrated throughout the platform, automating routine design tasks and making content creation more accessible to non-designers.
Piktochart has introduced some AI-assisted features, particularly around data visualization recommendations and template matching, but their AI integration appears less comprehensive than Canva's current offerings.
AI Feature Integration Comparison
Current AI capabilities in each platform:
                    flowchart TD
                        subgraph Canva
                        CA[AI Features] --> CA1[Magic Write]
                        CA --> CA2[Magic Design]
                        CA --> CA3[Image Generation]
                        CA --> CA4[Background Removal]
                        CA --> CA5[Content Repurposing]
                        CA --> CA6[Design Suggestions]
                        end
                        subgraph Piktochart
                        PA[AI Features] --> PA1[Chart Recommendations]
                        PA --> PA2[Template Matching]
                        PA --> PA3[Basic Text Suggestions]
                        PA --> PA4[Color Palette Generation]
                        end
                        subgraph PageOn.ai
                        PO[AI Features] --> PO1[Conversational Design]
                        PO --> PO2[AI Blocks]
                        PO --> PO3[Deep Search]
                        PO --> PO4[Automatic Visual Synthesis]
                        PO --> PO5[Context-Aware Recommendations]
                        end
Emerging Visual Content Trends
Several trends are shaping the future of visual content creation:
- Interactive content that engages viewers beyond passive consumption
- Personalized visuals that adapt to viewer preferences or behaviors
- Augmented reality integration for immersive experiences
- Data-driven design that automatically updates based on real-time information
- Accessibility-focused design ensuring content reaches all audience segments
Canva appears better positioned for trends related to interactivity and personalization, with features like Canva Presentations already supporting basic interactive elements. Piktochart may have advantages in data-driven design given its stronger data visualization foundation.
Platform Adaptability
Canva's broader approach and larger development resources suggest greater adaptability to emerging trends and content formats. The platform has consistently expanded to embrace new visual mediums as they gain popularity.
Piktochart's more specialized focus may limit its adaptability to certain trends but could position it well for deeper integration with data-centric workflows and business intelligence tools.
Beyond Traditional Design Tools
Looking beyond these established platforms, PageOn.ai represents a new approach to visual content creation that addresses fundamental limitations in both Canva and Piktochart. Instead of template-based design requiring manual assembly, PageOn.ai enables conversational visual creation—transforming ideas directly into visual expressions through natural language.
This AI-driven approach eliminates the technical barriers that still exist in drag-and-drop tools, allowing content creators to focus entirely on their message rather than design mechanics. For creators who value speed and conceptual thinking over manual design work, this represents a significant evolution in the visual content creation process.
Making the Final Decision
With a clear understanding of both platforms' strengths, limitations, and future directions, we can now establish a framework for choosing the right tool based on your specific content creation needs.
Decision Framework
Consider these key factors when making your decision:
| Choose Canva If You: | Choose Piktochart If You: |
|---|---|
| Need to create diverse content types (social media, presentations, print materials) | Focus primarily on data visualization and infographics |
| Value intuitive, user-friendly interfaces with minimal learning curve | Need specialized data-linking capabilities for reports |
| Work frequently with social media content | Create primarily educational or informational content |
| Need robust team collaboration features | Work extensively with data-driven storytelling |
| Require access to extensive stock media libraries | Need to repurpose video content with captions (via Piktostory) |
| Want more AI-assisted design capabilities | Prefer more structured templates for information organization |
Hybrid Approach Possibilities
Many professional content creators find value in using both platforms for their respective strengths, creating a hybrid workflow that leverages the best of each tool:
- Use Piktochart for data-heavy infographics and reports where its visualization tools excel
- Use Canva for social media content, presentations, and marketing materials where its template variety and ease of use provide efficiency
- Consider PageOn.ai for rapid concept development and initial visual ideation before finalizing in either platform
This approach may require additional investment but can significantly enhance output quality and workflow efficiency for creators with diverse content needs.
Migration Considerations
If you're currently using one platform and considering switching to the other, consider these migration factors:
- Asset portability: Can you easily export designs from your current platform in formats usable by the new one?
- Learning curve: Factor in time needed to become proficient with the new interface
- Template recreation: Consider whether key templates will need to be rebuilt from scratch
- Team training: If working in a team, account for training time and potential productivity dips during transition
Complementary Tools
Beyond choosing between Canva and Piktochart, consider how PageOn.ai can complement or potentially replace aspects of traditional design workflows. PageOn.ai's conversational approach to visual creation represents a fundamentally different paradigm—one where ideas can be expressed naturally and transformed into visuals without manual design work.
For content creators who spend significant time translating concepts into visual formats, this AI-driven approach can dramatically accelerate the ideation-to-visualization process. Rather than starting with templates and manually assembling elements, you can describe your vision and have PageOn.ai generate a cohesive visual expression.
Beyond Traditional Design Tools
While Canva and Piktochart have revolutionized visual content creation by making design more accessible, they still operate within the traditional paradigm of manual element placement and template customization. The next frontier in visual content creation moves beyond these constraints entirely.
The Next Frontier in Visual Content Creation
Traditional design tools—even user-friendly ones like Canva and Piktochart—still require creators to translate their ideas into manual design actions: selecting templates, dragging elements, adjusting colors, and arranging components. This translation process creates friction between concept and execution, often limiting how quickly ideas can be visualized.
The emerging paradigm eliminates this friction through conversational design—allowing creators to express ideas naturally and have AI systems handle the technical aspects of visual creation. This approach fundamentally changes the relationship between creator and tool, making the technology truly serve the creative process rather than imposing its constraints.
How PageOn.ai Transforms the Creative Process
PageOn.ai represents this new approach to visual content creation. Instead of starting with templates or blank canvases that require manual assembly, PageOn.ai begins with conversation—allowing creators to describe their vision, goals, and content needs in natural language.
This conversational interface removes the technical barriers that still exist in drag-and-drop tools. Even the most user-friendly traditional design platforms require learning their specific interfaces, understanding design principles, and manually executing each element of a visual. PageOn.ai shifts this burden from the creator to the AI, allowing focus to remain on the message rather than the mechanics.
Traditional vs. Conversational Design Process
Comparing workflow steps between approaches:
                    flowchart TD
                        subgraph "Traditional Design Process"
                        T1[Concept Development] --> T2[Template Selection]
                        T2 --> T3[Asset Collection]
                        T3 --> T4[Manual Layout]
                        T4 --> T5[Element Styling]
                        T5 --> T6[Refinement]
                        T6 --> T7[Export/Publish]
                        end
                        subgraph "PageOn.ai Conversational Process"
                        P1[Concept Description] --> P2[AI Visual Generation]
                        P2 --> P3[Feedback & Refinement]
                        P3 --> P4[Export/Publish]
                        end
                        T1 --> P1
                        P4 --> T7
Integrating AI Blocks for Complex Visual Narratives
One of PageOn.ai's most powerful features is AI Blocks—modular visual components that can be assembled into complex narratives without requiring design expertise. Unlike traditional design elements that must be manually positioned and styled, AI Blocks understand context and relationships between information, automatically organizing content in visually coherent ways.
This approach is particularly valuable for creating complex visual narratives like process flows, concept maps, or hierarchical relationships—tasks that often prove challenging in template-based tools like Canva and Piktochart. Rather than forcing information into predetermined layouts, AI Blocks adapt to the natural structure of the information itself.
Using Deep Search for Automatic Visual Integration
Another transformative capability is PageOn.ai's Deep Search functionality, which automatically finds and incorporates relevant visuals based on content needs. Unlike the manual process of searching stock libraries in traditional tools, Deep Search understands the conceptual requirements of your content and suggests appropriate visual elements.
This approach eliminates hours spent browsing image libraries and trying different visual options. Instead, the system leverages AI to match conceptual needs with appropriate visual representations, dramatically accelerating the creation process while maintaining visual coherence.
Streamlining the Journey from Concept to Output
Perhaps the most significant advantage of PageOn.ai's approach is how it streamlines the entire journey from initial concept to polished visual output. Traditional design tools, even user-friendly ones like Canva and Piktochart, still require multiple steps of manual intervention—each representing potential friction in the creative process.
By contrast, PageOn.ai's conversational approach allows creators to move from idea to visualization in a single flow, maintaining creative momentum and reducing the technical overhead that often interrupts the creative process. This streamlined journey is particularly valuable for content creators who need to rapidly produce visual assets across multiple projects or channels.
Time Efficiency Comparison
Average time saved using conversational design vs. traditional tools:
The future of visual content creation lies not in making traditional design tools marginally easier to use, but in fundamentally reimagining how we translate ideas into visual expressions. While Canva and Piktochart have made significant strides in democratizing design, PageOn.ai represents the next evolutionary step—where the focus shifts entirely to ideas and communication, with AI handling the technical aspects of visual creation.
For content creators seeking to maximize efficiency and focus on strategic thinking rather than technical execution, this conversational approach to visual creation offers compelling advantages over traditional design platforms.
Transform Your Visual Expressions with PageOn.ai
Move beyond the limitations of traditional design tools. Experience the power of conversational visual creation that transforms your ideas into stunning visuals without the manual design work.
Start Creating with PageOn.ai TodayConclusion: Choosing Your Visual Design Path
When deciding between Piktochart and Canva, there's no one-size-fits-all answer. Your ideal choice depends on your specific content needs, workflow preferences, and long-term visual strategy.
Canva excels as an all-purpose visual design platform with intuitive controls, extensive template variety, and strong collaboration features. It's particularly well-suited for content creators who need to produce diverse visual assets across multiple channels and formats.
Piktochart shines brightest for data visualization and infographic creation, offering specialized tools that make complex information more accessible and engaging. It's ideal for creators focused on educational content, business reporting, or data storytelling.
Looking beyond these traditional platforms, PageOn.ai represents a new paradigm in visual content creation—one where ideas can be expressed conversationally and transformed into visuals without the technical overhead of manual design work. For creators who value efficiency and conceptual thinking over manual design tasks, this AI-driven approach offers compelling advantages.
As visual content continues to evolve, the most successful creators will be those who select tools that align with their specific needs while embracing innovations that streamline the creative process. Whether you choose Canva, Piktochart, PageOn.ai, or a combination approach, the key is finding tools that empower your unique creative vision while minimizing technical friction.
The future of visual content creation belongs to those who can quickly translate ideas into compelling visual stories—and the right tools make all the difference in that journey.
You Might Also Like
Platform-Specific Infographic Formatting: Optimize for Social Media Success
Master platform-specific infographic formatting for Instagram, Pinterest, LinkedIn, Twitter & Facebook. Learn optimal dimensions, aspect ratios & design strategies for social media success.
Mapping the Architecture of Legal Reasoning: Visualizing Precedent, Analogy, and Case Law Application
Explore how precedent, analogy, and case law application form the foundation of judicial practice, with visual frameworks that transform abstract legal concepts into clear decision pathways.
Visualizing the CIA Triad: A Modern Framework for Cybersecurity Success
Discover how the CIA triad (Confidentiality, Integrity, Availability) forms the foundation of modern cybersecurity. Learn implementation strategies and visualization techniques for security success.
Transforming Legal Reasoning: Visual Approaches to Modern Jurisprudence | PageOn.ai
Discover how visual approaches are revolutionizing legal reasoning in modern jurisprudence. Learn practical tools, methodologies, and technological innovations for enhanced legal analysis.