Revolutionary AI-Powered Spreadsheet Platforms
The Future of Data Visualization and Analysis
I've been exploring how AI is transforming traditional spreadsheets into powerful analytical platforms. Join me as we dive into this revolution that's changing how we interact with data, visualize insights, and make decisions.
The Evolution of Spreadsheet Technology
I've witnessed the remarkable transformation of spreadsheets over the decades. What began as simple digital ledgers has evolved into sophisticated analytical platforms powered by artificial intelligence.

Traditional spreadsheets, while revolutionary in their time, created significant bottlenecks in data analysis workflows. Users faced steep learning curves with complex formulas, struggled with data visualization limitations, and spent countless hours on repetitive tasks that could be automated.
The Spreadsheet Evolution Journey
flowchart TD
    A[Paper Ledgers] -->|Digitization| B[Basic Digital Spreadsheets]
    B -->|Formula Support| C[Advanced Calculation Tools]
    C -->|Data Visualization| D[Charting Capabilities]
    D -->|Cloud Computing| E[Collaborative Spreadsheets]
    E -->|Natural Language| F[AI-Powered Platforms]
    F -->|Predictive Analytics| G[Intelligent Data Systems]
    style A fill:#f9f9f9,stroke:#ccc
    style B fill:#f9f9f9,stroke:#ccc
    style C fill:#f9f9f9,stroke:#ccc
    style D fill:#f9f9f9,stroke:#ccc
    style E fill:#f9f9f9,stroke:#ccc
    style F fill:#FF8000,stroke:#e67300,color:white
    style G fill:#FF8000,stroke:#e67300,color:white
The introduction of natural language processing has been the true game-changer. Now, instead of memorizing complex formula syntax, I can simply ask questions of my data in plain English. This democratizes data analysis, making powerful insights accessible to everyone regardless of technical background.
Key Pain Points Solved by AI Spreadsheet Platforms:
- Formula complexity and steep learning curves
- Time-consuming manual data visualization
- Difficulty identifying patterns in large datasets
- Limited collaboration capabilities
- Inefficient reporting workflows
Core Capabilities of Modern AI Spreadsheet Solutions
Today's AI-powered spreadsheet platforms offer capabilities that were unimaginable just a few years ago. I'm particularly impressed by how these tools have transformed the user experience through natural language processing and intelligent automation.
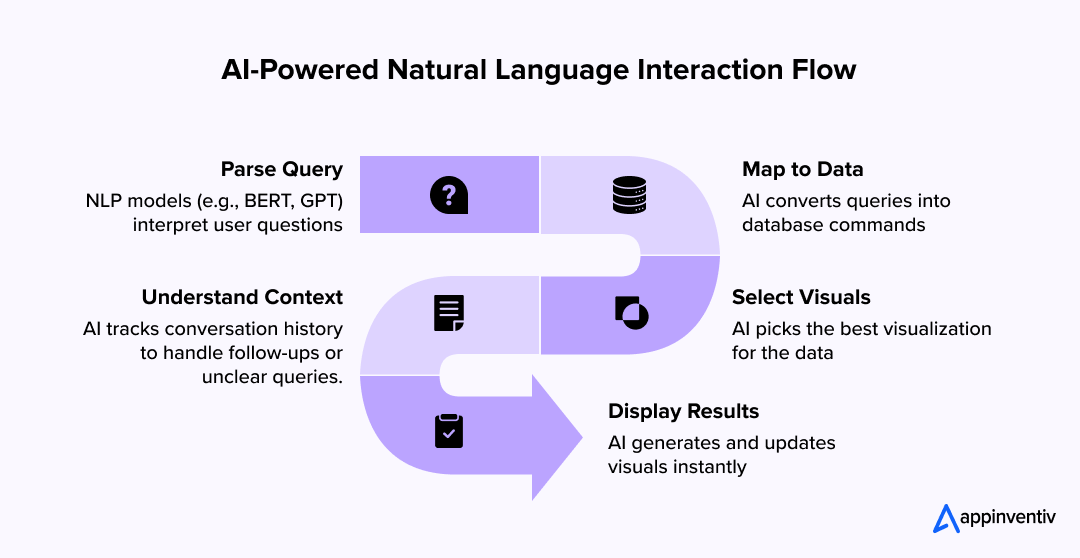
Natural Language Querying
Perhaps the most revolutionary change is the ability to interact with spreadsheets using natural language. Instead of remembering complex formula syntax, I can simply type "show me sales trends by region for Q2" and get immediate results. This transforms the spreadsheet from a technical tool into a conversational assistant.
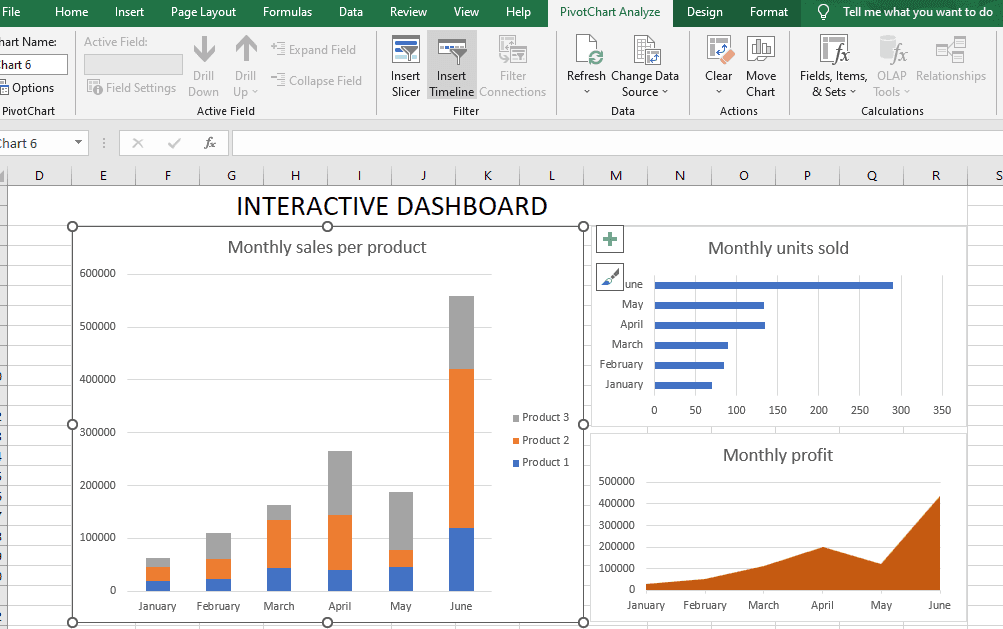
Automated Data Visualization
Modern platforms can analyze your data and automatically suggest the most effective visualization methods. AI tools for excel charts are revolutionizing how we present information, making it easier to communicate insights clearly without needing design expertise.
Intelligent Pattern Recognition
AI-powered spreadsheets can identify patterns, trends, and anomalies that might go unnoticed by human analysts. This capability is particularly valuable when working with large datasets where manual analysis would be impractical.
Real-time Collaborative Analysis
Modern platforms enhance collaboration by allowing multiple users to work simultaneously while AI helps reconcile changes and highlight important modifications. Machine learning algorithms can even suggest relevant insights based on each team member's role and previous interactions with the data.
Comparative Analysis: Traditional vs. AI-Powered Spreadsheets
| Feature | Traditional Spreadsheets | AI-Powered Platforms |
|---|---|---|
| Data Entry | Manual | Automated with validation |
| Formula Creation | Technical syntax required | Natural language queries |
| Data Visualization | Manual chart creation | Automated with AI suggestions |
| Pattern Detection | Human analysis required | Automated anomaly detection |
| Reporting | Manual compilation | Automated with templates |
Transforming Raw Data into Meaningful Insights
The true power of AI-powered spreadsheet platforms lies in their ability to transform raw data into meaningful insights without requiring extensive technical expertise. I've found that these tools dramatically reduce the time between data collection and actionable visualization.
Intelligent Chart Selection
One of the most impressive capabilities I've encountered is how AI determines the optimal chart types based on your data characteristics. The system analyzes your dataset structure, the relationships between variables, and your intended message to suggest the most effective visualization method.
flowchart TD
    A[Raw Data Input] --> B{AI Analysis}
    B -->|Time Series Data| C[Line Chart]
    B -->|Categorical Comparison| D[Bar Chart]
    B -->|Part-to-Whole| E[Pie Chart]
    B -->|Multi-Variable| F[Scatter Plot]
    B -->|Hierarchical| G[Tree Map]
    B -->|Network Data| H[Network Graph]
    C & D & E & F & G & H --> I[Optimized Visualization]
    I --> J[Interactive Dashboard]
    style B fill:#FF8000,stroke:#e67300,color:white
    style I fill:#FF8000,stroke:#e67300,color:white
    style J fill:#FF8000,stroke:#e67300,color:white
Automated Report Generation
Creating comprehensive reports from spreadsheet data has traditionally been a time-consuming process. Now, generate excel reports with ai tools that automatically identify key insights and create narrative explanations alongside your visualizations. This transforms raw numbers into compelling data stories that anyone can understand.
Modular Visual Components
When working with complex datasets, I've found PageOn.ai's AI Blocks to be incredibly useful. This feature allows you to structure complex datasets into modular, visual components that can be arranged and connected to create comprehensive data narratives. Each block represents a specific insight or visualization that can be customized and linked to others.
In my experience, different platforms approach data interpretation in unique ways. Some focus on speed and automation, while others prioritize customization and control. The most effective solutions strike a balance, offering automated insights with the flexibility to refine visualizations according to specific needs.
Practical Applications Across Industries
I've seen AI-powered spreadsheet platforms transform workflows across numerous industries. These tools are versatile enough to address specialized needs while maintaining an intuitive user experience that doesn't require technical expertise.
Financial Sector
In finance, ai stock charting tools have revolutionized investment analysis. These platforms can automatically identify patterns in market data, visualize complex financial metrics, and even suggest potential investment opportunities based on historical performance and current market conditions.
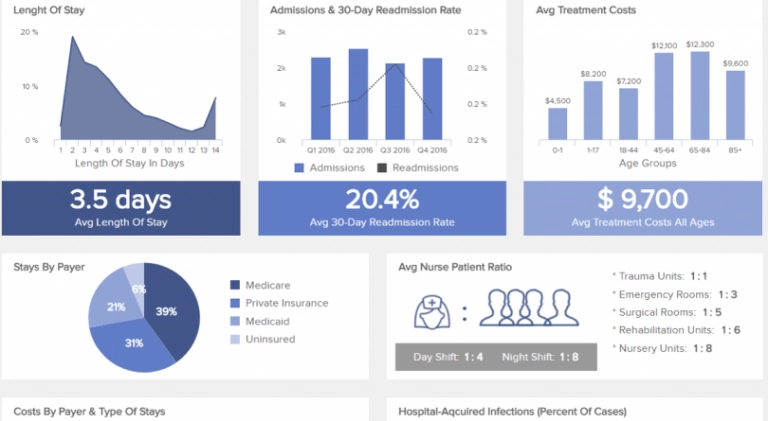
Healthcare
Healthcare organizations use AI-powered spreadsheets to visualize patient data trends and treatment outcomes. The ability to quickly transform complex medical datasets into clear visualizations helps clinicians identify patterns that might otherwise remain hidden in rows of numbers. This leads to improved patient care and more efficient resource allocation.
Manufacturing
Manufacturing companies leverage AI spreadsheet platforms to optimize production workflows through visual data analysis. These tools help identify bottlenecks, predict maintenance needs, and optimize resource allocation. The ability to create dynamic dashboards that update in real-time allows managers to make informed decisions quickly.
Marketing
Marketing teams create dynamic campaign performance dashboards with minimal effort using AI-powered spreadsheet tools. These platforms automatically integrate data from various channels, visualize performance metrics, and even suggest optimization strategies based on historical patterns and current trends.
PageOn.ai Integration Highlight:
I've found PageOn.ai's Deep Search particularly valuable for industry-specific visualizations. This feature can analyze your existing data and automatically suggest relevant visualization templates based on your industry and specific use case. It can even integrate external industry benchmarks to provide context for your internal metrics.
Workflow Integration and Productivity Enhancements
The true value of AI-powered spreadsheet platforms becomes apparent when they're seamlessly integrated into existing workflows. I've seen organizations dramatically reduce the time spent on data processing and visualization while improving the quality and impact of their insights.
Seamless Transitions
Modern AI platforms eliminate the traditional barriers between data analysis and presentation-ready visuals. I can analyze data in a spreadsheet-like interface and then instantly transform those insights into polished visualizations for reports or presentations without switching between multiple applications.
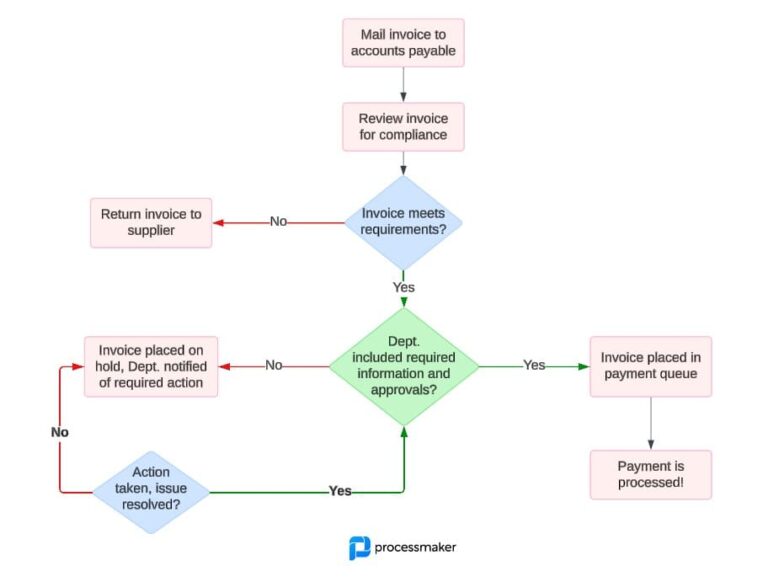
Process Documentation
One of the most time-consuming aspects of data analysis has traditionally been documenting the processes used. AI-powered flowchart tools now streamline this task by automatically generating visual documentation of data transformation steps, making it easier to maintain consistency and train new team members.
flowchart TD
    A[Raw Data Collection] -->|Import to Platform| B[Data Cleaning & Preparation]
    B -->|AI Processing| C[Automated Analysis]
    C -->|Pattern Recognition| D[Key Insights Identification]
    D -->|AI Visualization| E[Chart Generation]
    E -->|Template Application| F[Report Creation]
    F -->|Export Options| G[Distribution Ready]
    style B fill:#f9f9f9,stroke:#ccc
    style C fill:#FF8000,stroke:#e67300,color:white
    style D fill:#FF8000,stroke:#e67300,color:white
    style E fill:#FF8000,stroke:#e67300,color:white
    style F fill:#f9f9f9,stroke:#ccc
Executive-Ready Reports
Converting spreadsheet insights into executive-ready reports has traditionally required significant manual effort. AI-powered platforms now automate this process, identifying key insights and transforming them into narrative reports with appropriate visualizations. This ensures that decision-makers receive clear, actionable information without requiring analysts to spend hours on formatting and presentation.
Visual Storytelling
PageOn.ai's Vibe Creation feature has transformed how I communicate technical data narratives. This tool helps transform complex analytical findings into accessible visual stories that resonate with non-technical audiences. It suggests color schemes, layout options, and visualization types that best communicate your specific narrative.
Time-Saving Automation
Perhaps the most significant productivity enhancement comes from automating repetitive spreadsheet tasks. AI-powered platforms can handle data cleaning, formatting, and basic analysis automatically, freeing up analysts to focus on higher-level interpretation and strategy. In my experience, this can reduce the time required for routine data processing by up to 80%.
Advanced Visualization Techniques
The visualization capabilities of modern AI-powered spreadsheet platforms go far beyond basic charts and graphs. I've been particularly impressed by the interactive, dynamic visual experiences that these tools can create with minimal user input.
Dynamic Visual Experiences
Modern platforms enable the creation of interactive visualizations that allow users to explore data from multiple perspectives. Rather than static charts, these dynamic visualizations respond to user input, revealing new insights through filtering, drilling down, or changing visualization parameters on the fly.
AI-Driven Visualization Selection
One of the most impressive capabilities is how AI determines the most effective visualization for specific data patterns. The system analyzes your dataset structure, the relationships between variables, and your intended message to suggest visualization methods that will most effectively communicate your insights.
flowchart TD
    A[Data Input] --> B{AI Analysis Engine}
    B --> C{Data Pattern Recognition}
    C -->|Time Series| D[Line Chart]
    C -->|Categorical| E[Bar Chart]
    C -->|Distribution| F[Histogram]
    C -->|Correlation| G[Scatter Plot]
    C -->|Hierarchical| H[Tree Map]
    C -->|Geographic| I[Map Visualization]
    C -->|Network| J[Force Directed Graph]
    D & E & F & G & H & I & J --> K{Audience Analysis}
    K -->|Technical| L[Detailed Visualization]
    K -->|Executive| M[Summary Dashboard]
    K -->|Mixed| N[Interactive Layered View]
    style B fill:#FF8000,stroke:#e67300,color:white
    style C fill:#FF8000,stroke:#e67300,color:white
    style K fill:#FF8000,stroke:#e67300,color:white
Custom Visualization Templates
AI platforms now allow the creation of custom visualization templates that adapt to changing data. These templates maintain consistent branding and design elements while automatically updating to reflect new information, ensuring that reports and dashboards always display current insights without manual intervention.
Complex Data Dashboards
PageOn.ai's AI Blocks feature has transformed how I build complex data dashboards. This tool allows users to create sophisticated visualization dashboards without technical expertise by providing modular components that can be arranged and connected intuitively. The AI suggests optimal layouts and connections between different data elements.
Combining Narrative and Data Visualization
AI tools for creating reports now excel at combining narrative text with data visualization. These tools can analyze your data and automatically generate explanatory text that highlights key insights, trends, and anomalies. This creates a cohesive story that guides readers through complex information, making it accessible to non-technical audiences.
Future Directions and Emerging Capabilities
The evolution of AI-powered spreadsheet platforms continues at a rapid pace. Based on current trends and emerging technologies, I anticipate several exciting developments that will further transform how we interact with data and derive insights.

Generative AI in Predictive Modeling
Generative AI is beginning to play a crucial role in creating predictive data models within spreadsheets. Rather than simply analyzing historical data, these systems can generate multiple future scenarios based on different variables, helping organizations plan for various contingencies and optimize decision-making.
Voice-Controlled Analysis
Voice-controlled spreadsheet analysis is changing accessibility and convenience. Users can now query their data, request specific visualizations, and even dictate reports using natural speech. This makes powerful data analysis tools accessible to users with varying technical abilities and physical capabilities.
flowchart TD
    A[Traditional Analysis] --> B[Current AI Capabilities]
    B --> C[Near Future: 1-2 Years]
    C --> D[Medium Term: 3-5 Years]
    D --> E[Long Term: 5+ Years]
    C --> C1[Multi-modal Inputs]
    C --> C2[Enhanced Predictive Models]
    C --> C3[Automated Data Storytelling]
    D --> D1[Autonomous Analysis Agents]
    D --> D2[Cross-platform Data Synthesis]
    D --> D3[Immersive Data Experiences]
    E --> E1[Human-AI Collaborative Teams]
    E --> E2[Neuromorphic Data Processing]
    E --> E3[Ambient Intelligence Systems]
    style B fill:#f9f9f9,stroke:#ccc
    style C fill:#FF8000,stroke:#e67300,color:white
    style D fill:#FF8000,stroke:#e67300,color:white
    style E fill:#FF8000,stroke:#e67300,color:white
AI-Human Collaboration
Emerging standards for AI-human collaboration in data analysis workflows are creating more effective partnerships between human analysts and AI systems. These frameworks define how AI should present suggestions, when to defer to human judgment, and how to incorporate human feedback to improve future recommendations.
External Data Integration
The integration of external data sources through AI-powered connectors is expanding the context available for analysis. Modern platforms can automatically identify relevant external datasets, suggest integrations, and handle the technical aspects of data merging and normalization, providing richer insights without requiring technical expertise.
Agentic Capabilities
PageOn.ai's Agentic capabilities are pushing the boundaries of what's possible in data visualization. These autonomous agents can work proactively to analyze data, identify insights, and generate visualizations without explicit instructions. They learn from user behavior and feedback to continuously improve their recommendations and adapt to specific organizational needs.
Implementation Strategies and Best Practices
Successfully implementing AI-powered spreadsheet platforms requires thoughtful planning and execution. Based on my experience working with organizations across various industries, I've identified several key strategies that maximize the value of these powerful tools.

Needs Assessment
Evaluating which AI spreadsheet features align with organizational needs is the critical first step. I recommend conducting a thorough assessment of current data workflows, pain points, and objectives before selecting a platform. This ensures that you invest in capabilities that address your specific challenges rather than being distracted by impressive but ultimately unnecessary features.
Team Training
Training teams to effectively leverage AI-powered data visualization tools requires a structured approach. I've found that combining general platform training with role-specific modules yields the best results. This ensures that everyone understands the core capabilities while also learning how to apply the tools to their specific responsibilities.
Implementation Checklist
- ✓ Conduct needs assessment and identify key use cases
- ✓ Select platform with features aligned to organizational requirements
- ✓ Develop structured training program with role-specific modules
- ✓ Establish governance framework for AI-assisted data interpretation
- ✓ Create feedback mechanisms to continuously improve implementation
- ✓ Identify champions within each department to support adoption
- ✓ Develop integration plan with existing systems and workflows
Balancing Automation and Human Oversight
While AI-powered tools offer impressive automation capabilities, balancing this with appropriate human oversight is essential, particularly for critical data analysis. I recommend establishing clear guidelines for when AI suggestions should be accepted automatically and when they require human review and approval.
flowchart TD
    A[Identify Spreadsheet Needs] --> B[Select AI Platform]
    B --> C[Initial Configuration]
    C --> D[Team Training]
    D --> E[Pilot Implementation]
    E --> F{Evaluate Results}
    F -->|Success| G[Full Deployment]
    F -->|Issues| H[Refine Approach]
    H --> E
    G --> I[Ongoing Optimization]
    style A fill:#f9f9f9,stroke:#ccc
    style B fill:#f9f9f9,stroke:#ccc
    style C fill:#f9f9f9,stroke:#ccc
    style D fill:#FF8000,stroke:#e67300,color:white
    style E fill:#FF8000,stroke:#e67300,color:white
    style F fill:#f9f9f9,stroke:#ccc
    style G fill:#f9f9f9,stroke:#ccc
    style I fill:#FF8000,stroke:#e67300,color:white
Governance Frameworks
Creating governance frameworks for AI-assisted data interpretation ensures consistency, accuracy, and ethical use. These frameworks should define roles and responsibilities, establish data quality standards, and provide guidelines for validating AI-generated insights before they inform important decisions.
Transforming Existing Spreadsheets
PageOn.ai offers a powerful solution for transforming existing spreadsheets into dynamic visual assets. The platform can analyze your current spreadsheets, identify key data relationships, and suggest optimal visualization approaches. This makes it easy to leverage your existing data resources while benefiting from advanced AI capabilities.
Transform Your Visual Expressions with PageOn.ai
Ready to revolutionize how you work with spreadsheet data? PageOn.ai's powerful AI visualization tools make it easy to transform complex datasets into clear, compelling visual stories that drive better decisions.
Embracing the Future of Data Analysis
As I reflect on the remarkable evolution of spreadsheet technology, it's clear that AI-powered platforms represent a fundamental shift in how we interact with data. These tools are democratizing access to powerful analytical capabilities, making it possible for users with diverse technical backgrounds to derive meaningful insights from complex datasets.
The most successful organizations will be those that embrace these new capabilities while thoughtfully integrating them into existing workflows. By balancing automation with human expertise, companies can dramatically enhance their analytical capabilities while ensuring that insights remain relevant and actionable.
PageOn.ai stands at the forefront of this revolution, offering intuitive tools that transform how we visualize and communicate data. Whether you're creating executive dashboards, analyzing market trends, or documenting complex processes, these AI-powered visualization tools can help you work more efficiently and communicate more effectively.
I encourage you to explore these emerging capabilities and consider how they might transform your own data analysis workflows. The future of spreadsheets is here, and it's more powerful, accessible, and insightful than ever before.
You Might Also Like
The Art of Data Storytelling: Creating Infographics That Captivate and Inform
Discover how to transform complex data into visually compelling narratives through effective infographic design. Learn essential techniques for enhancing data storytelling with visual appeal.
The Art of Text Contrast: Transform Audience Engagement With Visual Hierarchy
Discover how strategic text contrast can guide audience attention, enhance information retention, and create more engaging content across presentations, videos, and marketing materials.
Advanced Shape Effects for Professional Slide Design | Transform Your Presentations
Discover professional slide design techniques using advanced shape effects. Learn strategic implementation, customization, and optimization to create stunning presentations that engage audiences.
Mastering Content Rewriting: How Gemini's Smart Editing Transforms Your Workflow
Discover how to streamline content rewriting with Gemini's smart editing capabilities. Learn effective prompts, advanced techniques, and workflow optimization for maximum impact.