Visualizing the Future: Strategic Business Process Mapping for AI Integration Success
Transform your organization's operations with visual process architecture designed for intelligent systems
I've seen firsthand how the landscape of business process mapping has evolved dramatically in the AI era. What was once a simple exercise in documenting workflows has transformed into a strategic foundation for intelligent systems integration. In this guide, I'll walk you through how we can leverage visual process architecture to not just document but actively enable AI transformation across your organization.

The intersection of process mapping and artificial intelligence represents one of the most promising frontiers for business transformation. When we visualize processes with AI integration in mind, we create a powerful foundation for organizational change that's both strategic and practical. Throughout this guide, I'll share techniques I've developed for creating process maps that don't just document the status quo but actively enable AI-powered innovation.
The Evolution of Business Process Mapping in the AI Era
I've watched business process mapping evolve from simple flowcharts to sophisticated visual architectures that serve as the blueprint for AI integration. This evolution represents a fundamental shift in how we think about processes - from static documentation to dynamic enablement frameworks.
Traditional process mapping focused primarily on documenting existing workflows. However, I've found that AI-enabled mapping requires us to think differently - identifying data flows, decision points, and interaction nodes where intelligence can be embedded. This shift from documentation to enablement is critical for organizations embarking on an company AI transformation roadmap.
flowchart TD
    A[Traditional Process Map] --> B[Data-Enriched Process Map]
    B --> C[AI-Ready Process Architecture]
    subgraph Traditional
    A1[Document Workflows]
    A2[Standardize Procedures]
    A3[Train Staff]
    end
    subgraph Data-Enriched
    B1[Identify Data Sources]
    B2[Map Decision Points]
    B3[Quantify Process Metrics]
    end
    subgraph AI-Ready
    C1[Define AI Integration Points]
    C2[Model Intelligent Workflows]
    C3[Create Learning Feedback Loops]
    end
    A --> Traditional
    B --> Data-Enriched
    C --> AI-Ready
Key Differences: Optimization vs. Transformation
I've observed that process optimization aims to make existing workflows more efficient, while process transformation with AI fundamentally reimagines what's possible. When we create visual process architectures specifically for AI integration, we're not just documenting - we're designing the neural pathways of our organization's future operating model.
Using PageOn.ai's visual mapping tools, I can quickly identify process inefficiencies that are prime candidates for AI enhancement. The platform's ability to layer data visualization over process flows reveals bottlenecks and decision points where intelligent automation would create the most significant impact.
Foundational Elements of AI-Ready Process Maps
In my experience, creating process maps that truly enable AI integration requires specific foundational elements. These components ensure that your visual process architecture serves as both documentation and implementation framework.

Process Hierarchies
I structure process maps in clear hierarchies that help prioritize AI implementation efforts. This layered approach ensures we target high-impact processes first.
Standardized Notation
I've found that consistent visual language across departments ensures AI systems can interpret processes uniformly, regardless of business unit.
Data Flow Indicators
My process maps explicitly show how information moves between steps, highlighting where AI can extract insights from operational data.
Modular Components
Using PageOn.ai's AI Blocks, I create modular process components that can be easily modified as AI capabilities evolve.
Data Touchpoints and AI Integration Markers
When I map processes for AI integration, I pay special attention to identifying critical data collection points within workflows. These touchpoints represent opportunities for AI to gather insights and learn from operational patterns.
flowchart TD
    Start([Process Start]) --> A[Collect Customer Data]
    A -->|Data Touchpoint| B{Evaluate Request}
    B -->|Decision Node| C[Standard Processing]
    B -->|Decision Node| D[Special Handling]
    C --> E[Quality Check]
    D --> E
    E -->|Data Touchpoint| F{Compliance Review}
    F -->|Decision Node| G[Complete Process]
    F -->|Decision Node| H[Return for Revision]
    H --> A
    G --> End([Process End])
    classDef touchpoint fill:#FF8000,stroke:#FF6000,color:white
    classDef decision fill:#42A5F5,stroke:#1E88E5,color:white
    class A,E touchpoint
    class B,F decision
I've found that mapping decision nodes where AI can provide enhanced insights is particularly valuable. These are points in the process where intelligent systems can offer recommendations based on data patterns that might not be apparent to human operators. Similarly, customer interaction points often represent prime opportunities for AI enhancement through personalization and predictive capabilities.
When documenting regulatory considerations in AI-augmented processes, I ensure that compliance requirements are clearly visualized. This approach helps maintain governance while still enabling innovation through entrepreneurial decision mapping that balances risk and opportunity.
Developing Your Company's AI Transformation Roadmap
I've learned that successful AI implementation requires a clear visual roadmap that guides the organization through process-by-process transformation. This roadmap serves as both a strategic plan and a communication tool for stakeholders across the enterprise.
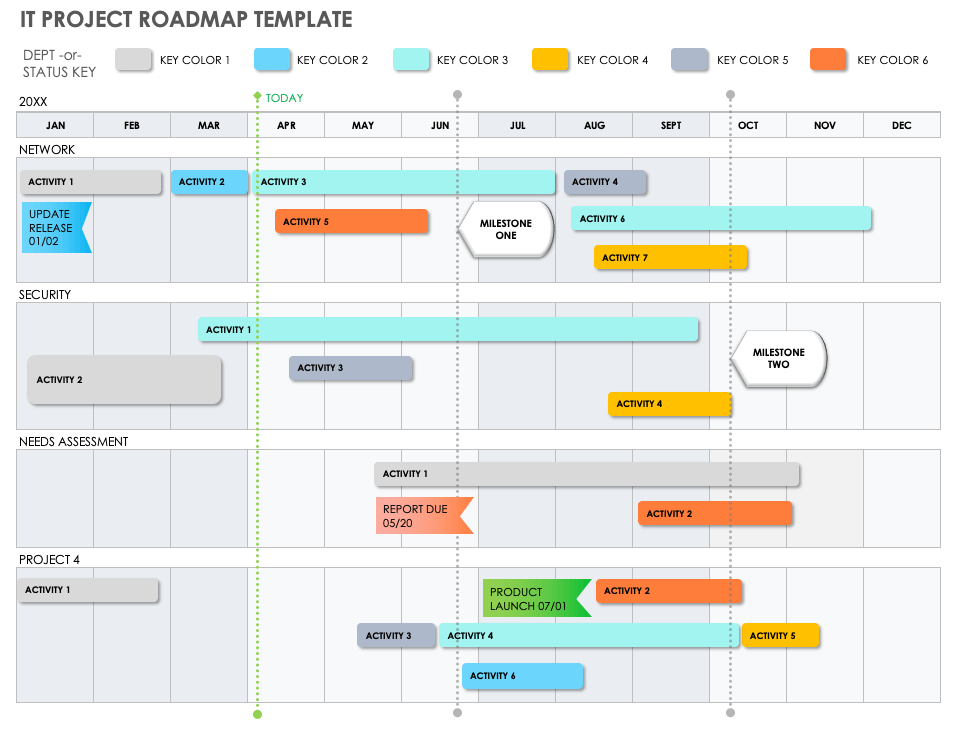
When I develop a transformation roadmap, I establish a visual timeline that clearly shows the sequence of process transformations. This approach helps organizations prioritize their efforts and allocate resources effectively across multiple initiatives.
Measuring Transformation Progress
I always establish clear KPIs for each transformation stage to track implementation success. These metrics help maintain momentum and demonstrate value throughout the AI integration journey.
| Transformation Stage | Key Performance Indicators | Visualization Method |
|---|---|---|
| Process Assessment | Completion rate, Data quality scores | Progress dashboards, Data quality heat maps |
| AI Model Development | Model accuracy, Training iterations | Performance trend charts, Learning curves |
| Integration Deployment | Implementation time, Adoption rates | Timeline visualizations, Usage heat maps |
| Value Realization | Efficiency gains, Cost reduction, Revenue impact | Before/after comparisons, ROI dashboards |
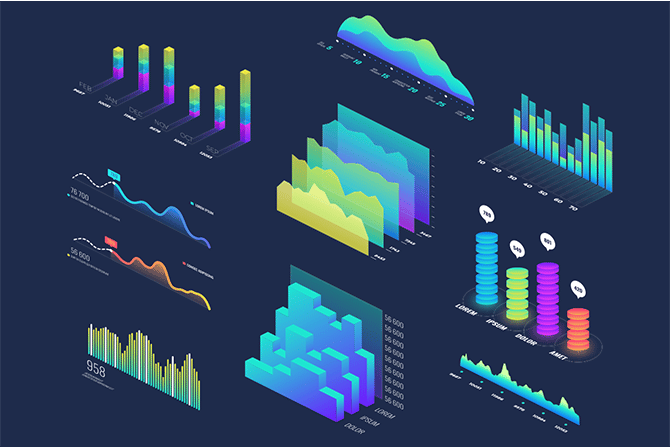
Creating visual dashboards to track implementation success has been instrumental in my projects. These visualizations make progress tangible and help maintain stakeholder buy-in throughout the transformation journey. I've found that PageOn.ai's Deep Search functionality enables me to incorporate relevant industry benchmarks into these dashboards, providing valuable context for our progress metrics.
Business Intelligence Enhancement Through Process-Integrated AI
I've seen how business intelligence AI integration with process mapping creates powerful synergies. When we map data collection points across the enterprise process landscape, we create a foundation for insights that wasn't possible before.
The true power of process-integrated AI comes from its ability to transform raw operational data into actionable insights. By visualizing this transformation, we can better understand how intelligence emerges from our everyday business activities.
flowchart TD
    A[Process Data Collection] -->|Raw Data| B[AI Processing Layer]
    B -->|Structured Insights| C[Business Intelligence Platform]
    subgraph "Data Sources"
    A1[Customer Interactions]
    A2[Operational Metrics]
    A3[Financial Transactions]
    A4[Supply Chain Events]
    end
    subgraph "AI Processing"
    B1[Pattern Recognition]
    B2[Anomaly Detection]
    B3[Predictive Analytics]
    B4[Natural Language Processing]
    end
    subgraph "Intelligence Outputs"
    C1[Executive Dashboards]
    C2[Operational Alerts]
    C3[Strategic Recommendations]
    C4[Automated Reports]
    end
    A1 & A2 & A3 & A4 --> A
    B --> B1 & B2 & B3 & B4
    C1 & C2 & C3 & C4 --> C
I've found that creating decision support frameworks based on AI-enhanced process data dramatically improves operational decision-making. These frameworks visualize how intelligence flows from processes to decision points, enabling more informed choices at all organizational levels.
Using PageOn.ai to create dynamic visualizations has been a game-changer in my projects. As AI systems learn from process data, these visualizations evolve to reflect new insights and patterns, creating a continuously improving intelligence layer across the organization.
Strategic Decision Mapping for AI Implementation
I've found that visualizing the decision landscape for AI implementation helps organizations navigate complex choices with greater confidence. Strategic decision mapping creates clarity around options, risks, and potential rewards.
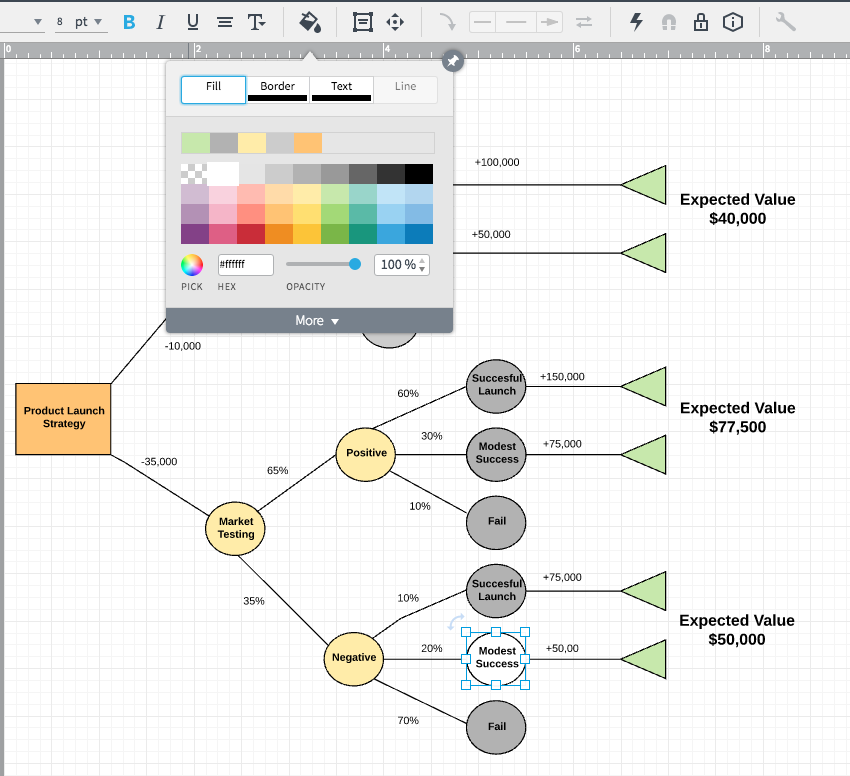
When mapping risk-reward scenarios for different AI implementation approaches, I create visual frameworks that help stakeholders understand tradeoffs and make more informed decisions. This approach aligns perfectly with entrepreneurial decision mapping techniques.
flowchart TD
    A[AI Implementation Approach] --> B{Build vs Buy}
    B -->|Build| C[In-house Development]
    B -->|Buy| D[Vendor Solution]
    C --> C1{Team Capability}
    C1 -->|Strong| C2[Develop Custom Solution]
    C1 -->|Limited| C3[Hybrid Approach]
    D --> D1{Integration Complexity}
    D1 -->|High| D2[Phased Implementation]
    D1 -->|Low| D3[Rapid Deployment]
    C2 --> E[ROI Evaluation]
    C3 --> E
    D2 --> E
    D3 --> E
    E --> F[Implementation Decision]
    classDef decision fill:#42A5F5,stroke:#1E88E5,color:white
    classDef outcome fill:#FF8000,stroke:#FF6000,color:white
    class A,F outcome
    class B,C1,D1,E decision
Using PageOn.ai's Vibe Creation feature has transformed how I approach complex decision factors. The platform enables me to turn abstract concepts into clear visual frameworks that guide strategic AI implementation choices. These visualizations make it easier to align stakeholders around a shared understanding of options and tradeoffs.
Building an Enterprise Knowledge Architecture for AI Success
I've learned that enterprise knowledge architecture forms the foundation for successful AI implementation. By designing visual taxonomies of process knowledge, we create the structure needed for effective AI training and deployment.
When mapping information flows between legacy systems and new AI components, I focus on creating clear visual representations that highlight integration points and data transformation requirements. This approach ensures that organizational knowledge can flow seamlessly into AI training materials.
flowchart TD
    A[Enterprise Knowledge] --> B[Structured Knowledge]
    A --> C[Unstructured Knowledge]
    B --> D[Database Records]
    B --> E[Process Documentation]
    B --> F[Business Rules]
    C --> G[Customer Interactions]
    C --> H[Email Communications]
    C --> I[Meeting Notes]
    D & E & F & G & H & I --> J[Knowledge Processing Layer]
    J --> K[AI Training Materials]
    J --> L[Process Enhancement Insights]
    J --> M[Decision Support Framework]
    K & L & M --> N[AI Implementation]
    classDef knowledge fill:#FF8000,stroke:#FF6000,color:white
    classDef processing fill:#42A5F5,stroke:#1E88E5,color:white
    classDef implementation fill:#66BB6A,stroke:#43A047,color:white
    class A,B,C,D,E,F,G,H,I knowledge
    class J,K,L,M processing
    class N implementation
Creating visual representations of data governance frameworks has been crucial in my AI implementation projects. These visualizations help ensure that AI systems operate within appropriate boundaries while still leveraging the full power of organizational knowledge.
I've found that leveraging PageOn.ai to structure and visualize an organization's unique process knowledge base dramatically accelerates AI implementation. The platform's ability to create clear taxonomies and relationship maps ensures that knowledge is properly organized for AI consumption.
Integrating Intelligent Agents into Your Process Ecosystem
I've seen firsthand how intelligent agents can transform business processes when strategically integrated. Mapping specific process areas where these agents create maximum value is essential for successful implementation.

When visualizing agent interaction points with human team members, I focus on creating clear representations of how collaboration occurs. This approach helps build trust and understanding around the role of intelligent agents industry ecosystem in the organization.
Creating governance frameworks for agent deployment has become a critical part of my implementation approach. These visual frameworks ensure that intelligent agents operate within appropriate boundaries while still delivering maximum value.
flowchart TD
    A[Business Process] --> B{Decision Point}
    B -->|Simple/Routine| C[Agent-Led Action]
    B -->|Complex/Nuanced| D[Human-Led Action]
    B -->|Collaborative| E[Human-Agent Partnership]
    C --> F[Automated Execution]
    D --> G[Human Execution]
    E --> H[Collaborative Execution]
    F & G & H --> I[Process Outcome]
    I -->|Feedback Loop| A
    subgraph "Agent Capabilities"
    J[Data Processing]
    K[Pattern Recognition]
    L[Recommendation Engine]
    M[Automated Actions]
    end
    subgraph "Human Capabilities"
    N[Creative Thinking]
    O[Ethical Judgment]
    P[Contextual Understanding]
    Q[Emotional Intelligence]
    end
    C --> J & K & L & M
    D --> N & O & P & Q
    E --> J & K & L & M & N & O & P & Q
I've found that using PageOn.ai to model intelligent agent deployment scenarios is incredibly valuable. The platform enables me to simulate outcomes and visualize how multiple agents can collaborate across complex process chains, ensuring optimal implementation strategies.
Implementation Case Studies and Success Patterns
Throughout my work with organizations implementing AI through strategic process mapping, I've collected valuable case studies that illustrate both success patterns and common pitfalls. These real-world examples provide practical insights for your own implementation journey.
Financial Services Transformation
A major bank implemented process-integrated AI to transform their customer onboarding experience, reducing processing time by 78% while improving compliance accuracy.

Manufacturing Intelligence
A manufacturing firm used process mapping to integrate AI into their quality control systems, reducing defects by 45% and improving predictive maintenance accuracy.
Common Implementation Pitfalls
I've observed that organizations that create visual comparisons of different implementation approaches tend to make more informed decisions. These visualizations help stakeholders understand tradeoffs and select strategies that align with their specific organizational context.
Using PageOn.ai to craft compelling visual narratives around your organization's AI transformation journey can significantly enhance stakeholder engagement. The platform's ability to create clear, visually appealing process maps helps communicate complex transformation initiatives in ways that build understanding and support.
Transform Your Business Processes with Powerful Visual Mapping
Ready to create strategic process maps that enable successful AI integration? PageOn.ai provides the visual tools you need to transform your organization's approach to process mapping and AI implementation.
Start Your AI Transformation TodayBringing It All Together
Throughout this guide, I've shared my approach to strategic business process mapping for AI integration. The journey from traditional process documentation to AI-enabled visual architectures represents a fundamental shift in how organizations prepare for intelligent transformation.
By creating process maps that specifically identify data flows, decision points, and interaction nodes, we establish the foundation for successful AI implementation. These visual frameworks not only document current operations but actively enable the integration of intelligence across the enterprise.
As you embark on your own AI transformation journey, remember that visualization is key to success. Clear, compelling visual process maps help align stakeholders, identify opportunities, and guide implementation efforts. With tools like PageOn.ai, you can create these powerful visual frameworks and transform how your organization approaches process mapping for the AI era.
You Might Also Like
Bringing Google Slides to Life with Dynamic Animations | Complete Guide
Transform static presentations into engaging visual stories with our comprehensive guide to Google Slides animations. Learn essential techniques, advanced storytelling, and practical applications.
Revolutionizing Market Entry Presentations with ChatGPT and Gamma - Strategic Impact Guide
Learn how to leverage ChatGPT and Gamma to create compelling market entry presentations in under 90 minutes. Discover advanced prompting techniques and visual strategies for impactful pitches.
Enhancing Audience Experience with Strategic Audio Integration | Create Immersive Brand Connections
Discover how strategic audio integration creates immersive brand connections across podcasts, streaming platforms, and smart speakers. Learn frameworks and techniques to transform your marketing.
The Art of Data Storytelling: Creating Infographics That Captivate and Inform
Discover how to transform complex data into visually compelling narratives through effective infographic design. Learn essential techniques for enhancing data storytelling with visual appeal.