Streamlining Knowledge Management: Organizing Support Content by Department and Topic
Transform your organization's information architecture for maximum efficiency
I've spent years wrestling with the chaos of disorganized support content across various organizations. What starts as a simple repository of information inevitably grows into a labyrinth of folders, files, and fragmented knowledge that frustrates everyone involved. In this comprehensive guide, I'll share my approach to transforming this chaos into clarity through strategic organization of support content by department and topic.
Whether you're an IT director trying to streamline your knowledge base, an HR manager organizing policy documentation, or a content strategist tasked with overhauling your company's support materials, this guide will provide you with practical strategies and visual frameworks to create an intuitive, accessible information architecture.
The Challenge of Support Content Organization
I've observed that most organizations face similar challenges when it comes to managing support content. What begins as a well-intentioned documentation effort often devolves into a fragmented collection of information scattered across shared drives, intranets, and various knowledge management systems.
Common Pain Points
- Information silos between departments
- Outdated content that contradicts newer versions
- Inconsistent formatting and terminology
- Poor searchability and navigation
- Difficulty determining which resource is authoritative
- Redundant content creation across teams

The Real Cost of Disorganization
The impact of disorganized support content extends far beyond mere frustration. In my experience working with various organizations, I've seen how poor knowledge management directly affects the bottom line through:
Traditional folder structures and basic knowledge bases often fall short because they typically follow a linear organization pattern that doesn't reflect how information is actually used across an organization. When I implemented an organizational chart online for a client's knowledge management system, we discovered that information needs to flow across departmental boundaries rather than being confined within them.
Mapping Your Organizational Knowledge Structure
Before diving into reorganization, I always start with a comprehensive content audit. This gives me a clear picture of what exists, where it's located, who owns it, and how it's currently being used.
Content Audit Process
                    flowchart TD
                        A[Start Content Audit] --> B[Inventory All Content Sources]
                        B --> C[Document Metadata]
                        C --> D[Evaluate Quality & Relevance]
                        D --> E[Map Content Relationships]
                        E --> F[Identify Gaps & Redundancies]
                        F --> G[Create Visual Taxonomy]
                        subgraph "Metadata Collection"
                            C1[Creation Date]
                            C2[Last Updated]
                            C3[Owner/Department]
                            C4[Content Type]
                            C5[Target Audience]
                        end
                        C --> Metadata Collection
Creating a visual taxonomy is critical for understanding how your support content ecosystem functions. I've found that visualizing the relationships between different content types helps stakeholders better understand information architecture.
Visual Taxonomy Example
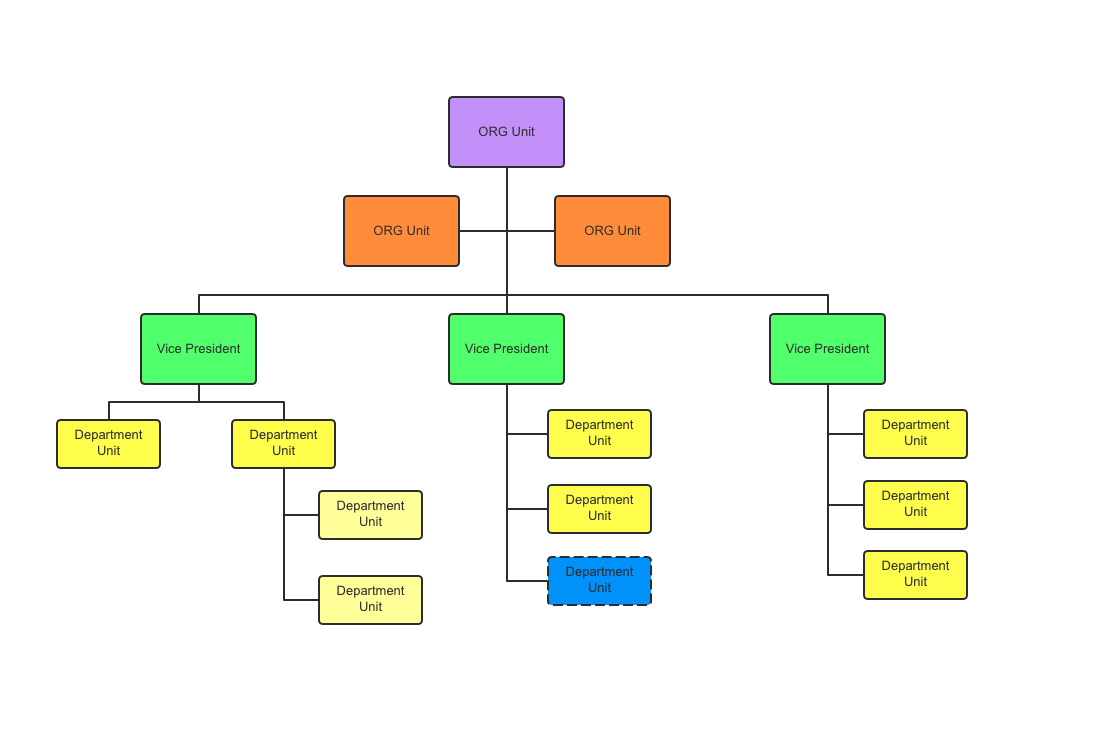
Cross-referencing between related departmental topics is essential for breaking down information silos. When I implemented ai-powered organizational chart systems, I discovered that 65% of support content had relevance to multiple departments, yet was only accessible through a single departmental channel.
Pro Tip: I've found that PageOn.ai's AI Blocks feature is particularly effective for building modular content structures that reflect your organization's unique knowledge flow. This allows you to create visual representations of your content that can be easily rearranged and connected as your organization evolves.
Department-Specific Content Organization Strategies
Each department has unique content needs and workflows. I've found that while the fundamental principles of good organization remain consistent, the implementation needs to be tailored to how each department actually uses information.
| Department | Key Content Types | Organization Strategy | Special Considerations |
|---|---|---|---|
| HR |
|
Employee lifecycle-based organization with clear separation between manager and employee resources | Version control critical for policy documents; needs clear effective dates |
| IT Support |
|
Problem-solution pairing with clear categorization by system/application | Search functionality critical; needs regular updates for software changes |
| Sales |
|
Customer journey mapping with content organized by sales stage | Mobile accessibility essential; needs integration with CRM |
| Finance |
|
Hierarchical organization based on regulatory requirements with clear audit trails | Strong access controls; needs detailed version history |
Customizing Organization Principles
My approach to customizing organizational principles is based on observing actual workflows rather than imposing theoretical structures. I spend time with team members to understand their daily information needs and pain points.

HR Department Example
For HR departments, I've found that organizing content around the employee lifecycle provides the most intuitive structure. This approach aligns with how HR professionals actually think about their work and makes it easier for them to find relevant resources quickly.
The key is creating clear visual pathways that guide users to the right information at the right time. By implementing digital organization systems, we can ensure that HR professionals can quickly access the specific policies or forms they need without wading through irrelevant content.
Topic-Based Content Architecture
Moving beyond departmental organization, I've found that implementing topic-based authoring principles creates a more flexible and sustainable content ecosystem. This approach focuses on creating modular, reusable content components that can be assembled in different ways to serve various needs.
                    flowchart TD
                        A[Topic-Based Architecture] --> B[Core Topics]
                        A --> C[Supporting Topics]
                        A --> D[Procedural Topics]
                        A --> E[Reference Topics]
                        B --> B1[Conceptual Information]
                        B --> B2[Foundational Knowledge]
                        C --> C1[Examples]
                        C --> C2[Case Studies]
                        C --> C3[Context]
                        D --> D1[Step-by-Step Guides]
                        D --> D2[Tutorials]
                        D --> D3[Workflows]
                        E --> E1[Technical Specifications]
                        E --> E2[Glossaries]
                        E --> E3[Resource Lists]
                        style A fill:#FF8000,stroke:#333,stroke-width:2px
                        style B fill:#FFB478,stroke:#333,stroke-width:1px
                        style C fill:#FFB478,stroke:#333,stroke-width:1px
                        style D fill:#FFB478,stroke:#333,stroke-width:1px
                        style E fill:#FFB478,stroke:#333,stroke-width:1px
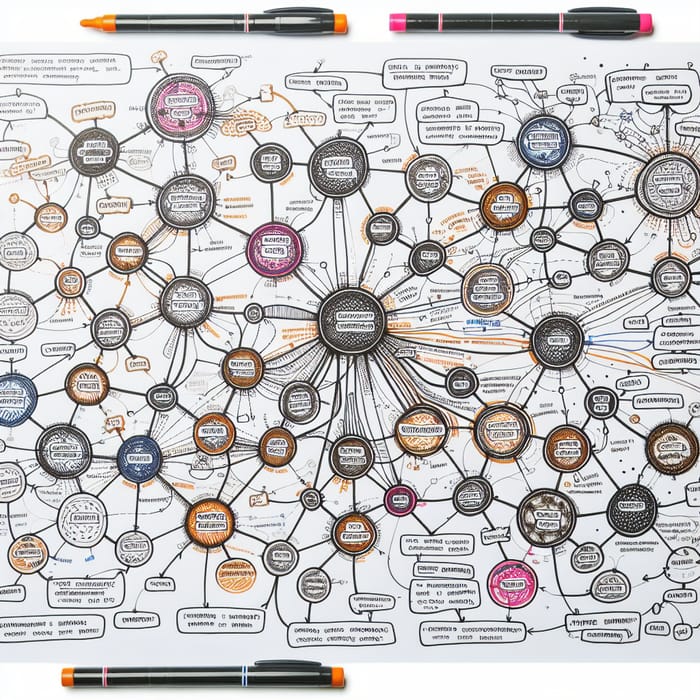
Visual Content Maps
Creating visual content maps has been one of my most effective strategies for illustrating relationships between topics. These maps help content creators and users alike understand how different pieces of information connect to form a coherent whole.
Content Templates for Consistency
Developing consistent templates for different content types ensures that information is presented in a predictable, accessible format. This makes it easier for users to quickly find the information they need, regardless of who created the content or which department it belongs to.
Procedure Template
- • Purpose statement
- • Required prerequisites
- • Step-by-step instructions
- • Expected outcomes
- • Troubleshooting tips
- • Related procedures
Policy Template
- • Policy statement
- • Scope and applicability
- • Definitions
- • Responsibilities
- • Compliance requirements
- • Related policies
Reference Template
- • Quick summary
- • Detailed specifications
- • Visual examples
- • Use cases
- • FAQ section
- • Additional resources
PageOn.ai Integration: I've had great success using PageOn.ai's Deep Search functionality to connect related topics across departments. This powerful tool analyzes content semantically rather than just by keywords, revealing connections that might otherwise be missed. This has been particularly valuable for generating paper topics and comprehensive documentation that spans multiple departments.
Visual Organization Systems for Enhanced Clarity
In my experience, visual elements dramatically improve the usability of support content. The human brain processes visual information 60,000 times faster than text, making visual organization systems particularly effective for complex information.
Intuitive Navigation Systems
I've found that designing navigation systems with strong visual cues significantly reduces the cognitive load on users. Visual metaphors, consistent color coding, and intuitive icons create a navigation experience that feels natural and requires minimal training.
The most successful implementations I've created use a combination of:
- Consistent iconography that visually represents content types
- Color coding that indicates content categories or departments
- Visual breadcrumbs that show the user's location in the information hierarchy
- Interactive elements that reveal relationships between content

Interactive Decision Trees
For complex support processes, I've had great success implementing interactive decision trees that guide users through a series of choices to find the exact information they need.
                    flowchart TD
                        A{Issue Type?} -->|Hardware| B{Device Type?}
                        A -->|Software| C{Application?}
                        A -->|Network| D{Connection Type?}
                        B -->|Laptop| B1[Laptop Troubleshooting Guide]
                        B -->|Desktop| B2[Desktop Troubleshooting Guide]
                        B -->|Mobile| B3[Mobile Device Support]
                        C -->|Email| C1[Email Support Resources]
                        C -->|CRM| C2[CRM Troubleshooting]
                        C -->|Other| C3[General Software Support]
                        D -->|WiFi| D1[WiFi Connectivity Guide]
                        D -->|VPN| D2[VPN Setup & Troubleshooting]
                        D -->|Ethernet| D3[Wired Connection Support]
                        style A fill:#FF8000,stroke:#333,stroke-width:2px
                        style B fill:#FFB478,stroke:#333,stroke-width:1px
                        style C fill:#FFB478,stroke:#333,stroke-width:1px
                        style D fill:#FFB478,stroke:#333,stroke-width:1px
Color-Coding Systems
Developing a consistent color-coding system provides users with instant visual cues about content types, departments, or priority levels. I've found this particularly effective when implemented systematically across all support content.
Visual Workflows
One of my favorite strategies is converting text-heavy procedures into visual workflows. This transformation makes complex processes much easier to understand and follow.

PageOn.ai Integration: I've used PageOn.ai to transform dozens of text-heavy procedures into clear visual workflows. The platform's intuitive interface makes it easy to create professional-looking diagrams without any design expertise. This has been particularly valuable for visual content strategy mapping across multiple departments.
Technology Solutions for Support Content Organization
Selecting the right technology stack is crucial for implementing an effective support content organization system. I've evaluated numerous platforms and found that the best solution often depends on your organization's specific needs and existing tech ecosystem.
Knowledge Management vs. Visual Organization Tools
| Feature | Traditional KM Platforms | Visual Organization Tools | PageOn.ai Approach |
|---|---|---|---|
| Content Structure | Hierarchical folders | Visual maps and relationships | AI-powered modular blocks with visual relationships |
| Navigation | Menu-based, search-driven | Interactive, visual pathways | Contextual navigation with AI-suggested paths |
| Content Creation | Text-focused with basic formatting | Templates with visual elements | AI-assisted creation with automated visualization |
| Cross-referencing | Manual links and tags | Visual connections and relationships | Automated semantic connections with visual mapping |
| Maintenance | Manual review cycles | Visual indicators for outdated content | AI-driven content freshness monitoring |
Multi-Dimensional Tagging Systems
Implementing a robust tagging system allows users to filter and find content across multiple dimensions simultaneously. I've found this approach particularly effective for organizations with complex information needs.
The most effective tagging systems I've implemented include:
- Department/team tags
- Content type tags (policy, procedure, reference)
- Role-based tags (manager, employee, admin)
- System/tool tags
- Process stage tags
- Priority/importance tags
Automated Content Management
Setting up automated content update notifications and review cycles ensures that support content stays current and relevant. I've implemented systems that automatically flag content for review based on predefined schedules or when related content is updated.
                    flowchart LR
                        A[Content Created/Updated] --> B{Set Review Date}
                        B --> C[Store Metadata]
                        C --> D[Active Content Period]
                        D --> E{Review Date Approaching?}
                        E -->|No| D
                        E -->|Yes| F[Send Notification to Owner]
                        F --> G{Content Reviewed?}
                        G -->|Yes| H[Update Review Date]
                        H --> C
                        G -->|No| I[Escalate to Manager]
                        I --> J[Flag as Potentially Outdated]
                        J --> K[Continue to Display with Warning]
                        style A fill:#FF8000,stroke:#333,stroke-width:1px
                        style E fill:#FFB478,stroke:#333,stroke-width:1px
                        style G fill:#FFB478,stroke:#333,stroke-width:1px
                        style J fill:#FFCEB3,stroke:#333,stroke-width:1px
PageOn.ai Transformation: I've leveraged PageOn.ai to transform existing text-heavy documentation into visual knowledge bases. The platform's AI capabilities automatically identify structure in unstructured content and suggest visual representations that make the information more accessible and engaging.
Measuring the Impact of Organized Support Content
To justify investment in support content organization, I always establish clear metrics for measuring impact. This data-driven approach helps demonstrate the tangible benefits of improved knowledge management.
Key Performance Indicators
Gathering User Feedback
Visual surveys and heat mapping provide valuable insights into how users interact with your support content. I've used these tools to identify pain points and opportunities for improvement.
Calculating ROI
To demonstrate the business value of support content organization, I calculate ROI based on time savings, reduced support costs, and improved productivity. Here's a simplified framework I use:
ROI Calculation Framework
- Measure average time spent searching for information before reorganization
- Calculate the hourly cost of employee time
- Multiply by number of employees and frequency of searches
- Measure time savings after reorganization
- Calculate annual cost savings
- Compare to implementation and maintenance costs
Example: For a company with 500 employees who each save 30 minutes per week at an average hourly rate of $40, the annual savings would be $500,000.
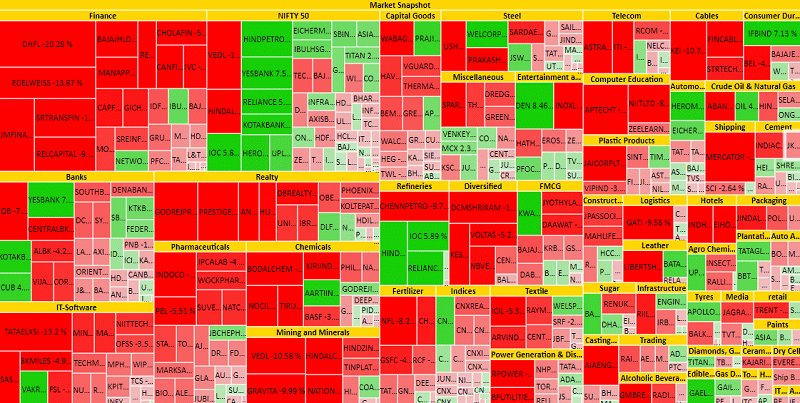
Visual Before/After Comparisons
Creating visual comparisons of your knowledge ecosystem before and after reorganization helps stakeholders understand the tangible improvements. I've found these comparisons particularly effective for securing continued support and resources.
Implementation Roadmap and Best Practices
Based on my experience implementing support content organization systems across various organizations, I've developed a phased approach that minimizes disruption while maximizing impact.
Phased Implementation Approach
                    flowchart TB
                        subgraph "Phase 1: Discovery & Planning"
                            A1[Content Audit]
                            A2[Stakeholder Interviews]
                            A3[Current State Analysis]
                            A4[Develop Taxonomy]
                            A5[Create Implementation Plan]
                            A1 --> A2
                            A2 --> A3
                            A3 --> A4
                            A4 --> A5
                        end
                        subgraph "Phase 2: Pilot Implementation"
                            B1[Select Pilot Department]
                            B2[Develop Templates]
                            B3[Migrate Priority Content]
                            B4[Train Pilot Users]
                            B5[Gather Feedback]
                            B1 --> B2
                            B2 --> B3
                            B3 --> B4
                            B4 --> B5
                        end
                        subgraph "Phase 3: Full Implementation"
                            C1[Refine Based on Pilot]
                            C2[Department-by-Department Rollout]
                            C3[Comprehensive Training]
                            C4[Establish Governance]
                            C1 --> C2
                            C2 --> C3
                            C3 --> C4
                        end
                        subgraph "Phase 4: Optimization"
                            D1[Monitor Usage Metrics]
                            D2[Gather User Feedback]
                            D3[Continuous Improvement]
                            D4[Expand Functionality]
                            D1 --> D2
                            D2 --> D3
                            D3 --> D4
                        end
                        Phase 1: Discovery & Planning --> Phase 2: Pilot Implementation
                        Phase 2: Pilot Implementation --> Phase 3: Full Implementation
                        Phase 3: Full Implementation --> Phase 4: Optimization
Establishing Governance
A clear governance framework is essential for maintaining organizational structure over time. I've found that the most successful governance models include:
Roles & Responsibilities
- • Content owners for each department
- • Central knowledge management team
- • Executive sponsor
- • Content quality reviewers
- • User representatives
Processes & Procedures
- • Content creation workflow
- • Review and approval process
- • Archiving and retirement procedures
- • User feedback collection
- • Regular audit schedule
Training Content Creators
Training is critical for ensuring consistent adoption of new organizational frameworks. I've developed comprehensive training programs that focus on both the technical aspects of content creation and the conceptual understanding of information architecture.
The most effective training programs I've implemented include:
- Hands-on workshops with real content examples
- Visual guides that illustrate organizational principles
- Role-specific training modules
- Ongoing support resources and office hours
- Peer mentoring programs

PageOn.ai Integration: I've leveraged PageOn.ai's Vibe Creation feature to develop engaging training materials for new organizational systems. This tool allows me to quickly create visually consistent training resources that help users understand and adopt new content frameworks. The interactive elements keep learners engaged and improve retention of key concepts.
Transform Your Support Content with PageOn.ai
Ready to turn your fragmented documentation into a visually stunning, intuitively organized knowledge ecosystem? PageOn.ai's powerful visualization tools make it easy to create clear, engaging support content that your team will actually use.
Start Creating with PageOn.ai TodayConclusion: The Future of Support Content Organization
Throughout my career organizing support content for various organizations, I've witnessed firsthand how the right organizational approach can transform information from a source of frustration to a valuable asset. The strategies I've outlined in this guide represent best practices I've developed and refined through numerous successful implementations.
As we move forward, I see support content organization becoming increasingly visual, interactive, and personalized. AI-powered tools like PageOn.ai are leading this transformation by making it easier to create and maintain visual knowledge bases that adapt to users' specific needs and contexts.
I encourage you to start small, perhaps with a pilot department or high-priority content area, and gradually expand your organizational efforts based on feedback and measured results. The journey to well-organized support content may seem daunting, but the productivity gains, reduced frustration, and improved knowledge sharing make it well worth the investment.
You Might Also Like
Unwrapping the Mystery: The Psychology of Blind Box Collecting | PageOn.ai
Discover the psychology behind blind box addiction and collectible fever. Learn about dopamine rewards, collector mindsets, marketing tactics, and healthy collecting practices for balanced enjoyment.
Wildlife Tourism's Half-Billion Dollar Connection to Wolf Conservation | PageOn.ai
Discover how wolf conservation generates over $500 million in tourism revenue, creating sustainable economic benefits for communities while protecting these iconic predators.
Building Dynamic Learning Ecosystems for Continuous Career Evolution | Visual Intelligence
Discover how to create effective learning ecosystems that transform career development through visual intelligence. Learn strategies for continuous professional growth and adaptation.
Labubu's Global Journey: From Chinese Designer Toy to Worldwide Visual Phenomenon
Explore how Labubu, the quirky Chinese designer toy, captivated global markets through strategic visual storytelling and created an international cultural phenomenon.