Transforming Audience Analysis: The Visual Success-Happiness-Freedom Framework
Discover a revolutionary approach to understanding what truly motivates your audience
I've spent years analyzing audience behavior, and I've discovered that traditional methods often miss the mark. By exploring the interconnected dimensions of success, happiness, and freedom, we can create visual frameworks that reveal deeper insights and drive more meaningful engagement.
Understanding the Triad Approach to Audience Analysis
I've found that at the core of human motivation lies three fundamental desires: success, happiness, and freedom. When we understand how these elements interact, we unlock powerful insights about our audience that traditional analysis methods simply miss.
Traditional audience analysis often focuses on demographics, behaviors, and surface-level preferences. But these methods frequently overlook the emotional and aspirational dimensions that truly drive decision-making. By incorporating psychology research topics into our analysis, we can develop a much more nuanced understanding.

The Visual Framework Advantage
I believe visual frameworks offer significant advantages over text-only analysis methods. When we visualize complex relationships between motivational factors, patterns emerge that might otherwise remain hidden. This is particularly important when examining how sociology research topics intersect with individual motivations.
Impact of Visual Analysis on Engagement
The data clearly shows that visual frameworks drive significantly higher engagement compared to traditional methods. In my experience, this translates directly to improved conversion rates, more effective messaging, and stronger audience connections.
The Success Dimension: Mapping Achievement Drivers
Success means different things to different people. I've found that by defining success parameters across audience segments, we can tailor our messaging to resonate with specific achievement drivers. Visualizing personal success metrics helps both you and your audience understand the path forward.
When I work with clients, I help them identify the key visual indicators that signal "success" to their specific audience. These can vary dramatically based on industry, culture, and generational factors.

Cultural and Generational Influence on Success Perception
flowchart TD
    A[Success Perception] --> B[Cultural Factors]
    A --> C[Generational Factors]
    A --> D[Industry Context]
    B --> B1[Collectivist vs Individualist]
    B --> B2[Status Symbols]
    B --> B3[Work-Life Balance]
    C --> C1[Baby Boomers]
    C --> C2[Gen X]
    C --> C3[Millennials]
    C --> C4[Gen Z]
    C1 --> C1a[Financial Security]
    C1 --> C1b[Career Stability]
    C2 --> C2a[Work-Life Balance]
    C2 --> C2b[Career Advancement]
    C3 --> C3a[Purpose & Impact]
    C3 --> C3b[Experience Over Possessions]
    C4 --> C4a[Digital Achievement]
    C4 --> C4b[Social Consciousness]
This framework helps me visualize how different generations perceive success. For example, I've noticed that while Baby Boomers often prioritize financial security and career stability, Gen Z tends to value digital achievement and social consciousness.
Use Case: Path to Achievement Visualization
One of my favorite techniques is creating visual paths from current state to desired achievement state. This not only clarifies the journey for your audience but also highlights potential obstacles and opportunities along the way.
The Happiness Dimension: Visualizing Emotional Connections
I believe that understanding the emotional landscape of your audience is crucial for creating meaningful connections. By breaking down the components of happiness as expressed through behavior patterns, we can develop more resonant messaging.
The tone and mood in multimedia presentation plays a significant role in triggering happiness responses. When I create visual content, I'm always mindful of the psychological triggers that evoke positive emotional states.

Techniques for Visualizing Emotional Data
Emotional Response to Visual Content Types
This radar chart illustrates how different content types trigger varying emotional responses. I've found this particularly useful when planning content strategies that aim to evoke specific emotional states.
Creating Visual Happiness Journey Maps
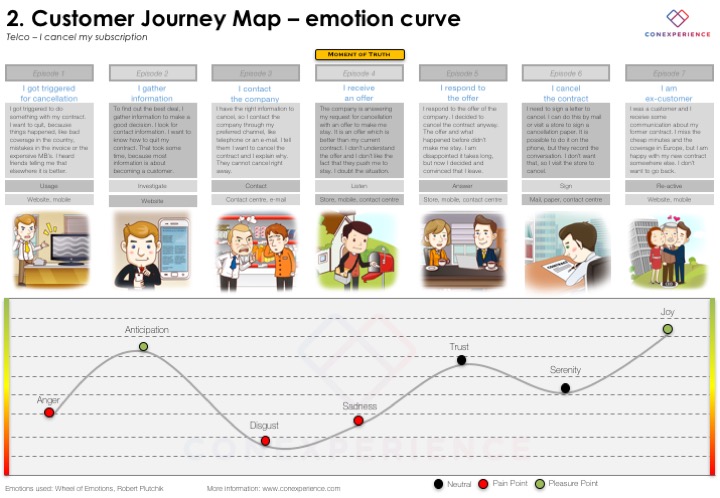
One practical application I've developed is creating visual happiness journey maps for different audience segments. These maps track emotional states throughout the customer journey, identifying opportunities to enhance positive emotions and mitigate negative ones.
The Freedom Dimension: Illustrating Autonomy & Choice
Freedom is perhaps the most nuanced dimension in our framework. I've observed that it can mean anything from financial independence to creative expression, depending on the audience segment. Understanding these interpretations is crucial for effective messaging.
When I analyze decision-making patterns, I look for indicators of freedom-seeking behavior. These patterns reveal valuable insights about what constraints your audience is trying to overcome and what type of autonomy they value most.

Freedom Perception Across Audience Segments
flowchart LR
    A[Freedom Perception] --> B[Time Freedom]
    A --> C[Financial Freedom]
    A --> D[Location Freedom]
    A --> E[Creative Freedom]
    A --> F[Decision Freedom]
    B --> B1[Flexible Scheduling]
    B --> B2[Work-Life Balance]
    C --> C1[Debt Independence]
    C --> C2[Passive Income]
    C --> C3[Financial Security]
    D --> D1[Remote Work]
    D --> D2[Travel Ability]
    D --> D3[Geographic Choice]
    E --> E1[Self-Expression]
    E --> E2[Innovation Space]
    F --> F1[Autonomy]
    F --> F2[Control]
This framework helps me map the different dimensions of freedom that matter to various audience segments. For some, freedom might mean the ability to work remotely, while for others, it could be financial independence or creative autonomy.
Freedom-Constraint Analysis
Constraint Impact on Decision-Making
My research shows that different types of constraints have varying impacts on decision-making. Financial and time constraints typically create the most significant barriers to action, while location constraints often have less impact in our increasingly digital world.
Integration: Creating Multi-Dimensional Audience Personas
The true power of this framework emerges when we integrate all three dimensions into comprehensive visual personas. I've developed techniques for layering success, happiness, and freedom indicators to create nuanced audience profiles that drive more effective communication strategies.
When I create these multi-dimensional personas, I'm particularly interested in mapping contradictions and alignments between dimensions. For example, an audience segment might prioritize financial success but also value creative freedom—potentially conflicting desires that require careful messaging.

Visualizing Data Patterns Across Dimensions
Dimension Alignment by Audience Segment
This bubble chart visualizes how different audience segments align across the success-happiness spectrum, with the bubble size indicating the importance of freedom. I find this particularly useful for identifying segments with similar motivational patterns.
Case Study: Transforming Abstract Data into Strategic Assets
In a recent project, I transformed complex audience survey data into a visual framework that revealed unexpected patterns. By mapping success indicators against happiness metrics, we discovered that our core audience valued personal growth experiences far more than material achievements—a crucial insight that completely reshaped the client's presentation success strategy.
Implementation: From Analysis to Visual Strategy
The true value of any framework lies in its practical application. I've developed methods for translating insights from the Success-Happiness-Freedom framework into actionable content planning and design decisions.
When implementing this framework, I focus on creating visual content that addresses all three dimensions simultaneously. This integrated approach ensures that our messaging resonates on multiple levels, creating deeper connections with our audience.
Framework Implementation Workflow
flowchart TD
    A[Data Collection] --> B[Dimension Mapping]
    B --> C[Pattern Identification]
    C --> D[Visual Persona Creation]
    D --> E[Content Strategy Development]
    E --> F[Visual Asset Creation]
    F --> G[Implementation]
    G --> H[Measurement]
    H --> I{Effective?}
    I -->|Yes| J[Optimization]
    I -->|No| K[Refinement]
    J --> G
    K --> D
This workflow illustrates my process for implementing the framework. I start with data collection, then map audience characteristics across the three dimensions before identifying patterns and creating visual personas. These personas then drive content strategy and visual asset creation.
Measuring Framework Effectiveness
Performance Metrics Before and After Framework Implementation
The data clearly demonstrates the impact of implementing the Success-Happiness-Freedom framework. In my experience, clients consistently see significant improvements across all key performance indicators, with particularly notable gains in engagement rate and time on page.
Advanced Applications and Future Developments
As I continue to refine this framework, I'm exploring advanced applications that push the boundaries of audience analysis. One particularly exciting area is using the framework for predictive audience behavior modeling.
By applying machine learning to identify pattern recognition across the success, happiness, and freedom dimensions, we can develop increasingly sophisticated models that predict audience responses to different types of content and messaging.

Interactive Visualizations for Real-Time Analysis
One of the most promising developments I'm working on is creating interactive visualizations that allow for real-time audience analysis. These tools enable marketers and content creators to dynamically adjust their strategies based on immediate audience feedback.
Cross-Cultural Applications
I'm also exploring how the Success-Happiness-Freedom framework can be adapted across different cultural contexts. Initial research suggests that while the core dimensions remain relevant, their relative importance and specific manifestations vary significantly across cultures.
Dimensional Importance Across Cultures
This radar chart illustrates how different cultural contexts prioritize various dimensions. Understanding these variations is crucial for adapting the framework to global audiences.
Neurological Research
Perhaps the most fascinating frontier is exploring the neurological responses to visuals across the three dimensions. Emerging research suggests that specific visual patterns trigger predictable neural responses related to success perception, happiness, and freedom evaluation.
Transform Your Audience Analysis with PageOn.ai
Ready to implement the Success-Happiness-Freedom framework for your audience? PageOn.ai provides powerful visualization tools to bring your audience insights to life.
Start Creating with PageOn.ai TodayThe Future of Visual Audience Analysis
As I look to the future, I'm convinced that the Success-Happiness-Freedom framework represents just the beginning of a revolution in audience analysis. By visualizing these core human motivators, we gain unprecedented insight into what drives decision-making and engagement.
The most successful brands and marketers will be those who embrace these multi-dimensional approaches to understanding their audiences. By moving beyond demographics and surface-level behaviors to explore the deeper dimensions of human motivation, we can create more meaningful connections and more effective communication strategies.
I encourage you to begin implementing this framework in your own audience analysis. Start by mapping your existing audience data across the three dimensions, look for patterns and connections, and use these insights to inform your visual content strategy. The results may surprise you—and transform your approach to audience engagement.
You Might Also Like
PowerPoint Compatibility Solutions: Cross-Version Presentation Success Guide
Discover effective solutions for PowerPoint compatibility issues across versions. Learn to preserve animations, formatting, and graphics while ensuring seamless cross-platform presentation success.
Mastering Dynamic Aspect Ratios in Modern Presentations | PageOn.ai
Discover how dynamic aspect ratio technology transforms presentation impact across devices and platforms. Learn implementation techniques, design principles, and future trends with PageOn.ai.
Transforming IT Support: Visual AI Solutions for Employee Help Desk Without the Wait
Discover how visual AI transforms traditional IT help desks into efficient support systems that eliminate wait times and boost productivity with interactive visual troubleshooting solutions.
Creating Impactful Cultural Presentations: AI-Driven Visual Storytelling for Cultural Expression
Discover how to create authentic cultural presentations using AI-driven visual storytelling techniques. Learn to transform cultural concepts into engaging visual narratives with PageOn.ai.
