TradingView Data Export Methods for AI Processing
Transform raw financial data into actionable market insights with advanced AI techniques
Introduction to TradingView Data for AI Analysis
In today's data-driven trading landscape, the intersection between quality financial data and artificial intelligence has become increasingly important. I've found that having access to clean, structured market data is the foundation of any successful AI-driven trading strategy. TradingView has emerged as one of the premier platforms for traders seeking comprehensive market data that can fuel sophisticated algorithmic trading systems.
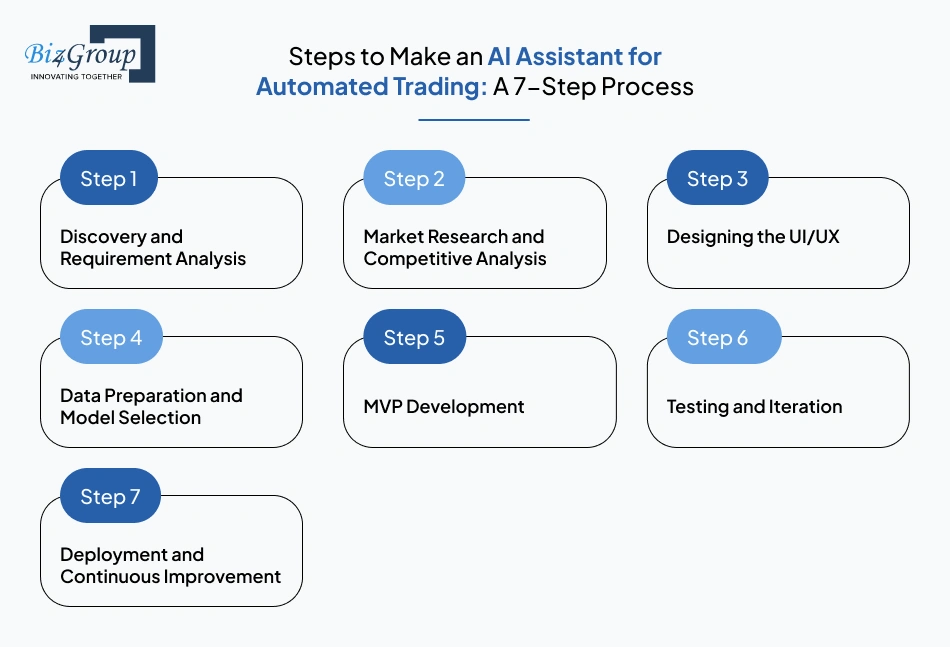
The workflow connecting TradingView data exports to AI processing pipelines
What makes TradingView particularly valuable for AI analysis is its combination of extensive historical data, real-time updates, and technical indicators. As machine learning techniques continue to evolve, we're seeing a growing convergence between traditional technical analysis methods and advanced AI applications. Traders who can effectively bridge these worlds gain a significant competitive advantage in the markets.
Throughout this guide, I'll walk you through the various methods for exporting data from TradingView and transforming it into formats suitable for AI processing. Whether you're building predictive models, pattern recognition systems, or algorithmic trading strategies, understanding how to efficiently extract and process TradingView data is essential for success.
Native TradingView Export Methods
TradingView offers several built-in methods for exporting data directly from their platform. These native export options provide a straightforward way to access the financial data you need without requiring additional programming knowledge.
Standard Chart Data Export
The most basic method for extracting data from TradingView is using the standard chart data export feature. This approach allows you to download the exact data visible on your chart, including price information and any indicators you've added.

TradingView's chart data export interface showing export options
To access this feature, I follow these steps:
- Open the TradingView chart containing the data I want to export
- Click on the dropdown menu in the upper toolbar
- Select "Export chart data..." from the options
- Choose the specific chart and click "Export"
One important limitation to note is that this method only exports the data currently visible on your chart. If you need more historical data, you'll need to scroll the chart left or drag the x-axis to load additional data before exporting. The resulting CSV file contains timestamped price data and any indicators you've applied to the chart.
Pro Tip: When exporting chart data for AI processing, ensure your chart timeframe matches the granularity needed for your models. For instance, if you're building a day trading algorithm, you might want to export 5-minute or 15-minute bars rather than daily data.
Strategy Tester Data Export
If you've created trading strategies using TradingView's Pine Script, you can export the backtest results through the Strategy Tester panel. This provides valuable data for training AI models to recognize successful trading patterns.
flowchart TD
    A[Strategy Tester] --> B{Export Type}
    B -->|List of Trades| C[Trade Details CSV]
    B -->|Performance Summary| D[Metrics CSV]
    C --> E[AI Model Training]
    D --> E
    E --> F[Strategy Optimization]
Flow of strategy data from TradingView to AI processing
The Strategy Tester export provides two distinct types of data:
- List of Trades: Detailed information about each individual trade executed during the backtest, including entry/exit prices, dates, and profit/loss metrics.
- Performance Summary: Aggregated performance metrics such as win rate, profit factor, maximum drawdown, and other statistical measures of strategy performance.
This data is particularly valuable for supervised learning approaches where you want to train models to recognize profitable trading setups or optimize existing strategies.
Trading Account History Export
For traders using TradingView's broker integration features, there's an option to export your actual trading history. This provides a wealth of real-world data that can be used to analyze your trading performance and train personalized AI models.
To export your trading history:
- Click on your broker's name in the bottom panel of TradingView
- Select "Export data..." from the dropdown menu
- Choose "Account History" from the options
- Click "Export" to download the CSV file
This data can be particularly valuable for creating AI models that learn from your personal trading patterns, helping to identify strengths and weaknesses in your approach. By analyzing this historical data, you can develop models that suggest improvements to your trading strategy based on your actual performance.
Python-Based Extraction Methods
While TradingView's native export options are convenient, more advanced users often require programmatic access to data for automated systems and complex AI models. Python-based extraction methods offer greater flexibility and control over the data acquisition process.
Using TVDataFeed Library
TVDataFeed is an unofficial Python library that allows programmatic access to TradingView's market data. It provides a powerful way to retrieve historical and real-time data for use in custom AI applications.
pip install --upgrade tvdatafeed
from tvdatafeed import TvDatafeed, Interval
username = 'YourTradingViewUsername'
password = 'YourTradingViewPassword'
tv = TvDatafeed(username, password)
data = tv.get_hist(
    symbol='AAPL',
    exchange='NASDAQ',
    interval=Interval.in_daily,
    n_bars=1000
)
print(data.head())
The TVDataFeed library requires authentication with your TradingView credentials and allows you to specify parameters such as:
- Symbol and exchange
- Time interval (from 1-minute to monthly bars)
- Number of historical bars to retrieve
- Extended hours data (for applicable markets)
Comparison of data volume across different time intervals
When working with TVDataFeed, I've found that proper error handling is essential, as connection issues or rate limiting can interrupt data retrieval. Implementing robust exception handling and retry mechanisms ensures consistent data collection for AI processing pipelines.
Data Transformation for AI Processing
Once you've extracted raw data from TradingView, it typically requires transformation before it can be used effectively in AI models. This process involves converting the data to appropriate formats and engineering features that capture meaningful patterns.
flowchart TD
    A[Raw TradingView Data] --> B[Data Cleaning]
    B --> C[Feature Engineering]
    C --> D[Normalization]
    D --> E{Split Data}
    E --> F[Training Set]
    E --> G[Validation Set]
    E --> H[Testing Set]
    F --> I[AI Model Training]
    G --> J[Model Validation]
    H --> K[Performance Evaluation]
Typical data transformation pipeline for AI model development
Key steps in the transformation process include:
import pandas as pd
import numpy as np
data['SMA20'] = data['close'].rolling(window=20).mean()
data['SMA50'] = data['close'].rolling(window=50).mean()
data['returns'] = data['close'].pct_change()
data['volatility'] = data['returns'].rolling(window=20).std()
data['price_direction'] = np.where(data['close'].shift(-1) > data['close'], 1, 0)
from sklearn.preprocessing import MinMaxScaler
scaler = MinMaxScaler()
feature_columns = ['close', 'volume', 'SMA20', 'SMA50', 'volatility']
data[feature_columns] = scaler.fit_transform(data[feature_columns])
data = data.dropna()
train_size = int(len(data) * 0.8)
train_data = data[:train_size]
test_data = data[train_size:]
Feature engineering is particularly important for financial data, as raw price information often doesn't provide enough context for AI models to identify meaningful patterns. By calculating technical indicators, volatility measures, and other derived features, we create a richer representation of the market state.
Advanced Export Options with Python
Beyond basic data extraction, Python allows for more sophisticated approaches to gathering and organizing TradingView data:
- Automated Scheduling: Using libraries like
scheduleorairflowto regularly update datasets with the latest market information. - Multi-Symbol Collection: Creating consolidated datasets that include multiple related instruments for cross-asset analysis.
- Indicator Extraction: Calculating additional technical indicators not directly available in the standard export.
For AI applications, I often create specialized data formats tailored to specific frameworks. For example, time-series data for LSTM models requires different organization than data for reinforcement learning environments.
Advanced Tip: When working with business intelligence AI applications, consider creating a data pipeline that combines TradingView technical data with fundamental data from other sources for a more comprehensive market view.
Building AI Processing Pipelines for TradingView Data
Once you've established reliable methods for exporting TradingView data, the next step is building efficient AI processing pipelines. These pipelines transform raw market data into actionable insights through machine learning models and visualization tools.
Structuring Data for Different AI Applications
Different AI techniques require specific data structures to perform effectively. Here's how I typically prepare TradingView data for various applications:
| AI Technique | Data Structure | Key Considerations |
|---|---|---|
| Time-series Forecasting (LSTM/Transformers) | 3D tensors with shape [samples, time steps, features] | Requires consistent time intervals; lookback window sizing is crucial |
| Pattern Recognition (CNNs) | 2D image-like representations of price movements | Often converts OHLC data to candlestick images or other visual representations |
| Reinforcement Learning | Environment state representations with action/reward frameworks | Requires careful design of state space, action space, and reward functions |
| Sentiment Analysis Integration | Merged datasets with price data and text-derived sentiment scores | Temporal alignment between market data and sentiment data is critical |
For time-series forecasting, which is common in market prediction tasks, I typically structure the data as sequences with a fixed lookback period. This allows models like LSTMs to learn temporal patterns in the market data.
def create_sequences(data, seq_length):
    xs, ys = [], []
    for i in range(len(data) - seq_length - 1):
        x = data[i:(i + seq_length)]
        y = data[i + seq_length, 0]  # Predicting the close price
        xs.append(x)
        ys.append(y)
    return np.array(xs), np.array(ys)
seq_length = 60
X, y = create_sequences(scaled_data, seq_length)
X = X.reshape(X.shape[0], X.shape[1], X.shape[2])
Visualizing TradingView Data with PageOn.ai
One of the challenges with AI-driven trading systems is interpreting and communicating the insights they generate. PageOn.ai provides powerful tools for transforming complex financial datasets and AI outputs into intuitive visual representations.
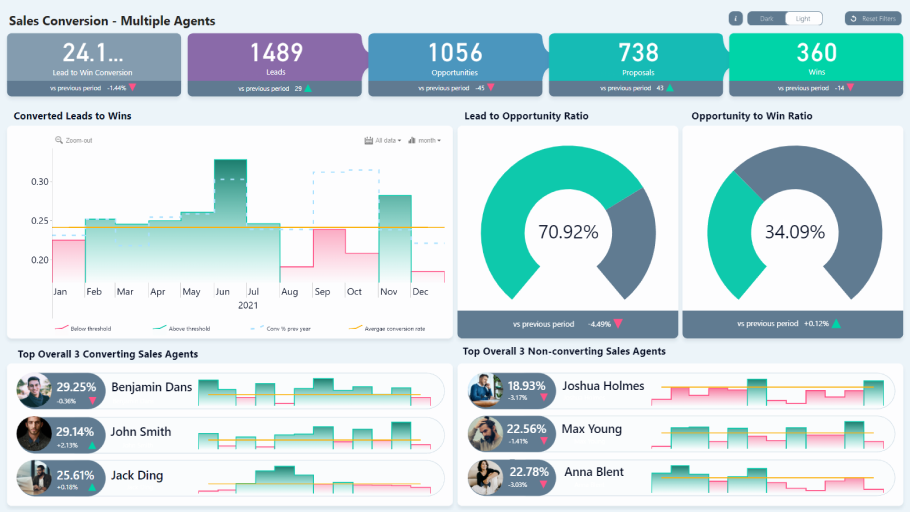
Interactive financial dashboard created with PageOn.ai visualizing TradingView data and AI predictions
With PageOn.ai's AI Blocks feature, I can create modular visualization components that update automatically as new data is processed. This is particularly valuable for monitoring AI trading systems in real-time and communicating complex patterns to stakeholders who may not have technical backgrounds.
The Deep Search capability also allows me to automatically find relevant market context that might affect my trading strategies, integrating news, sentiment, and other alternative data sources with the technical data from TradingView.
Visualization Tip: When creating dashboards for trading data, use AI stock charting tools to automatically highlight significant patterns and anomalies detected by your models, making it easier to spot trading opportunities at a glance.
Data Storage and Management Considerations
Effective AI processing pipelines require thoughtful data management strategies, especially when dealing with large volumes of financial data from TradingView.
flowchart TD
    A[TradingView Data] --> B[Data Storage]
    B --> C[Time-Series Database]
    B --> D[Document Database]
    B --> E[Data Lake]
    C --> F[Real-time Processing]
    D --> G[Metadata & Context]
    E --> H[Long-term Storage]
    F --> I[Live Trading Models]
    G --> J[Research & Analysis]
    H --> K[Historical Backtesting]
Data storage architecture for financial AI applications
Key considerations for data storage and management include:
- Database Selection: Time-series databases like InfluxDB or TimescaleDB are optimized for financial data workloads.
- Version Control: Implementing dataset versioning ensures reproducibility in model training and evaluation.
- Real-time vs. Historical: Different storage strategies may be appropriate depending on whether you're processing historical backtests or live trading data.
- Compliance: Financial data often has regulatory requirements regarding storage and access that must be considered.
For production AI systems, I typically implement a multi-tiered storage approach with hot storage for recent data that needs fast access and cold storage for historical archives used in periodic retraining.
Case Studies: AI Applications with TradingView Data
To illustrate the practical applications of TradingView data in AI systems, let's explore several real-world case studies that demonstrate different approaches and techniques.
Market Pattern Detection System
One of the most powerful applications of AI with TradingView data is automated pattern recognition. By training models to identify technical patterns with statistical significance, traders can systematically find opportunities across multiple markets simultaneously.
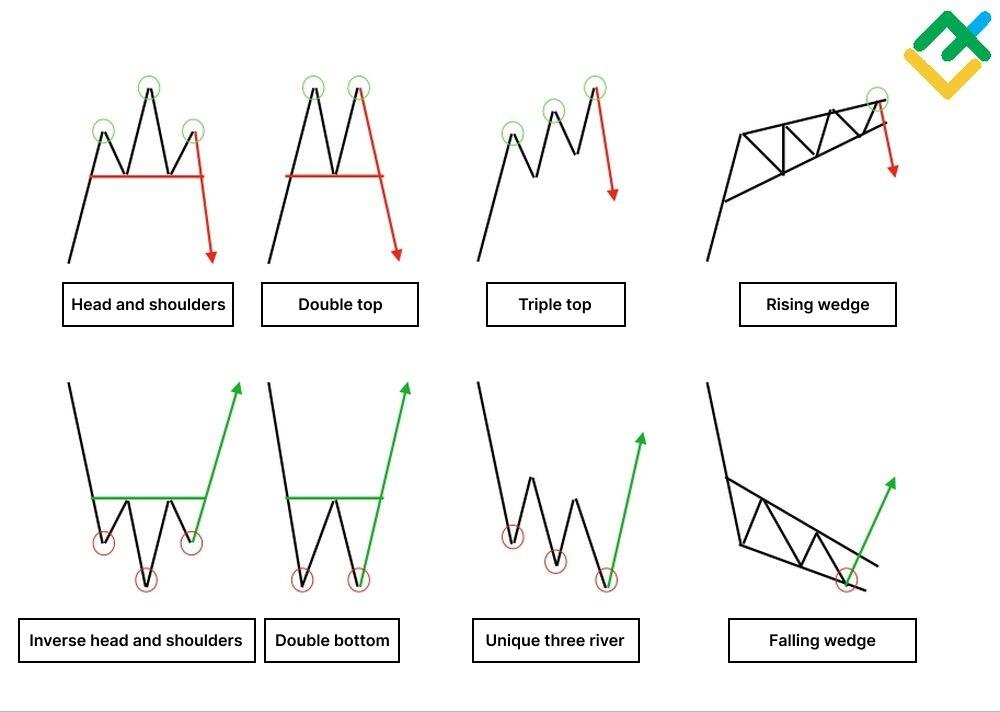
AI-detected chart patterns with statistical confidence scores
In this case study, I exported candlestick data from TradingView for 50 different stocks over a 5-year period. After preprocessing the data, I trained a convolutional neural network to recognize classical chart patterns like head and shoulders, double tops, and flag patterns.
The key steps in this implementation included:
- Converting OHLC data to image-like representations
- Creating a labeled dataset with examples of confirmed patterns
- Training a CNN model to classify and locate patterns
- Implementing a confidence scoring system based on historical pattern performance
- Visualizing detected patterns using PageOn.ai's interactive charts
The results showed that the AI system could detect patterns with accuracy comparable to experienced traders, but with the ability to scan thousands of charts continuously without fatigue.
Algorithmic Trading Strategy Development
Another compelling application is using TradingView data to train reinforcement learning agents that can develop and optimize trading strategies autonomously.
Performance comparison between RL-trained strategy and market benchmark
In this case study, I used historical data exports from TradingView to create a training environment for a deep reinforcement learning agent. The agent learned to make trading decisions based on market state representations derived from price data and technical indicators.
The implementation process involved:
- Defining a market state representation using price and indicator data
- Creating an action space for trading decisions (buy, sell, hold)
- Designing a reward function that balanced returns against risk
- Training the agent using deep Q-learning across multiple market scenarios
- Validating the strategy through out-of-sample testing
The reinforcement learning approach proved particularly effective at adapting to changing market conditions, as it could learn from both successful and unsuccessful trades to continuously improve its decision-making process.
Market Anomaly Detection
Unsupervised learning techniques can be applied to TradingView data to identify unusual market conditions that may represent trading opportunities or risks.
In this case study, I implemented an autoencoder neural network that learned the normal patterns in market data. By measuring reconstruction error, the system could identify when current market conditions deviated significantly from historical norms.
flowchart TD
    A[Market Data Input] --> B[Autoencoder Model]
    B --> C[Reconstruction]
    A --> D{Compare}
    C --> D
    D --> E[Calculate Error]
    E --> F{Error > Threshold?}
    F -->|Yes| G[Flag Anomaly]
    F -->|No| H[Normal Conditions]
    G --> I[Generate Alert]
    I --> J[Visualize with PageOn.ai]
Anomaly detection workflow using autoencoder reconstruction error
This approach proved valuable for risk management, as it could detect regime changes and market dislocations before they became obvious in traditional indicators. When combined with PageOn.ai's visualization capabilities, these anomalies could be presented in an intuitive dashboard that highlighted potential areas of concern.
Implementation Insight: For financial anomaly detection systems, consider using generate excel reports with ai tools to automatically document detected anomalies with supporting data for compliance and analysis purposes.
Best Practices and Optimization Techniques
Developing effective AI systems with TradingView data requires attention to several key best practices that ensure data quality, processing efficiency, and integration capabilities.
Data Quality Assurance
The accuracy of AI predictions is directly tied to the quality of the input data. When working with TradingView exports, I've developed several techniques to ensure data integrity:
Data quality metrics before and after quality assurance processing
- Handling Missing Data: Market data often contains gaps due to trading halts, holidays, or technical issues. I use interpolation methods specific to financial time series to fill these gaps without introducing bias.
- Detecting Anomalies: Automated checks can identify potential data errors such as price spikes, zero volume, or other implausible values that could skew AI model training.
- Validating Data Consistency: Cross-referencing data across different timeframes and sources helps ensure consistency and accuracy.
Implementing a comprehensive data validation pipeline as the first step in your processing workflow can save countless hours of debugging and prevent models from learning from faulty data.
Performance Optimization
Working with large financial datasets requires attention to performance optimization to ensure efficient processing:
- Efficient Storage Formats: Using optimized formats like Parquet or HDF5 instead of CSV for large datasets can significantly improve I/O performance.
- Batch Processing: When working with historical data, processing in batches reduces memory requirements and allows for parallel computation.
- Incremental Updates: For ongoing data collection, implementing delta updates rather than full reprocessing keeps computational requirements manageable.
import dask.dataframe as dd
dask_df = dd.read_csv('large_tradingview_export.csv',
                      parse_dates=['datetime'])
results = dask_df.groupby(dask_df.datetime.dt.date).agg({
    'high': 'max',
    'low': 'min',
    'volume': 'sum'
}).compute()
results.to_parquet('processed_results.parquet')
For real-time processing systems, optimizing the pipeline to minimize latency is crucial. This may involve stream processing architectures that can handle data as it arrives rather than batch processing at fixed intervals.
Integration with Other Data Sources
While TradingView provides excellent technical data, the most powerful AI systems often combine this with other complementary data sources:
flowchart TD
    A[TradingView Technical Data] --> E[Unified Data Model]
    B[Fundamental Data] --> E
    C[Alternative Data] --> E
    D[Sentiment Analysis] --> E
    E --> F[Feature Engineering]
    F --> G[AI Model Training]
    G --> H[Prediction & Insights]
    H --> I[PageOn.ai Visualization]
Integrated data pipeline combining multiple sources with TradingView data
Some valuable data integration approaches include:
- Fundamental Data: Combining price-based technical data with company fundamentals provides a more complete view of assets.
- Alternative Data: Satellite imagery, social media sentiment, and other non-traditional data sources can provide leading indicators for market movements.
- News and Events: Integrating news feeds with technical data helps models understand the context behind price movements.
PageOn.ai's Deep Search capabilities are particularly valuable here, as they can automatically find and integrate relevant contextual information from diverse sources, enriching the TradingView technical data with broader market intelligence.
Integration Tip: When combining multiple data sources, use ai tools for excel charts to quickly prototype visualizations that show correlations between different data types before building more complex integrated models.
Future Trends and Developments
The landscape of financial data analysis and AI is evolving rapidly. Here are some emerging trends that will likely shape how we work with TradingView data in the coming years.
Emerging AI Techniques for Financial Data Analysis
Several cutting-edge AI approaches are showing particular promise for financial market analysis:
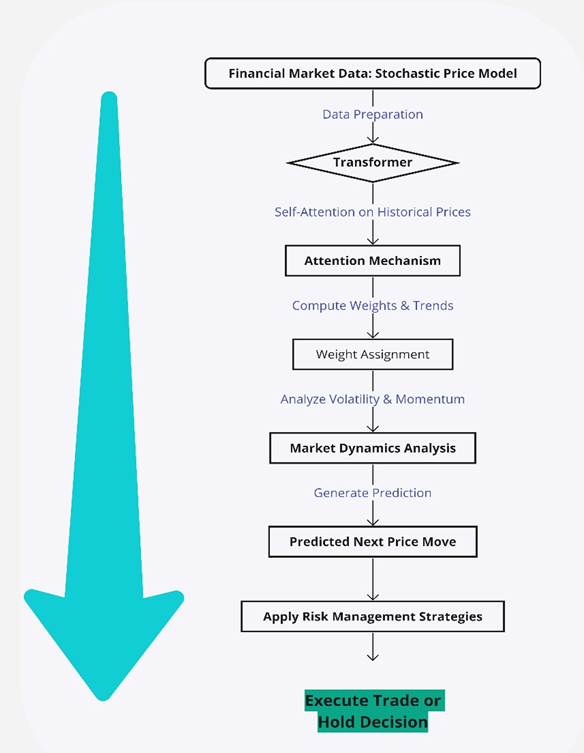
Transformer model architecture adapted for financial time series prediction
- Transformer Models: Originally developed for natural language processing, transformer architectures are now being adapted for time-series financial data with promising results. Their ability to capture long-range dependencies makes them well-suited for identifying complex market patterns.
- Explainable AI: As regulatory scrutiny increases, there's growing emphasis on models that can not only make predictions but also explain the reasoning behind their decisions. Techniques like SHAP (SHapley Additive exPlanations) values are becoming essential for financial applications.
- Federated Learning: This approach allows models to be trained across multiple decentralized datasets without sharing the raw data. It opens possibilities for collaborative model development while preserving data privacy and proprietary information.
These advanced techniques are enabling more sophisticated analysis of TradingView data, uncovering subtler patterns and relationships that were previously difficult to detect.
Evolving TradingView Export Capabilities
The ecosystem around TradingView data access continues to develop, with several noteworthy trends:
- API Developments: While TradingView's official API offerings remain limited, the community continues to develop unofficial tools and libraries that enhance data extraction capabilities.
- Enhanced Data Formats: Newer export formats are emerging that better preserve the richness of TradingView's visual and technical indicators.
- Integration Platforms: Third-party services are creating bridges between TradingView and other analytics platforms, making it easier to incorporate TradingView data into broader analysis workflows.
Staying current with these developments ensures you can leverage the most efficient methods for extracting and processing TradingView data as they emerge.
Creating a Sustainable AI Trading Development Workflow
As AI trading systems become more sophisticated, developing sustainable workflows becomes increasingly important:
flowchart TD
    A[Data Collection] --> B[Version Control]
    B --> C[Feature Engineering]
    C --> D[Model Training]
    D --> E[Validation]
    E --> F{Performance?}
    F -->|Acceptable| G[Deployment]
    F -->|Needs Improvement| C
    G --> H[Monitoring]
    H --> I{Market Shift?}
    I -->|Yes| J[Model Retraining]
    J --> D
    I -->|No| H
Sustainable AI trading system development workflow
Key elements of a sustainable workflow include:
- Balancing Automation with Oversight: While automation is powerful, human oversight remains essential, particularly for detecting regime changes or unusual market conditions that may require model adjustments.
- Continuous Learning: Markets evolve constantly, requiring adaptive models that can update their understanding as new data becomes available. Implementing systems for continuous learning and model adaptation is critical for long-term success.
- Visualization for Clarity: As models become more complex, clear visualization of their insights becomes increasingly important. Tools like PageOn.ai help transform complex AI outputs into clear, actionable visualizations that support decision-making.
By focusing on these aspects of sustainable development, traders and analysts can build AI systems that remain effective and relevant as markets evolve over time.
Strategic Approach: Successful ai implementation in trading requires a balanced approach that combines technological sophistication with practical trading knowledge and clear visualization of insights.
Transform Your Trading Data with PageOn.ai
Turn complex TradingView data into clear, actionable visualizations that reveal hidden patterns and market opportunities.
Start Creating Powerful VisualizationsYou Might Also Like
Achieving Visual Balance in Educational Interface Design | Expert Guide
Discover how to create harmonious educational interfaces through visual balance principles. Learn spatial organization, color dynamics, and typography techniques to enhance learning experiences.
The Power of Three: Designing Intuitive User Experiences That Convert
Discover why three-step processes create perfect user experiences. Learn the psychological principles, implementation strategies, and future trends of the rule of three in UX design.
Mastering Element Alignment for Professional Learning Layouts | Visual Design Guide
Learn how to create visually engaging professional learning materials through strategic element alignment techniques that enhance information retention and learner engagement.
Creating Dynamic Picture Backgrounds in PowerPoint: Transform Your Presentations
Learn how to create stunning dynamic picture backgrounds in PowerPoint presentations to boost engagement, improve retention, and enhance visual appeal with step-by-step techniques.