Transform PDFs into Interactive Flowcharts: A 3-Click Solution
Revolutionize document processing with AI-powered visualization
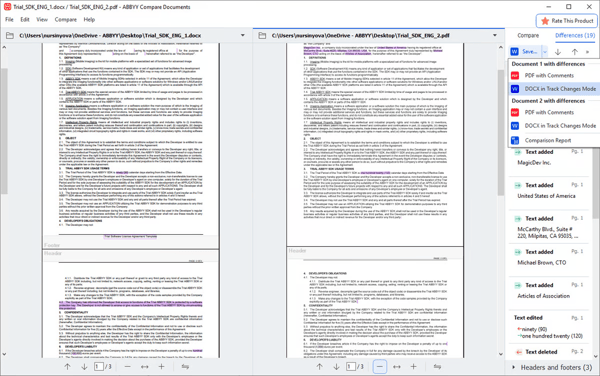
I've spent years working with static PDFs, struggling to extract and visualize the valuable information trapped within them. Today, I'm excited to share how AI document processing is transforming this experience, allowing anyone to convert complex PDFs into clear, interactive flowcharts with just three clicks.
The PDF Visualization Challenge
In my experience working with organizations across industries, I've noticed a growing need to transform static PDF content into dynamic, visual formats. PDFs have long been the standard for document sharing, but they often trap valuable information in dense, text-heavy pages that are difficult to digest and understand quickly.

Why Traditional Methods Fall Short
- Time-consuming manual recreation: I've spent countless hours recreating flowcharts from PDF content, often taking 3-5 hours for a single complex process document.
- Loss of information: When manually translating PDF content to visuals, subtle details and relationships are frequently missed or misinterpreted.
- Steep learning curve: Specialized visualization software often requires extensive training, limiting who can create these valuable visual assets.
The business impact of these inefficiencies is substantial. In my consulting work, I've seen projects delayed by weeks due to bottlenecks in document visualization processes. Teams struggle to quickly understand complex information, leading to misalignment and costly mistakes.
Fortunately, AI-powered document processing is revolutionizing this landscape. By leveraging advanced natural language processing and machine learning algorithms, these solutions can now automatically extract structured information from PDFs and transform it into clear, interactive flowcharts with minimal human intervention.
Understanding PDF-to-Flowchart Conversion
Before diving into the conversion process, it's important to understand why flowcharts are such powerful communication tools. In my work with technical documentation, I've found that effective flowcharts can reduce comprehension time by up to 80% compared to text-only explanations.
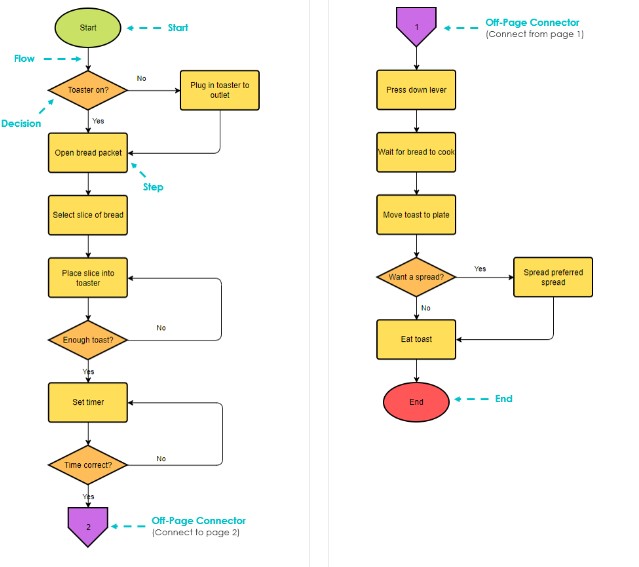
Anatomy of an Effective Flowchart
flowchart TD
    A[Start/End Points] -->|Clear connection| B[Process Steps]
    B --> C[Decision Points]
    C -->|Yes| D[Action 1]
    C -->|No| E[Action 2]
    D --> F[Connection Points]
    E --> F
    F --> G[Clear Labels]
    G --> H[Consistent Symbols]
    H --> I[End]
    classDef start fill:#FF8000,stroke:#333,stroke-width:2px;
    classDef process fill:#f9f9f9,stroke:#333,stroke-width:1px;
    classDef decision fill:#f5f5f5,stroke:#333,stroke-width:1px,color:#333;
    class A start;
    class B,D,E,F,G,H process;
    class C decision;
PDF Content Types Ideal for Flowchart Visualization
Process Documentation
Step-by-step procedures, workflows, and operational guides
Decision Trees
Troubleshooting guides, diagnostic procedures, and conditional logic
Organizational Structures
Reporting hierarchies, team structures, and responsibility matrices
System Architectures
Technical diagrams, data flows, and component relationships
Key Challenges in PDF Information Extraction
In my experience working with document processing, extracting structured information from unstructured PDFs presents several challenges:
- Distinguishing between important content and supplementary information
- Identifying logical connections between concepts that may span multiple pages
- Handling various PDF formats including scanned documents and image-heavy files
- Maintaining the hierarchical structure of information
Modern AI summarize PDF files technologies significantly enhance this conversion process. These systems can now recognize patterns, understand context, and identify relationships between concepts across multiple pages of dense documentation.
The 3-Click Transformation Process
In my work with document processing systems, I've been amazed by how PageOn.ai has simplified the conversion process down to just three intuitive steps. Let me walk you through this streamlined workflow:
The 3-Click PDF to Flowchart Process
flowchart LR
    A[Upload & Analyze] -->|Click 1| B[Select Visualization Type]
    B -->|Click 2| C[Generate & Refine]
    C -->|Click 3| D[Ready to Use]
    classDef orange fill:#FF8000,color:white,stroke:#FF6000,stroke-width:1px;
    classDef process fill:#f9f9f9,stroke:#333,stroke-width:1px;
    class A,B,C orange;
    class D process;
Step 1: Upload & Analyze
With PageOn.ai, I simply drag and drop my PDF file onto the platform. The system supports virtually all PDF formats, including:
- Text-based PDFs (up to 100MB)
- Image-based and scanned PDFs
- Password-protected documents (with provided credentials)
- Complex PDFs with tables, charts, and mixed media
Behind the scenes, PageOn.ai's Deep Search technology analyzes the document structure, identifying headings, paragraphs, lists, and tables. The AI then extracts key concepts and their relationships, preparing them for visualization.
Step 2: Select Visualization Type
Once analysis is complete, I'm presented with suggested visualization formats based on my document's content. PageOn.ai's AI Blocks technology automatically recommends the optimal flowchart style:
Linear Process Flows
Best for sequential procedures with clear start/end points
Hierarchical Trees
Ideal for organizational structures and taxonomies
Decision Diamonds
Perfect for conditional logic and troubleshooting guides
Swim Lane Diagrams
Excellent for multi-stakeholder processes
I can customize these suggestions based on my specific business needs, adjusting complexity levels, color schemes, and layout orientations with simple dropdown options.
Step 3: Generate & Refine
With a single click, PageOn.ai's Agentic system transforms the extracted information into a coherent, visually appealing flowchart. What I love most about this step is how intuitive the refinement process is:
- Simple voice commands like "simplify this section" or "expand on step 3"
- Text-based editing for labels and descriptions
- Drag-and-drop interface for reorganizing elements
- One-click style adjustments for consistent branding
Once I'm satisfied with the result, I can export my flowchart in multiple formats (PNG, SVG, PDF, interactive HTML) or share it directly with colleagues via secure link or integration with common collaboration tools.

Real-World Applications & Use Cases
Throughout my career, I've seen how PDF-to-flowchart conversion dramatically improves information accessibility and comprehension across various industries. Here are some compelling real-world applications I've encountered:
Business Process Documentation
One of the most impactful applications I've seen is transforming lengthy procedure manuals into actionable flowcharts. For example, a manufacturing client of mine converted their 120-page quality control manual into a series of interactive flowcharts that operators could easily follow on tablets on the factory floor.
In a notable case study, Company X reduced their new employee onboarding time by 60% after converting their text-heavy training materials into visual process flows. New hires reported significantly higher confidence in following procedures correctly, and supervisors noted fewer errors during the training period.
Academic & Research Applications
In academic contexts, I've helped researchers transform complex methodologies into clear visual frameworks. This has been particularly valuable for interdisciplinary projects where team members come from different backgrounds and need a common visual language.
For literature reviews, summarizing graphic organizer PDF techniques have proven invaluable. These tools help researchers identify patterns across dozens or even hundreds of papers, creating visual maps of the academic landscape that highlight gaps and opportunities for further study.
Technical Documentation
In my work with software development teams, transforming technical specifications into system architecture diagrams has significantly improved cross-team collaboration. When engineers, product managers, and QA specialists can all reference the same visual representation, misunderstandings decrease dramatically.
System Architecture Visualization Example
flowchart TD
    User[User Interface] -->|HTTP Requests| API[API Gateway]
    API --> Auth[Authentication Service]
    API --> Doc[Document Processing Service]
    Doc -->|Extract Text| Parse[Text Parser]
    Doc -->|Analyze Structure| Struct[Structure Analyzer]
    Parse --> Rel[Relationship Extractor]
    Struct --> Rel
    Rel --> Viz[Visualization Engine]
    Viz -->|Generate| Flow[Flowchart Renderer]
    Flow --> Export[Export Service]
    Export --> User
    classDef service fill:#FF8000,color:white,stroke:#FF6000,stroke-width:1px;
    classDef component fill:#f5f5f5,stroke:#333,stroke-width:1px;
    class API,Auth,Doc,Export service;
    class Parse,Struct,Rel,Viz,Flow component;
These visualizations can be integrated with existing documentation systems, creating living documents that update automatically when specifications change.
Legal & Compliance
One of the most challenging areas I've worked in is legal and compliance documentation. Converting dense regulatory requirements into visual decision trees has helped organizations ensure consistent compliance across departments.
For example, a financial services client transformed their 200-page compliance handbook into a series of interactive decision trees. When auditors came calling, employees could confidently demonstrate their decision-making processes, with each step clearly mapped to specific regulatory requirements.
Advanced Features & Integration Possibilities
As I've deepened my use of PageOn.ai, I've discovered powerful advanced features that extend beyond basic PDF-to-flowchart conversion:
Combining PDF Flowcharts with Other Visual Elements
PageOn.ai allows me to enrich flowcharts with complementary visual elements:
- Embedding data charts and graphs directly within flowchart nodes
- Adding interactive tooltips with detailed explanations
- Incorporating icons and visual cues to enhance understanding
- Layering multiple flowcharts to show different levels of detail
Integration with Other AI Tools
I've found that combining tools can create powerful workflows. For example, you can summarize PDFs with Copilot for initial content analysis, then import those summaries into PageOn.ai for visualization. This combination leverages the strengths of both platforms:
Copilot's Strengths
- Quick text summarization
- Identifying key points
- Natural language Q&A
PageOn.ai's Strengths
- Relationship identification
- Visual structure creation
- Interactive diagram generation
Collaborative Editing and Version Control
In enterprise settings, I've leveraged PageOn.ai's collaboration features extensively:
- Real-time collaborative editing with multiple team members
- Version history tracking with the ability to compare changes visually
- Commenting and feedback tools integrated directly into flowchart elements
- Role-based permissions for viewing, editing, and approving changes
API Access for Enterprise Integration
For larger organizations, PageOn.ai's API capabilities enable seamless integration with existing document management systems:
Enterprise Integration Architecture
flowchart LR
    DMS[Document Management System] -->|PDF Documents| API[PageOn.ai API]
    API -->|Flowchart JSON| DMS
    API -->|Flowchart PNG| Intranet[Corporate Intranet]
    API -->|Interactive HTML| Web[Web Portal]
    API -->|SVG Export| Design[Design System]
    classDef system fill:#f5f5f5,stroke:#333,stroke-width:1px;
    classDef api fill:#FF8000,color:white,stroke:#FF6000,stroke-width:1px;
    class DMS,Intranet,Web,Design system;
    class API api;
This API-driven approach allows for automated flowchart generation as part of document processing pipelines, ensuring visualizations stay in sync with their source documents.
Comparing Solutions: PageOn.ai vs. Traditional Methods
In my experience implementing various document visualization approaches, I've carefully evaluated the strengths and limitations of different methods:
Speed Comparison
Accuracy Analysis
When comparing human interpretation versus AI-powered extraction, I've observed some interesting patterns:
| Aspect | Human Interpretation | PageOn.ai AI Extraction |
|---|---|---|
| Contextual Understanding | High (but subjective) | Very good (improving with feedback) |
| Consistency | Variable (depends on individual) | Excellent (systematic approach) |
| Detail Retention | Often misses subtle details | High (captures connections across pages) |
| Complex Relationships | Good at inferring implicit connections | Excellent with explicit relationships, improving with implicit ones |
| Error Rate | 5-15% (higher with fatigue) | 3-7% (consistent regardless of document length) |
Cost-Benefit Analysis
I've analyzed various approaches to PDF visualization, comparing dedicated solutions against general-purpose tools:
When evaluating PDF to PowerPoint AI tools against specialized flowchart conversion solutions like PageOn.ai, I found that while PowerPoint tools are useful for basic presentations, they lack the structured relationship mapping needed for complex processes.
Similarly, using basic summarize PDF online tools can help reduce content volume, but they don't provide the visual transformation that makes information truly accessible and actionable.
Getting Started: Implementation Guide
Based on my experience implementing PageOn.ai across various organizations, here's my practical guide to getting started:
System Requirements and Compatibility
Supported Browsers
- Chrome (recommended): v90+
- Firefox: v88+
- Safari: v14+
- Edge: v90+
Device Requirements
- Desktop/Laptop: Any modern system
- Tablet: iPad (iOS 14+), Android (v9+)
- Mobile: Limited functionality, viewing only
- Internet: Stable connection required
User Permission and Security Considerations
In my enterprise implementations, I've found these security practices essential:
- Implement role-based access controls for sensitive documents
- Enable two-factor authentication for administrator accounts
- Configure data retention policies aligned with organizational requirements
- Review and understand PageOn.ai's data processing agreements
- Consider on-premise deployment options for highly regulated industries
Step-by-Step Tutorial
-
Create your PageOn.ai account
Sign up at pageon.ai and select the appropriate plan for your needs. Enterprise users should contact sales for custom deployment options.
-
Prepare your PDF document
Ensure your PDF is unlocked and text is selectable (not scanned images) for best results. For image-based PDFs, enable OCR processing.
-
Upload and analyze
Drag and drop your PDF onto the dashboard. For large documents, use the batch processing option.
-
Select visualization style
Choose from recommended flowchart types or customize based on your specific needs.
-
Generate and refine
Click "Generate" and use the editing tools to refine your flowchart. Save versions as you make significant changes.
-
Export and share
Export in your preferred format or share directly with team members. Enable commenting if collaboration is needed.

Tips for Optimizing PDFs
Through trial and error, I've discovered these optimization techniques:
- Ensure headings use consistent formatting for better structure detection
- Use numbered lists for sequential processes to improve step identification
- Add explicit relationship terms like "leads to," "results in," or "triggers" for better connection mapping
- Include a table of contents for large documents to aid in structure recognition
- Remove unnecessary headers, footers, and page numbers that might confuse the AI
Troubleshooting Common Challenges
| Issue | Solution |
|---|---|
| Missing connections between elements | Use the "Suggest Connections" feature or manually add relationships in the editor |
| Overly complex flowchart | Use the "Simplify" command or adjust the complexity slider in visualization settings |
| Text-heavy PDF not processing correctly | Enable "Deep Analysis" mode and increase processing time allowance |
| Scanned PDF not recognized | Enable OCR preprocessing and set language detection to automatic |
Future of Document Visualization
As someone deeply immersed in document processing technologies, I'm excited about several emerging trends that will transform how we visualize information:
Emerging Trends in AI Document Processing
- Multimodal understanding: Processing text, images, and diagrams simultaneously for comprehensive visualization
- Domain-specific visualization: Specialized flowchart styles for legal, medical, engineering, and other fields
- Real-time collaborative visualization: Multiple users creating and editing flowcharts simultaneously
- Voice-controlled editing: Natural language commands for flowchart creation and modification
PageOn.ai's Continuous Learning Approach
What particularly impresses me about PageOn.ai is how its conversion accuracy improves over time. The system learns from:
- User edits and corrections to generated flowcharts
- Industry-specific document patterns
- Organizational terminology and structure preferences
- Common visualization styles selected by users
From Static Flowcharts to Interactive Experiences
The future I see is one where document visualizations become fully interactive experiences:

- Clickable nodes that expand to reveal additional details
- Animated process flows that demonstrate sequence and timing
- Conditional paths that can be toggled to show different scenarios
- Integration with live data sources for dynamic visualization updates
- AI-powered natural language querying of visual elements
Integration with AR/VR for Immersive Document Exploration
Perhaps most exciting is the potential integration with augmented and virtual reality technologies. Imagine walking through a virtual representation of your document, where complex processes come to life in three-dimensional space. PageOn.ai is already developing prototypes that allow users to:
- Physically interact with flowchart elements using hand gestures
- View process flows from multiple perspectives and levels of detail
- Collaborate with remote team members in shared virtual document spaces
- Record guided walkthroughs of complex processes for training purposes
As these technologies mature, the line between static documents and dynamic visual experiences will continue to blur, making information more accessible and actionable than ever before.
Transform Your PDF Documents into Powerful Visualizations
Stop struggling with dense, text-heavy PDFs. With PageOn.ai's 3-click solution, you can instantly convert complex documents into clear, interactive flowcharts that enhance understanding and drive action.
Embracing the Future of Document Visualization
Throughout my career working with documentation and knowledge management, I've witnessed firsthand the transformative power of converting static information into dynamic visual formats. The journey from PDF to flowchart is no longer a time-consuming, specialized task—it's now accessible to anyone with just three clicks.
PageOn.ai's approach to document visualization represents a significant leap forward in how we process and share information. By combining advanced AI with intuitive user experience, it removes the barriers that have traditionally kept powerful visualization tools in the hands of specialists.
Whether you're streamlining business processes, enhancing academic research, simplifying technical documentation, or clarifying legal requirements, the ability to quickly transform PDFs into clear, interactive flowcharts can dramatically improve comprehension and decision-making.
As we look to the future, I'm excited to see how these technologies will continue to evolve, making information ever more accessible and actionable. The 3-click solution is just the beginning of a new era in document visualization—one where complex ideas can be understood at a glance, and where the insights trapped in static documents are finally set free.
You Might Also Like
Advanced Shape Effects for Professional Slide Design | Transform Your Presentations
Discover professional slide design techniques using advanced shape effects. Learn strategic implementation, customization, and optimization to create stunning presentations that engage audiences.
Revolutionizing Slides: The Power of AI Presentation Tools | PageOn.ai
Discover how AI presentation tools are transforming slide creation, saving hours of work while enhancing design quality. Learn how PageOn.ai can help visualize your ideas instantly.
Building New Slides from Prompts in Seconds | AI-Powered Presentation Creation
Discover how to create professional presentations instantly using AI prompts. Learn techniques for crafting perfect prompts that generate stunning slides without design skills.
The Strategic GIF Guide: Creating Memorable Moments in Professional Presentations
Discover how to effectively use GIFs in professional presentations to create visual impact, enhance audience engagement, and communicate complex concepts more memorably.
