Transforming Business Narratives: The Power of Automated Visual Storytelling
Revolutionizing how businesses communicate through AI-powered visual creation
I've witnessed a remarkable shift in business communication over the years. What once relied heavily on text-dense presentations has evolved into a visual-first approach that captures attention, drives engagement, and delivers results. In this guide, I'll walk you through how automated visual creation is transforming business storytelling and how you can leverage these powerful tools to enhance your own business communications.
The Evolution of Business Communication
I've observed that business communication has undergone a dramatic transformation in recent years. The days of text-heavy PowerPoint presentations that put audiences to sleep are rapidly giving way to visually rich narratives that capture attention and drive engagement.
The psychology behind this shift is compelling. Our brains process visual information 60,000 times faster than text, and people remember 80% of what they see compared to just 20% of what they read. This neurological preference for visual processing creates stronger business connections and more memorable impressions.
Traditional business storytelling tools have significant limitations. They often require design expertise, are time-consuming to use, and result in static, one-size-fits-all outputs that don't adapt to different audiences or contexts. These constraints have created a gap between the potential of visual storytelling and its practical implementation in business settings.
Impact of Visual Elements on Audience Engagement
Key research findings further emphasize the importance of visual storytelling in business contexts:
- Presentations with visual aids are 43% more persuasive than those without
- Content with relevant images receives 94% more views than content without
- 65% of people are visual learners who absorb information best through images
- Visual content is 40 times more likely to be shared on social media
As businesses face increasing competition for attention, the ability to communicate through compelling visual narratives has become a critical competitive advantage. Automated visual creation tools are democratizing access to this advantage, allowing anyone in an organization to create professional-quality visual stories without specialized design skills.
Core Elements of Effective Business Visual Storytelling
In my experience working with business communications, I've found that effective visual storytelling requires a thoughtful balance of several key elements. When these components work together harmoniously, they create narratives that not only inform but also inspire action.
Elements of Effective Business Visual Storytelling
                    flowchart TD
                        Story[Narrative Structure] --> Visual[Visual Hierarchy]
                        Story --> Emotion[Emotional Connection]
                        Story --> Brand[Brand Consistency]
                        Visual --> Impact[Maximum Impact]
                        Emotion --> Impact
                        Brand --> Impact
                        Data[Data Visualization] --> Visual
                        Data --> Emotion
                        Framework[Storytelling Framework] --> Story
                        classDef orange fill:#FF8000,stroke:#F97316,color:white
                        classDef blue fill:#42A5F5,stroke:#1E88E5,color:white
                        classDef green fill:#66BB6A,stroke:#43A047,color:white
                        class Story,Framework orange
                        class Visual,Data blue
                        class Emotion,Brand,Impact green
Establishing a Coherent Narrative Structure
Every effective business visual story begins with a clear narrative structure that drives specific business objectives. This means organizing information in a logical flow that takes the audience on a journey from problem to solution, or from current state to desired outcome. The narrative should have a clear beginning (context), middle (challenge or opportunity), and end (resolution or call to action).
Balancing Data with Emotion
While business communications often revolve around data and facts, the most compelling visual stories balance analytical information with emotional resonance. I've found that storytelling with data becomes most effective when it connects numbers to human experiences, challenges, or aspirations. This might involve using metaphorical imagery, human-centered scenarios, or visuals that evoke specific emotional responses.
Creating Visual Hierarchies
Effective visual storytelling guides the viewer's eye through information in a deliberate sequence. This requires establishing clear visual hierarchies using size, color, contrast, and positioning to indicate what's most important. When I create business visuals, I ensure that the most critical information stands out immediately, with supporting details available but not competing for attention.
Maintaining Brand Consistency
Visual stories should feel distinctly "on brand" while still being visually distinctive. This means adhering to brand guidelines for colors, typography, and imagery while finding creative ways to present information in fresh, engaging formats. Consistency builds recognition and trust, while thoughtful variation prevents visual fatigue.
Pro Tip:
When creating visual stories for business, I always start by identifying the single most important message I want the audience to remember. Everything else in the visual narrative should support and reinforce this core message.
Automating the Visual Creation Process
The advent of AI-powered tools has fundamentally transformed how we approach visual storytelling in business contexts. What once required specialized design skills and significant time investment can now be accomplished through intelligent automation that translates concepts into visuals with remarkable speed and accuracy.

How AI Transforms Abstract Concepts into Visuals
Modern AI business presentation generator tools employ sophisticated algorithms that understand the semantic relationships between concepts and their visual representations. When I input a business concept like "market expansion strategy," AI can analyze the components of this idea and generate appropriate visual metaphors, data visualizations, and structural frameworks that accurately represent the concept in visual form.
AI-Powered Visual Creation Process
                    flowchart LR
                        Input[Business Concept Input] -->|Text Analysis| Understanding[Semantic Understanding]
                        Understanding -->|Pattern Matching| Elements[Visual Elements Selection]
                        Elements -->|Composition Rules| Layout[Visual Layout Generation]
                        Layout -->|Style Application| Styling[Visual Styling & Branding]
                        Styling -->|Quality Check| Output[Final Visual Output]
                        User[User Feedback] -->|Iterative Refinement| Elements
                        User -->|Style Guidance| Styling
                        classDef input fill:#FF8000,stroke:#F97316,color:white
                        classDef process fill:#42A5F5,stroke:#1E88E5,color:white
                        classDef output fill:#66BB6A,stroke:#43A047,color:white
                        classDef user fill:#EC4899,stroke:#DB2777,color:white
                        class Input,User input
                        class Understanding,Elements,Layout,Styling process
                        class Output output
Breaking Down Technical Barriers
One of the most significant advantages I've found with automated visual creation tools is how they democratize design capabilities. Team members without formal design training can now produce professional-quality visuals by focusing on their content expertise rather than wrestling with design software. This removes a major bottleneck in the business communication process and allows subject matter experts to directly translate their knowledge into compelling visuals.
The Role of Conversational Interfaces
Modern visual creation tools leverage conversational interfaces that make the design process feel more intuitive and accessible. Rather than navigating complex menus and tools, I can simply describe what I want to create in natural language, and the AI interprets my intent and generates appropriate visual options. This conversational approach streamlines the workflow and makes the creation process feel more collaborative.
Manual vs. AI-Assisted Visual Creation: Time Comparison
Case Study: Project Management Transformation
Project managers like Nicolás have experienced significant workflow improvements through automated visual creation tools. In his testimonial, Nicolás describes how these tools have become "a game-changer" for his professional development, allowing him to quickly create presentations and generate visual ideas based on his concepts.
For project managers, the ability to rapidly visualize project timelines, resource allocations, risk assessments, and progress reports without depending on design resources has transformed how they communicate with stakeholders. What once required days of back-and-forth with designers can now be accomplished in minutes, allowing more time for strategic thinking and project execution.
Key Takeaway:
Automated visual creation doesn't replace human creativity—it amplifies it. By handling the technical aspects of visual production, AI tools free business professionals to focus on strategic messaging and audience engagement.
Data-Driven Visual Storytelling Techniques
Data is the backbone of business decision-making, but raw numbers rarely inspire action. In my experience, the art of PowerPoint data storytelling lies in transforming complex datasets into visual narratives that reveal insights and drive decisions.

Translating Complex Data into Visual Narratives
The most effective data visualizations don't just present numbers—they tell stories with those numbers. When I approach data visualization, I focus on identifying the narrative thread that connects different data points. Is it a story of growth over time? A comparison between different segments? A revelation of unexpected patterns? Once I've identified this narrative, I can select visualization formats that best support that story.
Effectiveness of Different Data Visualization Types
Balancing Accuracy with Emotional Connection
One of the greatest challenges in data visualization is maintaining absolute accuracy while creating emotional resonance. I've found that the most successful approach is to ensure the data representation itself is scrupulously accurate, while using color, context, and supporting elements to create emotional impact. For example, a precisely accurate line chart showing declining customer satisfaction can be made more emotionally resonant through thoughtful color choices and contextual imagery that emphasizes the human impact of those numbers.
Using Deep Search for Relevant Visualizations
PageOn.ai's Deep Search capability has transformed how I approach data visualization. Rather than starting from scratch with each new dataset, I can quickly discover visualization approaches that have proven effective for similar data stories. This not only saves time but also exposes me to visualization techniques I might not have considered otherwise.
Data Storytelling Process
                    flowchart TD
                        Data[Raw Data] -->|Analysis| Insights[Key Insights]
                        Insights -->|Narrative Development| Story[Data Story]
                        Story -->|Visual Translation| Visualization[Visual Representation]
                        Visualization -->|Context Addition| Context[Contextual Framing]
                        Context -->|Refinement| Final[Final Data Narrative]
                        Audience[Audience Analysis] -->|Influences| Story
                        Audience -->|Influences| Visualization
                        Audience -->|Influences| Context
                        Goal[Business Objective] -->|Directs| Insights
                        Goal -->|Directs| Story
                        classDef primary fill:#FF8000,stroke:#F97316,color:white
                        classDef secondary fill:#42A5F5,stroke:#1E88E5,color:white
                        classDef tertiary fill:#66BB6A,stroke:#43A047,color:white
                        class Data,Insights,Story primary
                        class Visualization,Context,Final secondary
                        class Audience,Goal tertiary
Best Practices for Different Business Contexts
Different business contexts call for different approaches to data visualization. When I'm creating visuals for executive decision-making, I focus on high-level insights with clear implications. For operational teams, I emphasize actionable details and comparative benchmarks. For external stakeholders, I prioritize accessibility and contextual explanation. The automated tools I use help maintain consistency across these different contexts while adapting to their specific requirements.
Pro Tip:
When creating data visualizations, I always start by asking: "What decision needs to be made with this data?" This helps me focus on creating visuals that directly support the decision-making process rather than just displaying information.
Implementing Automated Visual Storytelling Across Business Functions
The power of ai-driven visual storytelling extends across all business functions. I've seen firsthand how different departments can leverage these tools to transform their communication approaches and drive better outcomes.
Sales and Marketing Applications
In sales and marketing contexts, visual storytelling creates emotional connections with prospects and customers that drive engagement and conversion. Some of the most effective applications I've implemented include:
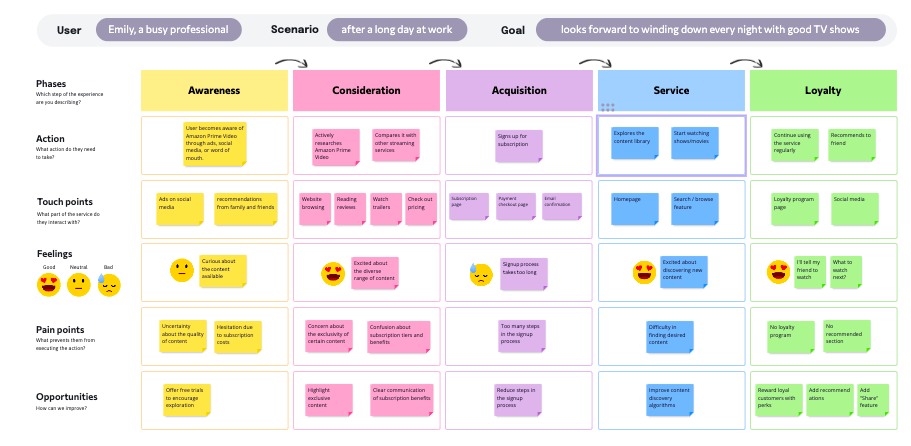
- Customer Journey Maps: Using PageOn.ai's AI Blocks to create modular, visually engaging customer journey visualizations that highlight key touchpoints and emotional states
- Persuasive Pitch Decks: Developing presentation materials that tell cohesive visual stories about customer problems and how your solution addresses them
- Competitive Advantage Visualizations: Creating clear visual comparisons that highlight your unique selling propositions against competitors
- Consistent Marketing Collateral: Automating the creation of visually aligned materials across channels while maintaining brand consistency
Internal Communications and Leadership
Leadership communication often involves complex strategic concepts that can be difficult to convey through words alone. Visual storytelling offers powerful solutions:
Strategic Vision Communication Process
                    flowchart LR
                        Vision[Strategic Vision] -->|Translation| Concepts[Key Concepts]
                        Concepts -->|Visualization| Visual[Visual Elements]
                        Visual -->|Assembly| Story[Visual Narrative]
                        Story -->|Distribution| Channels[Communication Channels]
                        Channels -->|Feedback| Refinement[Iterative Refinement]
                        Refinement -.->|Informs| Vision
                        PageOn[PageOn.ai Vibe Creation] -->|Enhances| Visual
                        PageOn -->|Streamlines| Story
                        classDef primary fill:#FF8000,stroke:#F97316,color:white
                        classDef secondary fill:#42A5F5,stroke:#1E88E5,color:white
                        classDef tool fill:#EC4899,stroke:#DB2777,color:white
                        class Vision,Concepts,Story primary
                        class Visual,Channels,Refinement secondary
                        class PageOn tool
- Strategic Vision Translation: Transforming abstract strategic concepts into concrete visual narratives that create alignment
- Organizational Change Visualization: Creating visual representations of transformation journeys that help employees understand their role in the change process
- Visual Executive Summaries: Developing at-a-glance visual overviews of complex reports or initiatives that busy executives can quickly absorb
- Leadership Concept Visualization: Using PageOn.ai's Vibe Creation to translate leadership philosophies and approaches into engaging visuals
Training and Knowledge Transfer
When it comes to training and knowledge sharing, visual storytelling dramatically improves comprehension and retention:
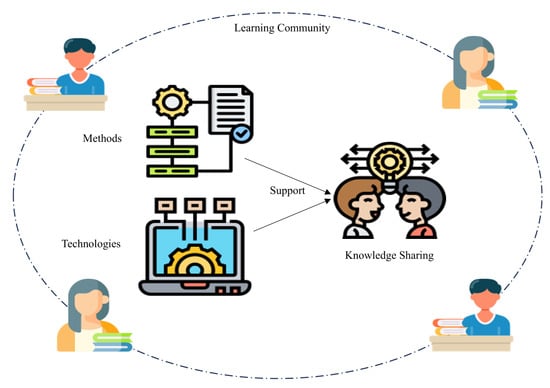
- Process Visualization: Creating clear, step-by-step visual representations of complex workflows and procedures
- Visual Learning Journeys: Developing engaging visual paths through learning content that increase engagement and completion rates
- Consistent Training Materials: Automating the creation of visually aligned training resources across departments and topics
- Knowledge Translation: Using PageOn.ai to transform subject matter expertise into clear visual instructions accessible to all skill levels
Impact of Visual Storytelling Across Business Functions
Implementation Strategy:
When introducing automated visual storytelling across business functions, I recommend starting with a pilot project in one department where visual communication can have an immediate impact. Document the results carefully, then use those success stories to drive adoption in other areas of the organization.
Measuring the Impact of Visual Business Storytelling
As with any business initiative, measuring the impact of visual storytelling investments is crucial for optimization and continued support. I've developed a comprehensive approach to quantifying both the tangible and intangible benefits of visual communication.
Key Performance Indicators
The most effective measurement frameworks for visual business communication include both process metrics and outcome metrics:
| Metric Category | Process Metrics | Outcome Metrics |
|---|---|---|
| Efficiency |
|
|
| Engagement |
|
|
| Comprehension |
|
|
| Business Impact |
|
|
Tools for Gathering Feedback
Collecting meaningful feedback on visual storytelling effectiveness requires a multi-faceted approach. I typically combine quantitative measurement tools like heat mapping, engagement analytics, and A/B testing with qualitative methods such as focused feedback sessions, surveys, and observational studies. This balanced approach provides both the "what" and the "why" behind audience responses to visual stories.
Calculating ROI
To calculate the return on investment for automated visual creation tools, I consider both direct and indirect benefits:
ROI Components for Visual Storytelling Investments
Case Studies: Business Outcome Improvements
Real-world examples provide compelling evidence of the impact of visual storytelling:
- Sales Enablement: A B2B technology company saw a 32% increase in proposal win rates after implementing automated visual storytelling for their sales presentations, with the average deal size increasing by 18%.
- Change Management: A multinational organization undergoing digital transformation achieved 87% employee understanding of the change initiative (compared to typical rates of 40-60%) by using visual storytelling to communicate the transformation journey.
- Product Training: A software company reduced time-to-proficiency for new users by 45% after implementing visual learning journeys created with automated tools, resulting in higher adoption rates and reduced support costs.
Optimization Through Performance Data
PageOn.ai's agentic capabilities provide a powerful feedback loop for continuous improvement of visual storytelling. By analyzing performance data from previous visual assets, the system can recommend adjustments to improve engagement, comprehension, and conversion rates. This data-driven optimization approach ensures that visual storytelling effectiveness increases over time, maximizing the return on investment.
Measurement Tip:
When measuring the impact of visual storytelling, be sure to establish a clear baseline before implementation. This before-and-after comparison provides the most compelling evidence of the value created by your visual communication investments.
Future Trends in Automated Visual Business Storytelling
As I look toward the horizon of business communication, several emerging trends are poised to transform how we create and consume visual stories in professional contexts.

Interactive and Dynamic Elements
The future of business visual storytelling is increasingly interactive. Static visuals are giving way to dynamic elements that respond to user input, allowing audiences to explore data and concepts at their own pace and according to their own interests. These interactive elements create more engaging experiences and allow for personalized discovery paths through complex information.
Generative AI and Visual Creativity
Generative AI is rapidly expanding the boundaries of what's possible in visual business communication. These technologies can now create entirely original visual assets based on text descriptions, generate variations on existing designs, and even adapt visuals in real-time based on audience engagement data. This is democratizing access to high-quality visual creation capabilities while simultaneously raising the bar for visual storytelling excellence.
Evolution of Visual Storytelling Technologies
                    flowchart TD
                        Past[Static Presentations] -->|Evolution| Present[Interactive Visuals]
                        Present -->|Emerging| Future[Immersive Experiences]
                        Present -->|Integration| AI[AI-Generated Content]
                        Present -->|Enhancement| Data[Real-time Data Integration]
                        Present -->|Expansion| Personal[Personalization]
                        AI -->|Enables| Future
                        Data -->|Enables| Future
                        Personal -->|Enables| Future
                        Future -->|Branches into| AR[Augmented Reality]
                        Future -->|Branches into| VR[Virtual Reality]
                        Future -->|Branches into| Adaptive[Adaptive Narratives]
                        classDef past fill:#94A3B8,stroke:#64748B,color:white
                        classDef present fill:#FF8000,stroke:#F97316,color:white
                        classDef future fill:#42A5F5,stroke:#1E88E5,color:white
                        classDef tech fill:#66BB6A,stroke:#43A047,color:white
                        class Past past
                        class Present present
                        class Future,AR,VR,Adaptive future
                        class AI,Data,Personal tech
Emerging Platforms and Technologies
The landscape of visual storytelling platforms is evolving rapidly. We're seeing the emergence of specialized tools for different industries and use cases, integration of augmented and virtual reality elements into business presentations, and platforms that adapt content based on viewing context and device. These technologies are creating new possibilities for immersive storytelling experiences that were previously impossible in business contexts.
Democratization of Design Capabilities
Perhaps the most significant trend I'm observing is the democratization of sophisticated design capabilities across organizational roles. Tools like PageOn.ai are making it possible for anyone in an organization—regardless of design background—to create professional-quality visual stories. This is transforming how organizations approach communication by distributing storytelling capabilities throughout the organization rather than concentrating them in specialized teams.
Projected Adoption of Advanced Visual Storytelling Technologies
PageOn.ai's Pioneering Role
PageOn.ai is at the forefront of the next generation of business visual storytelling tools. By combining sophisticated AI capabilities with an intuitive user interface, PageOn.ai is making advanced visual storytelling accessible to business professionals across industries and roles. The platform's focus on creating cohesive visual narratives rather than just isolated graphics represents a significant evolution in how businesses approach visual communication.
Future Preparation:
To prepare for the future of visual business storytelling, I recommend developing a dual focus: build foundational visual literacy skills that transcend specific tools while simultaneously experimenting with emerging technologies that could provide competitive advantages in your industry.
Getting Started with Automated Visual Storytelling
Implementing automated visual storytelling in your organization doesn't have to be overwhelming. I've developed a structured approach that helps teams start small, demonstrate value, and scale successfully.

Conducting a Visual Audit
Begin by assessing your current visual communication materials. Look for patterns, inconsistencies, and opportunities for improvement. Ask questions like: Are your visuals aligned with your brand identity? Do they effectively communicate key messages? Are they accessible to different audiences? This audit establishes a baseline and helps identify high-priority areas for improvement.
Identifying High-Impact Opportunities
Not all visual storytelling opportunities offer equal value. I recommend prioritizing based on audience reach, strategic importance, and potential business impact. Look for situations where improved visual communication could directly influence key decisions, accelerate understanding, or drive specific business outcomes. These high-impact opportunities make ideal starting points for your visual storytelling transformation.
Visual Storytelling Implementation Process
                    flowchart LR
                        Audit[Visual Audit] -->|Identifies Gaps| Opportunities[Opportunity Identification]
                        Opportunities -->|Prioritization| Strategy[Visual Language Strategy]
                        Strategy -->|Implementation| Pilot[Pilot Project]
                        Pilot -->|Evaluation| Results[Results Measurement]
                        Results -->|Refinement| Scale[Organization-wide Scaling]
                        Training[Team Training] -->|Enables| Pilot
                        Tools[Tool Selection] -->|Supports| Pilot
                        classDef primary fill:#FF8000,stroke:#F97316,color:white
                        classDef secondary fill:#42A5F5,stroke:#1E88E5,color:white
                        classDef support fill:#66BB6A,stroke:#43A047,color:white
                        class Audit,Opportunities,Strategy primary
                        class Pilot,Results,Scale secondary
                        class Training,Tools support
Developing a Visual Language
A consistent visual language ensures that all your visual storytelling efforts reinforce your brand identity and communicate with clarity. This visual language should define elements like color usage, typography hierarchy, iconography style, data visualization approaches, and image treatment. When aligned with your brand guidelines, this visual language creates a cohesive experience across all touchpoints.
Creating a Pilot Project
Start with a well-defined pilot project that addresses a specific business challenge. PageOn.ai's intuitive interface and AI Blocks feature make it ideal for pilot implementations, allowing teams to quickly create professional-quality visual stories without extensive training. Document your process, challenges, and outcomes to create a blueprint for future projects.
Visual Storytelling Implementation Timeline
Measuring Results and Scaling
Carefully measure the results of your pilot project using the metrics discussed in the previous section. Compare these results to your baseline to quantify improvements in efficiency, engagement, comprehension, and business impact. Use these insights to refine your approach before scaling across the organization. As you expand, focus on building capabilities rather than just implementing tools—help teams understand the principles of effective visual storytelling so they can apply them across different contexts.
Implementation Checklist:
- Complete a thorough audit of current visual communication materials
- Identify 2-3 high-impact opportunities for visual storytelling transformation
- Develop a visual language aligned with brand guidelines
- Select appropriate tools and platforms (like PageOn.ai) for your specific needs
- Train a pilot team on both tools and visual storytelling principles
- Execute a well-defined pilot project with clear success metrics
- Measure results and gather feedback from stakeholders
- Refine approach based on learnings
- Create a scaling plan with phased implementation across the organization
Transform Your Visual Expressions with PageOn.ai
Ready to revolutionize how your business communicates complex ideas? PageOn.ai's intuitive platform empowers you to create stunning visual narratives that drive engagement, improve comprehension, and deliver measurable business results.
Start Creating with PageOn.ai TodayEmbracing the Future of Business Communication
Throughout this guide, I've explored how automated visual storytelling is transforming business communication across functions and industries. The shift from text-heavy presentations to visual-first narratives represents more than just an aesthetic change—it's a fundamental evolution in how we share ideas, drive decisions, and create alignment in business contexts.
As visual storytelling tools become more sophisticated and accessible, the organizations that embrace these capabilities gain significant advantages in communication effectiveness, audience engagement, and ultimately, business outcomes. The democratization of design capabilities through platforms like PageOn.ai means that anyone in your organization can now create professional-quality visual stories that drive understanding and action.
I encourage you to begin your visual storytelling journey with a thoughtful, strategic approach. Start by understanding your current state, identifying high-impact opportunities, and implementing a pilot project that demonstrates the value of visual communication. As you scale these capabilities across your organization, you'll develop a powerful new way to communicate that resonates with audiences and drives results.
The future of business communication is visual, interactive, and increasingly automated. By embracing these trends now, you position your organization to communicate more effectively in an increasingly complex and attention-scarce business environment.
You Might Also Like
Circle of Knowledge Method: Creating Credible Visual Presentations That Resonate
Learn how to implement the Circle of Knowledge Method to create credible, visually stunning presentations that build authority and connect with your audience.
Transform Any Content into Professional Slides: The Ultimate Conversion Guide
Learn expert techniques for converting documents, presentations, and visual content into professional slides with this comprehensive guide to content format transformation.
Audience-Centered Pitching Techniques: Visual Strategies That Win Every Time
Discover powerful audience-centered pitching techniques using visual storytelling, interactive engagement, and benefit visualization strategies that consistently win over any audience.
Beyond "Today I'm Going to Talk About": Creating Memorable Presentation Openings
Transform your presentation openings from forgettable to captivating. Learn psychological techniques, avoid common pitfalls, and discover high-impact alternatives to the 'Today I'm going to talk about' trap.