Visual Learning Revolution: Unlocking Student Memory Potential Through Diagram Techniques
Discover how visual diagrams can transform the way students learn, remember, and excel academically
As a student, I've always struggled with remembering large volumes of information for exams. That was until I discovered the power of visual learning techniques. In this guide, I'll share how transforming complex information into visual diagrams can dramatically improve your memory retention and academic performance.
Whether you're preparing for finals, tackling a challenging subject, or simply looking to enhance your learning efficiency, visual diagram techniques offer a scientifically-proven approach to better retention and recall.
Throughout this guide, I'll explore various visual diagram techniques, their applications across different subjects, and how tools like PageOn.ai can transform your study approach. Let's dive into the science behind why these methods work so effectively.
The Science Behind Visual Memory for Students
Our brains are remarkably efficient at processing visual information. When I first learned that we process visual information 60,000 times faster than text, I immediately understood why my diagram-based notes were so much more effective than traditional ones.
Research consistently shows that students who use visual learning techniques experience retention rates up to 65% higher than those who rely solely on text-based learning. This dramatic difference stems from how our brains are wired to process information.
Cognitive Benefits of Visual Learning
- Dual coding: When we combine visual and verbal information, we create two different memory pathways to the same information.
- Pattern recognition: Our brains naturally seek and remember patterns, which visual diagrams explicitly highlight.
- Spatial memory: We have powerful spatial memory capabilities that visual learning leverages.
- Emotional connection: Visuals can trigger emotional responses that strengthen memory formation.
When I create types of diagrams for my study materials, I'm not just organizing information—I'm creating stronger neural pathways. These visual connections make information retrieval during exams much more efficient.
                    flowchart TD
                        A[Visual Information] --> B[Visual Cortex]
                        C[Text Information] --> D[Language Processing Areas]
                        B --> E[Working Memory]
                        D --> E
                        E --> F[Encoding]
                        F --> G[Long-term Memory]
                        G --> H[Retrieval During Exams]
                        style A fill:#FF8000,stroke:#333,stroke-width:1px
                        style C fill:#42A5F5,stroke:#333,stroke-width:1px
                        style B fill:#FFA347,stroke:#333,stroke-width:1px
                        style D fill:#66BBFF,stroke:#333,stroke-width:1px
                        style E fill:#66BB6A,stroke:#333,stroke-width:1px
                        style F fill:#66BB6A,stroke:#333,stroke-width:1px
                        style G fill:#FFCC00,stroke:#333,stroke-width:1px
                        style H fill:#FFCC00,stroke:#333,stroke-width:1px
Different learning styles benefit from visual techniques in unique ways. As a visual learner, diagrams are my primary learning tool. However, even auditory and kinesthetic learners can enhance their retention by incorporating visual elements into their study routines.
Essential Visual Diagram Types for Academic Success
Throughout my academic journey, I've found that different subjects and learning objectives call for specific types of visual diagrams. Understanding which diagram type to use for each learning scenario has been crucial to my success.
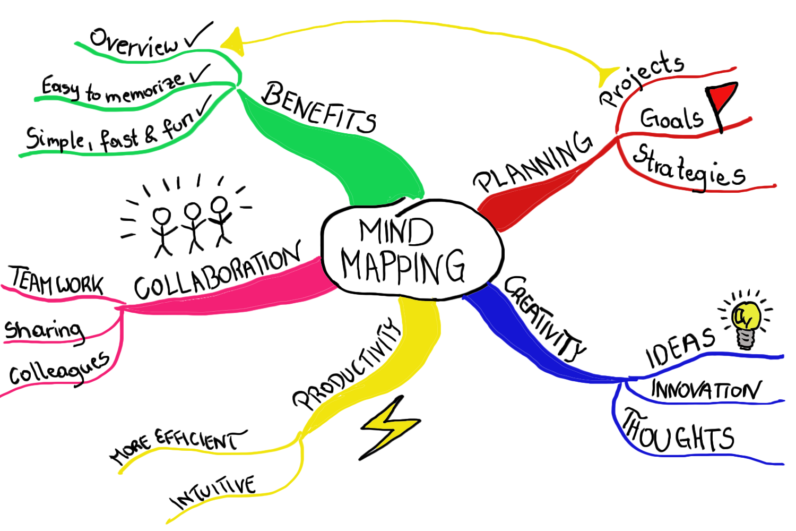
Mind Maps
Perfect for organizing complex subject relationships and brainstorming. I use these for initial topic exploration and connecting related concepts.
Best for: Literature reviews, brainstorming essays, organizing research
Concept Maps
Ideal for visualizing connections between theories and applications. These help me understand how ideas relate to each other.
Best for: Science concepts, philosophical theories, complex relationships
Flowcharts
Essential for breaking down sequential processes and decision points. I use these to understand procedures and algorithms.
Best for: Computer science, biology processes, historical sequences
Venn Diagrams
Perfect for comparing and contrasting key concepts across subjects. These help me identify similarities and differences.
Best for: Comparative literature, biological classifications, theory comparisons
Timelines
Crucial for structuring historical events and project planning for assignments. I use these to visualize chronological progression.
Best for: History, project management, developmental studies
Infographics
Excellent for condensing data-heavy subjects into memorable visual formats. These help me remember statistics and key facts.
Best for: Statistics, demographic data, research findings

When I'm creating visual presentation examples for my study materials, I carefully consider which diagram type will best represent the information structure. The right visual format can make complex information instantly understandable.
Each diagram type serves a specific purpose in my study toolkit. I've found that combining different diagram types for the same subject matter helps me understand the material from multiple perspectives, creating a more comprehensive understanding.
Implementing Visual Techniques Across Different Subjects
One of my favorite aspects of visual learning is how adaptable it is across different academic disciplines. I've found unique ways to apply these techniques to both STEM and humanities subjects.
STEM Subjects

In my chemistry courses, I've transformed complex molecular structures into clear, memorable diagrams using PageOn.ai's AI Blocks feature. This approach has made understanding chemical bonding and reactions much more intuitive.
                    flowchart TD
                        A[Observe Phenomenon] --> B[Form Hypothesis]
                        B --> C[Design Experiment]
                        C --> D[Collect Data]
                        D --> E[Analyze Results]
                        E --> F{Supports Hypothesis?}
                        F -->|Yes| G[Refine Theory]
                        F -->|No| H[Revise Hypothesis]
                        H --> C
                        G --> I[Peer Review]
                        I --> J[Scientific Knowledge]
                        style A fill:#FF8000,stroke:#333,stroke-width:1px
                        style B fill:#FF9A3D,stroke:#333,stroke-width:1px
                        style C fill:#FFB366,stroke:#333,stroke-width:1px
                        style D fill:#FFCC99,stroke:#333,stroke-width:1px
                        style E fill:#FFE5CC,stroke:#333,stroke-width:1px
                        style F fill:#42A5F5,stroke:#333,stroke-width:1px
                        style G fill:#66BB6A,stroke:#333,stroke-width:1px
                        style H fill:#FF5252,stroke:#333,stroke-width:1px
                        style I fill:#AB47BC,stroke:#333,stroke-width:1px
                        style J fill:#FFCA28,stroke:#333,stroke-width:1px
For my biology coursework, I create flowcharts like the one above to map out complex scientific processes. This visual approach helps me understand the relationships between different stages in biological systems.
In mathematics, I use drawing inferences lesson plans to visualize abstract concepts. By creating diagrams that represent mathematical relationships, I can better understand how formulas relate to real-world applications.
Humanities and Social Sciences
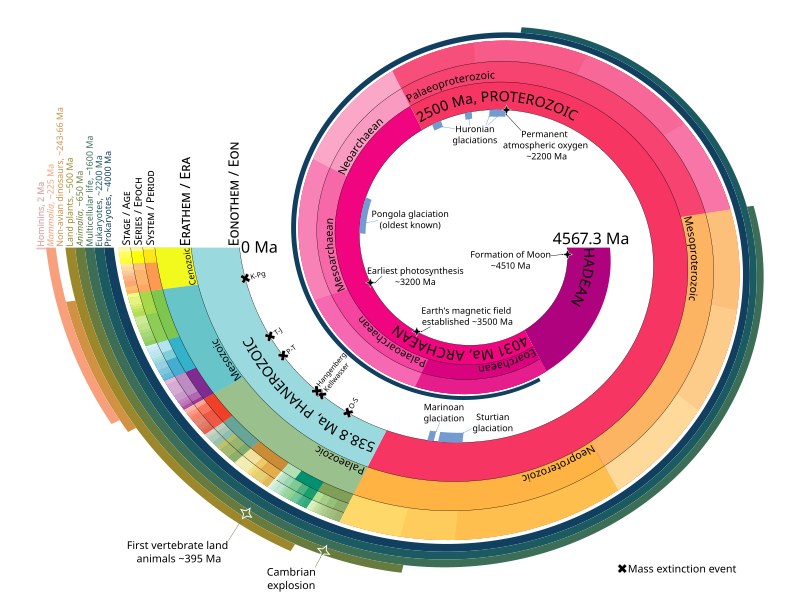
For history courses, I create detailed timelines that don't just show when events occurred but also visualize cause-effect relationships. This approach has transformed my understanding of historical periods from memorization to comprehension.
                    flowchart TD
                        A[Romeo Montague] -->|Loves| B[Juliet Capulet]
                        B -->|Loves| A
                        C[Montague Family] -->|Feud| D[Capulet Family]
                        D -->|Feud| C
                        A --> C
                        B --> D
                        E[Mercutio] -->|Friend| A
                        F[Tybalt] -->|Cousin| B
                        F -->|Kills| E
                        A -->|Kills| F
                        G[Prince] -->|Banishes| A
                        H[Friar Lawrence] -->|Helps| A
                        H -->|Helps| B
                        H -->|Creates Plan| I[Fake Death Plot]
                        I -->|Misunderstood by| A
                        I -->|Enacted by| B
                        A -->|Suicide| J[Tragic Ending]
                        B -->|Suicide| J
                        style A fill:#FF8000,stroke:#333,stroke-width:1px
                        style B fill:#FF9A3D,stroke:#333,stroke-width:1px
                        style C fill:#42A5F5,stroke:#333,stroke-width:1px
                        style D fill:#66BBFF,stroke:#333,stroke-width:1px
                        style E fill:#AB47BC,stroke:#333,stroke-width:1px
                        style F fill:#FF5252,stroke:#333,stroke-width:1px
                        style G fill:#FFCA28,stroke:#333,stroke-width:1px
                        style H fill:#66BB6A,stroke:#333,stroke-width:1px
                        style I fill:#78909C,stroke:#333,stroke-width:1px
                        style J fill:#000000,stroke:#333,stroke-width:1px,color:#FFFFFF
In literature courses, I map out character relationships and plot developments as shown in this Romeo and Juliet relationship diagram. This visual approach helps me track complex narratives and character motivations throughout a text.
For my geography and social science courses, I use PageOn.ai's Vibe Creation to transform abstract concepts into engaging visuals. This has been particularly helpful for visualizing demographic data and geographical relationships that would be difficult to understand through text alone.
Active Visual Learning: Beyond Passive Diagram Consumption
I've discovered that creating my own visual materials, rather than just consuming pre-made diagrams, dramatically improves my understanding and retention. Active engagement with the material through visualization is a powerful learning technique.
Transforming Lecture Notes into Visual Diagrams
During lectures, I now take notes with visualization in mind. Instead of writing paragraphs of text, I create quick sketch diagrams and mind maps that capture the relationships between concepts. This approach helps me stay engaged during class and creates study materials that are much more effective for review.
My 4-Step Process for Visual Note-Taking
- Listen for structure: Identify main topics and subtopics as the lecture progresses
- Create a basic framework: Draw a central node for the main topic with branches for subtopics
- Add visual cues: Use colors, symbols, and simple drawings to represent concepts
- Connect related ideas: Draw lines between related concepts, even if they appear at different points in the lecture
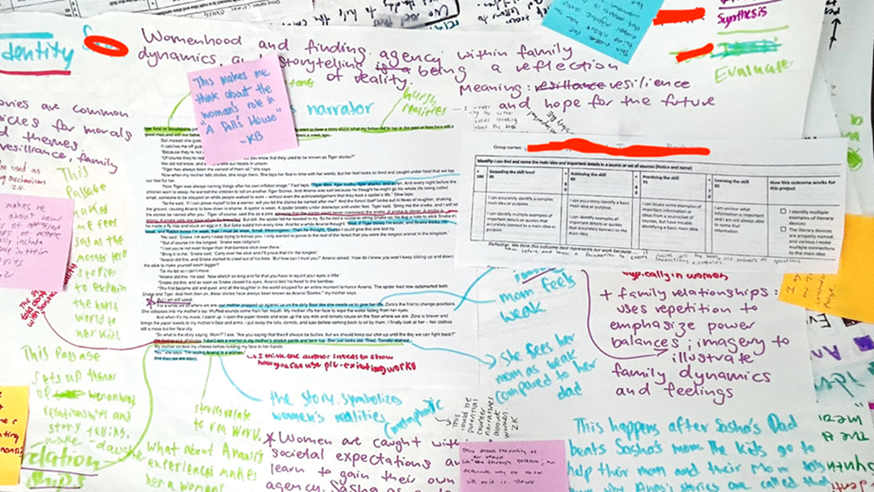
Collaborative Visual Mapping
Some of my most productive study sessions have involved collaborative visual mapping with study groups. We gather around a large sheet of paper or digital whiteboard and create comprehensive visual maps of course material, with each person contributing their understanding.
This collaborative approach reveals gaps in understanding and creates a more complete picture of the subject matter. It also exposes me to different ways of visualizing the same information, which strengthens my mental flexibility.
                    flowchart TD
                        A[Fuzzy Thoughts & Complex Notes] --> B[PageOn.ai Processing]
                        B --> C{Type of Content?}
                        C -->|Sequential Process| D[Generate Flowchart]
                        C -->|Related Concepts| E[Create Mind Map]
                        C -->|Comparative Data| F[Design Comparison Chart]
                        C -->|Timeline Data| G[Build Visual Timeline]
                        D & E & F & G --> H[Clear Visual Structure]
                        H --> I[Enhanced Understanding]
                        H --> J[Improved Retention]
                        H --> K[Easier Recall During Exams]
                        style A fill:#FF5252,stroke:#333,stroke-width:1px
                        style B fill:#FF8000,stroke:#333,stroke-width:1px
                        style C fill:#42A5F5,stroke:#333,stroke-width:1px
                        style D fill:#66BB6A,stroke:#333,stroke-width:1px
                        style E fill:#66BB6A,stroke:#333,stroke-width:1px
                        style F fill:#66BB6A,stroke:#333,stroke-width:1px
                        style G fill:#66BB6A,stroke:#333,stroke-width:1px
                        style H fill:#AB47BC,stroke:#333,stroke-width:1px
                        style I fill:#FFCA28,stroke:#333,stroke-width:1px
                        style J fill:#FFCA28,stroke:#333,stroke-width:1px
                        style K fill:#FFCA28,stroke:#333,stroke-width:1px
One of my favorite tools for active visual learning is PageOn.ai, which helps me quickly transform my fuzzy thoughts and complex notes into clear visual structures. This process of converting information from text to visuals forces me to deeply process the material, significantly enhancing my understanding and retention.
Digital Tools and Techniques for Visual Learning Mastery
While traditional pen-and-paper diagrams have their place, I've found that digital tools offer tremendous advantages for creating, editing, and sharing visual learning materials. These tools have transformed how I approach visual learning.

PageOn.ai has become my go-to tool for creating academic visualizations. Its AI-powered diagram creation capabilities allow me to quickly generate professional-quality diagrams for projects, study guides, and presentations.
Benefits of Digital Visual Tools vs. Traditional Methods
| Feature | Traditional Hand-Drawn | Digital Tools (e.g., PageOn.ai) |
|---|---|---|
| Editing Flexibility | Limited, often requires redrawing | High, easy modifications and iterations |
| Creation Speed | Slow, especially for complex diagrams | Fast, with AI assistance and templates |
| Visual Quality | Depends on artistic skill | Consistently professional |
| Shareability | Physical limitations, requires scanning | Instant digital sharing and collaboration |
| Storage & Organization | Physical space required, can be lost | Cloud storage, searchable, never lost |
| Integration with Other Content | Difficult to combine with digital resources | Seamless integration with notes, slides, etc. |
One of the features I rely on most is PageOn.ai's Deep Search functionality, which helps me find and integrate subject-specific visuals into my study materials. This has been invaluable for creating comprehensive visual study guides that incorporate relevant diagrams, charts, and images.
I've also built a personal library of reusable visual templates for recurring concepts in my courses. These templates save me time and ensure consistency across my study materials. For example, I have standard templates for:
- Chemical reaction mechanisms
- Literary analysis frameworks
- Mathematical proof structures
- Historical cause-effect relationships
- Biological systems and processes
Using visual aids in presentation has also improved my academic performance when delivering class presentations. The ability to quickly create professional diagrams has made my presentations more engaging and effective at communicating complex ideas.
Memory Palace Techniques Enhanced with Visual Diagrams
One of the most powerful memory techniques I've discovered combines the ancient method of loci (memory palace) with modern visual diagrams. This hybrid approach has transformed my ability to memorize large volumes of information.
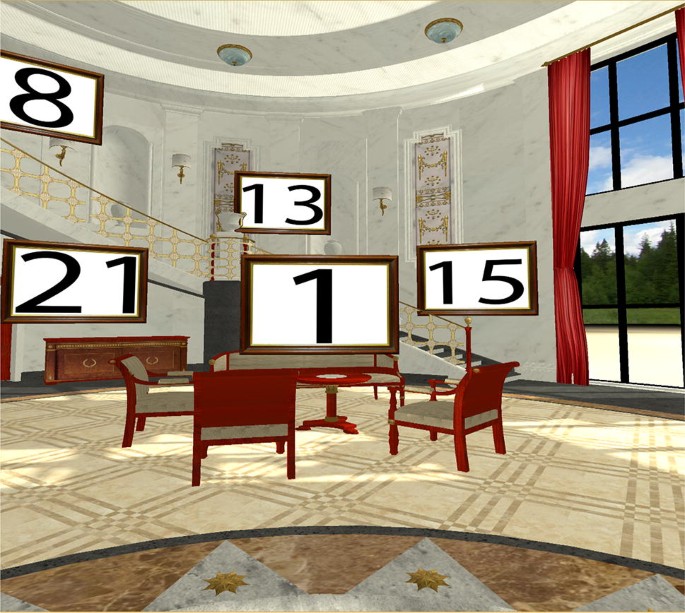
The memory palace technique involves mentally placing information in specific locations within a familiar space. By enhancing this technique with visual diagrams, I create memorable visual journeys that make information retrieval almost effortless during exams.
How I Create a Visual Memory Palace
- Choose a familiar location: I select a place I know well, like my home or campus
- Create a logical path: I establish a specific route through this location
- Design visual diagram "stations": At each point along the route, I place a visual diagram representing key information
- Add distinctive features: I enhance each diagram with unusual colors, animations, or interactions to make them more memorable
- Practice the journey: I mentally walk through the route multiple times, interacting with each visual station
Using PageOn.ai, I design custom memory palace visualizations that combine spatial memory techniques with powerful visual diagrams. This approach has been particularly effective for subjects requiring memorization of complex processes or large sets of related information.
                    flowchart TD
                        A[Memory Palace Location] --> B[Entrance Hall: Course Overview Diagram]
                        B --> C[Living Room: Key Theories Mind Map]
                        C --> D[Kitchen: Process Flowcharts]
                        D --> E[Dining Room: Comparative Data Tables]
                        E --> F[Study: Detailed Concept Maps]
                        F --> G[Bedroom: Timeline Visualizations]
                        G --> H[Bathroom: Quick Reference Charts]
                        H --> I[Garden: Interconnected Systems Diagram]
                        style A fill:#FF8000,stroke:#333,stroke-width:1px
                        style B fill:#FF9A3D,stroke:#333,stroke-width:1px
                        style C fill:#FFCC99,stroke:#333,stroke-width:1px
                        style D fill:#42A5F5,stroke:#333,stroke-width:1px
                        style E fill:#66BBFF,stroke:#333,stroke-width:1px
                        style F fill:#AB47BC,stroke:#333,stroke-width:1px
                        style G fill:#E57373,stroke:#333,stroke-width:1px
                        style H fill:#66BB6A,stroke:#333,stroke-width:1px
                        style I fill:#FFCA28,stroke:#333,stroke-width:1px
For my biology final exam, I created a memory palace where each room in my house contained specific visual diagrams related to different biological systems. The kitchen held diagrams of metabolic processes, the living room contained the circulatory system, and so on.
This technique is particularly powerful for encoding large volumes of information. By creating visual analogies test strategies within my memory palace, I can recall complex information through the power of visual association and spatial memory.
Measuring Success: Assessing the Impact of Visual Learning
After implementing visual learning techniques across multiple courses, I wanted to objectively measure their impact on my academic performance. The results have been remarkable and measurable.
In one of my most challenging courses, I tracked my performance before and after implementing visual learning techniques. As the chart shows, my grades improved dramatically as I refined my visual learning approach throughout the semester.
Case Studies and Success Stories
My Organic Chemistry Transformation
Organic chemistry was my most challenging course. After failing the first exam with traditional study methods, I completely revamped my approach:
- Before: Memorizing reactions and mechanisms as text descriptions
- After: Creating visual flowcharts of reaction pathways and color-coded mechanism diagrams
- Result: My grade improved from a D on the first exam to an A- on the final
Beyond grades, I've noticed other benefits from adopting visual learning techniques:
- Reduced study time: I spend about 30% less time studying while achieving better results
- Decreased test anxiety: Having strong visual memory anchors gives me confidence during exams
- Improved long-term retention: I can recall information from previous semesters with greater accuracy
- Enhanced understanding: I grasp complex concepts more deeply rather than just memorizing facts
To track my progress, I've created a personal visual learning journal where I document which techniques work best for different types of content. This ongoing assessment helps me continuously refine my approach and maximize the benefits of visual learning.
Practical Application: From Classroom to Exam Room
Creating visual study materials is only half the battle. The real test comes when you need to access that information during exams. I've developed specific strategies for leveraging visual learning techniques in high-pressure testing environments.

Preparing Visual Materials for Exam Success
As exam time approaches, I transform my visual learning materials into focused study guides and memory aids. This process involves:
- Condensing complex diagrams into simplified versions that capture key relationships
- Creating visual summaries that integrate multiple concepts into unified diagrams
- Developing visual mnemonics for formulas, sequences, and definitions
- Practicing mental reconstruction of key diagrams from memory
                    flowchart TD
                        A[Study Phase] --> B[Create Comprehensive Visual Materials]
                        B --> C[Practice Active Recall with Visuals]
                        C --> D[Create Condensed Visual Summaries]
                        D --> E[Exam Preparation]
                        E --> F[Mental Visualization Practice]
                        F --> G[Create Permitted Reference Materials]
                        G --> H[Exam Day]
                        H --> I[Access Visual Memory During Questions]
                        I --> J[Recreate Key Diagrams if Needed]
                        J --> K[Connect Concepts Visually]
                        style A fill:#FF8000,stroke:#333,stroke-width:1px
                        style B fill:#FF9A3D,stroke:#333,stroke-width:1px
                        style C fill:#FFCC99,stroke:#333,stroke-width:1px
                        style D fill:#FFE5CC,stroke:#333,stroke-width:1px
                        style E fill:#42A5F5,stroke:#333,stroke-width:1px
                        style F fill:#66BBFF,stroke:#333,stroke-width:1px
                        style G fill:#AB47BC,stroke:#333,stroke-width:1px
                        style H fill:#FF5252,stroke:#333,stroke-width:1px
                        style I fill:#66BB6A,stroke:#333,stroke-width:1px
                        style J fill:#FFCA28,stroke:#333,stroke-width:1px
                        style K fill:#FFCA28,stroke:#333,stroke-width:1px
Accessing Visual Memory During Exams
During exams, I use specific techniques to access the visual information I've stored:
My Exam Visualization Process
- Initial relaxation: I take a few deep breaths to reduce anxiety
- Mental navigation: I visualize navigating to the relevant section of my memory palace or diagram collection
- Visual reconstruction: I mentally recreate the key diagram related to the question
- Quick sketch: For complex questions, I quickly sketch the relevant diagram in the margin before answering
- Connection mapping: I visualize how different concepts connect to form a comprehensive answer
For exams where reference materials are permitted, I create visual cheat sheets that maximize the allowed space. These sheets use color coding, spatial organization, and visual hierarchies to pack the maximum amount of information into the available space.
Using PageOn.ai, I generate comprehensive visual study guides that integrate all the key concepts for finals. These guides serve as both study tools and, where permitted, reference materials during exams. The ability to quickly create professional-quality visual summaries has been invaluable for exam preparation.
The Future of Visual Learning in Education
As I look ahead to the future of education, it's clear that visual learning techniques will play an increasingly central role. Emerging technologies are making visual learning more accessible, interactive, and effective than ever before.

AI-powered tools like PageOn.ai are transforming student study methods by making advanced visualization techniques accessible to everyone, regardless of artistic ability or technical expertise. These tools democratize visual learning and allow students to focus on understanding content rather than struggling with diagram creation.
I predict that visual learning will become increasingly integrated into standard educational curricula as research continues to demonstrate its effectiveness. Schools and universities are already beginning to incorporate visual thinking techniques into their teaching methodologies.
Beyond academia, visual communication skills are becoming essential in professional environments. By mastering visual learning techniques now, students are preparing themselves for careers where the ability to create and interpret visual information will be a critical skill.
The combination of AI-powered tools, augmented reality, and advances in cognitive science is creating a perfect storm for visual learning innovation. As these technologies continue to evolve, I expect to see even more powerful and personalized visual learning techniques emerge.
Transform Your Visual Expressions with PageOn.ai
Ready to revolutionize your study methods with powerful visual diagrams? PageOn.ai makes it easy to create stunning visualizations that enhance understanding and boost memory retention.
Start Creating with PageOn.ai TodayConclusion: Your Visual Learning Journey
Throughout this guide, I've shared my personal journey with visual learning techniques and how they've transformed my academic performance. From the science behind visual memory to practical applications in the exam room, these methods have proven to be invaluable tools for student success.
As you begin your own visual learning journey, remember that finding the right techniques for your learning style and subject matter may take some experimentation. Start with simple diagrams and gradually incorporate more advanced techniques as you become comfortable with the process.
Tools like PageOn.ai can significantly accelerate this process by providing intuitive interfaces for creating professional-quality diagrams without requiring artistic or technical expertise. The ability to quickly transform complex information into clear visual expressions is a game-changer for academic performance.
I encourage you to start implementing these visual learning techniques in your studies today. Begin with one subject or topic that you find particularly challenging, and experiment with different diagram types to find what works best for you. The improvement in your understanding, retention, and exam performance will be well worth the effort.
You Might Also Like
Transforming Legal Reasoning: Visual Approaches to Modern Jurisprudence | PageOn.ai
Discover how visual approaches are revolutionizing legal reasoning in modern jurisprudence. Learn practical tools, methodologies, and technological innovations for enhanced legal analysis.
Creating Interactive and Animated Infographics for Enhanced User Engagement
Discover how to transform data into captivating interactive stories through animated infographics. Learn best practices, technical approaches, and tools for creating engaging visual experiences.
Transforming Industries with Language Models: From Summarization to Question Answering
Explore practical applications of language models from text summarization to question answering systems. Learn how LLMs are transforming healthcare, finance, e-commerce and more with PageOn.ai.
From Complexity to Clarity: Why Creators Are Trading Notion for Apple Notes
Discover why creators are simplifying their productivity systems by moving from Notion to Apple Notes, and how this digital minimalism enhances creative output and mental clarity.