Visualizing Real-Time Event Processing: Transforming Kafka Streaming Architectures into Intuitive Diagrams
Understanding the Foundation of Event-Driven Architecture
I've spent years working with event-driven architectures, and I've found that one of the biggest challenges is effectively communicating how these complex systems work. In this guide, I'll show you how to transform the intricate world of Kafka and streaming architectures into clear, intuitive visual representations that anyone can understand.
Understanding the Foundation of Event-Driven Architecture
Event-driven architecture (EDA) has become the backbone of modern real-time applications. Unlike traditional request-response models where clients wait for server responses, event-driven systems operate on a publish-subscribe model where components react to events as they occur.
                    flowchart LR
                        subgraph "Traditional Request-Response"
                            C1[Client] -->|Request| S1[Server]
                            S1 -->|Response| C1
                        end
                        subgraph "Event-Driven Architecture"
                            P[Producer] -->|Event| B[Event Broker]
                            B -->|Notify| C2[Consumer 1]
                            B -->|Notify| C3[Consumer 2]
                            B -->|Notify| C4[Consumer 3]
                        end
Comparison of traditional request-response vs. event-driven architecture patterns
I've found that the core components of event-driven architectures include:
- Events: Immutable records of something that happened in the system
- Event Producers: Components that generate events
- Event Brokers: Middleware that stores and routes events (like Kafka)
- Event Consumers: Components that react to events
The beauty of API integration patterns for AI is that they can be directly applied to event-driven architectures, creating powerful, responsive systems that can adapt in real-time.
Key Benefits of Event-Driven Architecture
When designing event-driven systems, I've found that visualizing the flow of events through the system helps stakeholders understand the architecture. Using tools like PageOn.ai's AI Blocks allows me to create clear visual representations of how events propagate through the system, making it easier to identify potential bottlenecks or optimization opportunities.

Kafka's Architecture: Visualizing the Backbone of Real-Time Processing
Apache Kafka serves as the central nervous system for event-driven architectures. To truly understand how Kafka enables real-time event processing, we need to visualize its distributed architecture.
                    flowchart TD
                        subgraph "Kafka Cluster"
                            B1[Broker 1] --- B2[Broker 2] --- B3[Broker 3]
                            subgraph "Topic A"
                                P0[Partition 0]
                                P1[Partition 1]
                                P2[Partition 2]
                            end
                            B1 --- P0
                            B2 --- P1
                            B3 --- P2
                            Z[ZooKeeper] --- B1
                            Z --- B2
                            Z --- B3
                        end
                        P[Producer] -->|Write| P0
                        P -->|Write| P1
                        P -->|Write| P2
                        P0 -->|Read| CG[Consumer Group 1]
                        P1 -->|Read| CG
                        P2 -->|Read| CG
Kafka's distributed architecture with brokers, topics, partitions, and consumer groups
The key components of Kafka's architecture that I always emphasize in my visualizations include:
Topics & Partitions
Topics are categories or feeds of messages, divided into partitions for parallel processing. Each partition is an ordered, immutable sequence of records.
Brokers
Kafka servers that store data and serve client requests. Each broker hosts some of the partitions and manages them.
Producers
Applications that publish events to Kafka topics, with the ability to choose specific partitions.
Consumers & Consumer Groups
Applications that subscribe to topics and process the events. Consumer groups enable parallel processing of events.
Let's visualize how data flows through a Kafka-based system:
                    sequenceDiagram
                        participant P as Producer
                        participant B as Kafka Broker
                        participant C as Consumer
                        P ->> B: Produce Event to Topic
                        Note over B: Store Event in Partition
                        B ->> B: Replicate to Followers
                        C ->> B: Poll for New Events
                        B ->> C: Return Events
                        Note over C: Process Events
                        C ->> B: Commit Offset
Sequence diagram showing the flow of data through Kafka
One of Kafka's most powerful features is its fault-tolerance mechanism. By maintaining multiple replicas of each partition across different brokers, Kafka ensures data durability even if individual brokers fail.
Kafka's Fault Tolerance Visualization

Kafka's replication mechanism ensures data durability even when brokers fail
When working with model context protocol data flow in AI systems, I've found that Kafka's architecture provides an excellent backbone for handling the high-volume, real-time data requirements of modern AI applications.
Stream Processing Frameworks: Beyond Basic Kafka
While Kafka provides the messaging infrastructure, stream processing frameworks add computational capabilities to transform, aggregate, and analyze event streams in real-time. Let's compare the most popular options:
Kafka Streams
Kafka Streams is a client library for building applications and microservices that process and analyze data stored in Kafka. It's directly integrated with Kafka, making it a natural choice for Kafka-based systems.
                    flowchart LR
                        subgraph "Kafka Streams Application"
                            S[Source] -->|"read()"| P[Processor]
                            P -->|"transform()"| P2[Processor]
                            P2 -->|"filter()"| P3[Processor]
                            P3 -->|"write()"| Sink[Sink]
                            SS[State Store] -.-> P2
                        end
                        KT[Kafka Topic] --> S
                        Sink --> KT2[Kafka Topic]
Kafka Streams architecture showing processor topology with stateful operations
Kafka Streams applications can be stateful or stateless:
Stateless Operations
- Filter
- Map
- FlatMap
- Branch
- ForEach
Process each record independently without needing to remember previous records.
Stateful Operations
- Aggregations
- Joins
- Windowing
- SessionWindows
- Custom state stores
Maintain state across multiple records and provide richer processing capabilities.
Apache Flink
Apache Flink is a powerful stream processing framework that excels at handling large volumes of data with low latency. Its advanced windowing capabilities make it particularly suitable for complex event processing scenarios.

One of Flink's most powerful features is its windowing operations, which allow for time-based processing of streams:
                    flowchart TD
                        subgraph "Apache Flink Windowing"
                            E[Event Stream] --> TW[Tumbling Window]
                            E --> SW[Sliding Window]
                            E --> SesW[Session Window]
                            E --> GW[Global Window]
                            TW --> Agg[Aggregation]
                            SW --> Agg
                            SesW --> Agg
                            GW --> Agg
                            Agg --> Out[Output Stream]
                        end
Different windowing strategies in Apache Flink for time-based processing
When building agentic workflows that require real-time data processing, I've found that integrating Flink with Kafka creates a powerful foundation for responsive, intelligent systems.
Building Real-Time Event Processing Pipelines
Creating effective event processing pipelines requires careful planning and a clear understanding of how components interact. Let's visualize the architecture of a complete real-time processing pipeline:
                    flowchart LR
                        subgraph "Data Sources"
                            S1[Web Events]
                            S2[IoT Devices]
                            S3[Database Changes]
                        end
                        subgraph "Ingestion Layer"
                            K[Kafka]
                        end
                        subgraph "Processing Layer"
                            KS[Kafka Streams]
                            F[Flink]
                        end
                        subgraph "Storage Layer"
                            DB[(Database)]
                            ES[(Elasticsearch)]
                            HDFS[(HDFS)]
                        end
                        subgraph "Visualization Layer"
                            D[Dashboards]
                            A[Alerts]
                        end
                        S1 --> K
                        S2 --> K
                        S3 --> K
                        K --> KS
                        K --> F
                        KS --> DB
                        KS --> ES
                        F --> HDFS
                        F --> ES
                        DB --> D
                        ES --> D
                        ES --> A
Complete real-time event processing pipeline architecture
Let's break down the implementation steps for building such a pipeline:
| Implementation Step | Key Components | Common Challenges |
|---|---|---|
| 1. Set up Kafka cluster | Brokers, ZooKeeper, Topics | Sizing, replication factor, partition count |
| 2. Implement data producers | Producer APIs, serialization | Schema design, error handling |
| 3. Build processing application | Streams API, topology design | Stateful operations, exactly-once processing |
| 4. Set up data sinks | Sink connectors, data mapping | Throughput, consistency guarantees |
| 5. Implement monitoring | Metrics collection, alerting | Visibility, performance bottlenecks |
Here's a sample code snippet for implementing a basic Kafka Streams application:
import org.apache.kafka.streams.StreamsBuilder;
import org.apache.kafka.streams.kstream.KStream;
StreamsBuilder builder = new StreamsBuilder();
// Read from the input topic
KStream<String, String> source = builder.stream("input-topic");
// Process the stream
KStream<String, String> processed = source
    .filter((key, value) -> value.contains("important"))
    .mapValues(value -> value.toUpperCase());
// Write to the output topic
processed.to("output-topic");
Data transformation is a critical aspect of event processing pipelines. Let's visualize how data can be enriched as it flows through the system:
                    flowchart LR
                        subgraph "Data Enrichment Flow"
                            R[Raw Event] -->|"Parse"| P[Parsed Event]
                            P -->|"Filter"| F[Filtered Event]
                            F -->|"Enrich"| E[Enriched Event]
                            E -->|"Aggregate"| A[Aggregated Event]
                            A -->|"Format"| O[Output Event]
                        end
                        subgraph "External Data Sources"
                            DS1[(User Database)]
                            DS2[(Product Catalog)]
                            DS3[(Geographic Data)]
                        end
                        DS1 -.-> E
                        DS2 -.-> E
                        DS3 -.-> E
Data transformation and enrichment flow in event processing
When implementing these pipelines, I've found that visualizing the agent-to-data connection mapping helps teams understand how different components interact and how data flows through the system.
Real-Time Event Processing Use Cases
State Management in Streaming Architectures
Managing state effectively is one of the most challenging aspects of building streaming applications. Let's visualize the difference between stateless and stateful processing:
                    flowchart TD
                        subgraph "Stateless Processing"
                            E1[Event] --> P1[Process]
                            E2[Event] --> P2[Process]
                            E3[Event] --> P3[Process]
                            P1 --> O1[Output]
                            P2 --> O2[Output]
                            P3 --> O3[Output]
                        end
                        subgraph "Stateful Processing"
                            SE1[Event] --> SP1[Process]
                            SE2[Event] --> SP2[Process]
                            SE3[Event] --> SP3[Process]
                            S[(State Store)]
                            SP1 <--> S
                            SP2 <--> S
                            SP3 <--> S
                            SP1 --> SO1[Output]
                            SP2 --> SO2[Output]
                            SP3 --> SO3[Output]
                        end
Comparison of stateless vs. stateful event processing
There are several approaches to implementing state stores in distributed streaming systems:
Local State Stores
State is stored locally on the processing node, typically using embedded databases like RocksDB.
Benefits: Low latency, high throughput
Challenges: Recovery after node failures
Remote State Stores
State is stored in external databases like Redis, Cassandra, or other distributed stores.
Benefits: Easier recovery, shared state
Challenges: Higher latency, network overhead
Kafka Streams provides built-in support for local state stores with fault tolerance through changelog topics:
                    flowchart TD
                        subgraph "Kafka Streams State Management"
                            P[Processor] <--> LS[(Local State Store)]
                            LS --> CT[Changelog Topic]
                            CT --> LS
                            subgraph "Fault Recovery"
                                FR[Failed Node]
                                NR[New Node]
                                CT --> NR
                                FR -. Replaced by .-> NR
                            end
                        end
Kafka Streams state management with changelog topics for fault tolerance
When designing stateful applications, it's important to consider these key aspects:
- State Size: How much data needs to be stored and accessed?
- Access Patterns: How frequently is state read and updated?
- Consistency Requirements: What level of consistency is needed?
- Recovery Time: How quickly must the system recover after failures?
- Scaling Strategy: How will state be redistributed when scaling?
State Management Patterns in Event-Driven Systems

Different patterns for managing state in distributed streaming applications
State management becomes particularly important when implementing event planning software that needs to track complex relationships between events, attendees, and resources in real-time.
Scaling and Performance Considerations
As event volumes grow, scaling becomes a critical concern. Let's visualize different scaling strategies for Kafka clusters:
                    flowchart TD
                        subgraph "Horizontal Scaling"
                            B1[Broker 1] --- B2[Broker 2]
                            B2 --- B3[Broker 3]
                            B3 --- B4[Broker 4]
                            B4 -.-> BN[Broker N]
                        end
                        subgraph "Vertical Scaling"
                            VB[Broker]
                            CPU[CPU +]
                            MEM[Memory +]
                            DISK[Disk +]
                            CPU --> VB
                            MEM --> VB
                            DISK --> VB
                        end
                        P[Producers] --> B1
                        P --> B2
                        P --> B3
                        B1 --> C[Consumers]
                        B2 --> C
                        B3 --> C
Horizontal vs. vertical scaling strategies for Kafka clusters
Partitioning is a key strategy for scaling Kafka topics. The number of partitions determines the maximum parallelism of your consumers:
Common performance bottlenecks in Kafka-based systems include:
Producer Bottlenecks
- Insufficient batching
- Synchronous sends
- Inefficient serialization
Broker Bottlenecks
- Disk I/O limitations
- Network bandwidth
- Unbalanced partitions
Consumer Bottlenecks
- Slow processing logic
- Inefficient state access
- Suboptimal partition assignment
To optimize performance, consider these strategies:
                    flowchart TD
                        subgraph "Performance Optimization Strategies"
                            P[Producer Optimizations]
                            B[Broker Optimizations]
                            C[Consumer Optimizations]
                            P --> P1[Increase batch.size]
                            P --> P2[Use async producers]
                            P --> P3[Optimize serialization]
                            B --> B1[SSD storage]
                            B --> B2[Increase replication factor]
                            B --> B3[Optimize JVM settings]
                            C --> C1[Increase fetch.min.bytes]
                            C --> C2[Parallel processing]
                            C --> C3[Optimize deserialization]
                        end
Strategies for optimizing Kafka performance at different levels
Kafka Scaling Case Study
Real-world example of scaling a Kafka cluster from handling 100K to 1M events per second
When designing for scale, it's important to plan ahead and build in monitoring capabilities that will help you identify bottlenecks before they become critical issues.
Real-World Implementation Patterns
Several architectural patterns have emerged as best practices for implementing event-driven systems. Let's visualize some of the most common patterns:
Event Sourcing Pattern
Event sourcing persists the state of a business entity as a sequence of state-changing events rather than just the current state.
                    flowchart LR
                        subgraph "Event Sourcing"
                            C[Command] --> ES[Event Store]
                            ES --> E1[Event 1]
                            ES --> E2[Event 2]
                            ES --> E3[Event 3]
                            ES -.-> EN[Event N]
                            E1 --> S[Current State]
                            E2 --> S
                            E3 --> S
                            EN -.-> S
                            S --> Q[Query]
                        end
Event sourcing pattern storing all state changes as events
CQRS (Command Query Responsibility Segregation)
CQRS separates read and write operations, allowing them to be optimized independently.
                    flowchart TD
                        subgraph "CQRS Pattern"
                            C[Client] --> CMD[Command API]
                            C --> Q[Query API]
                            CMD --> ES[Event Store]
                            ES --> P[Projector]
                            P --> RDB[(Read Database)]
                            Q --> RDB
                        end
CQRS pattern separating read and write paths
Saga Pattern
The Saga pattern manages failures in distributed transactions by defining compensating actions.
                    flowchart TD
                        subgraph "Saga Pattern"
                            O[Order Service] -->|CreateOrder| OT[Order Topic]
                            OT --> P[Payment Service]
                            P -->|PaymentProcessed| PT[Payment Topic]
                            PT --> I[Inventory Service]
                            I -->|InventoryReserved| IT[Inventory Topic]
                            IT --> S[Shipping Service]
                            S -->|OrderShipped| ST[Shipping Topic]
                            ST -.->|Failure| C[Compensation]
                            C -.-> S2[Cancel Shipping]
                            C -.-> I2[Release Inventory]
                            C -.-> P2[Refund Payment]
                            C -.-> O2[Cancel Order]
                        end
Saga pattern for managing distributed transactions with compensation
Integration Patterns for Existing Systems
When integrating event-driven architectures with existing systems, several patterns can be applied:
Decision Matrix for Architectural Patterns
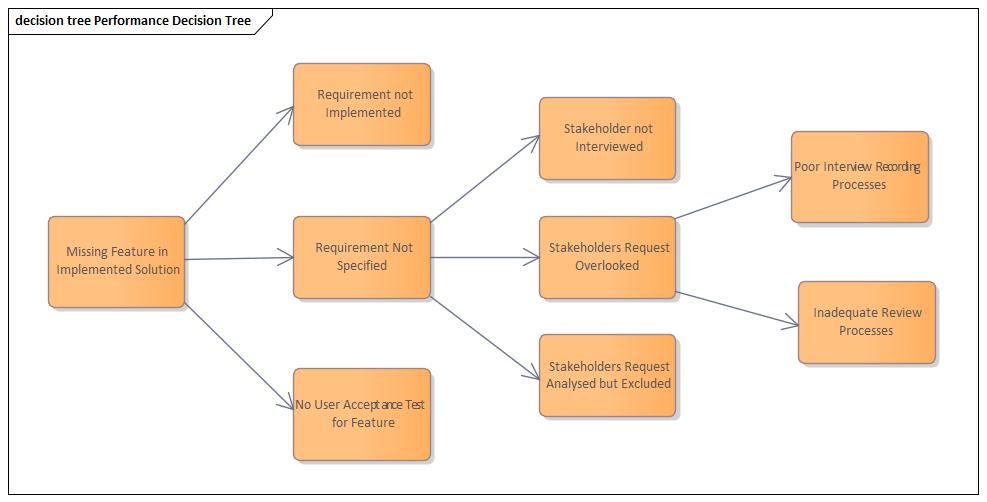
Decision tree for selecting the appropriate architectural pattern based on system requirements
When implementing these patterns, it's important to consider the specific requirements of your use case and the constraints of your existing systems.
Monitoring and Observability
Effective monitoring is essential for maintaining reliable event-driven systems. Let's visualize a comprehensive monitoring approach:
                    flowchart TD
                        subgraph "Monitoring Architecture"
                            K[Kafka Cluster]
                            A[Applications]
                            K -->|Metrics| M[Metrics Collector]
                            A -->|Metrics| M
                            K -->|Logs| L[Log Aggregator]
                            A -->|Logs| L
                            M --> TS[(Time Series DB)]
                            L --> ES[(Elasticsearch)]
                            TS --> D[Dashboards]
                            ES --> D
                            TS --> AL[Alerting]
                            ES --> AL
                            AL -->|Notification| N[Notification System]
                        end
Comprehensive monitoring architecture for event-driven systems
Key metrics to monitor in Kafka-based systems include:
Broker Metrics
- Under-replicated partitions
- Request rate and latency
- Disk usage and I/O
- Network throughput
- JVM memory usage
Consumer/Producer Metrics
- Consumer lag
- Record send/consume rate
- Request latency
- Error rate
- Rebalance events
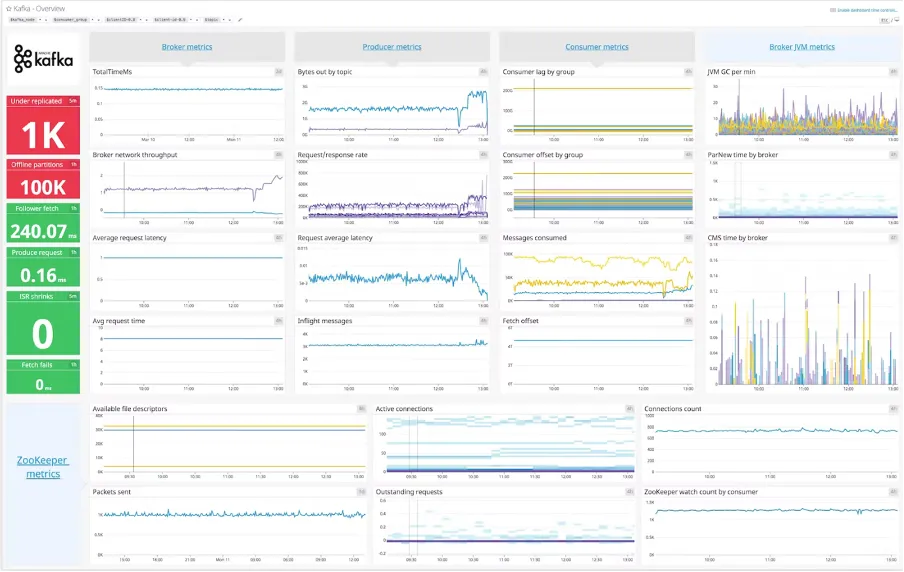
Let's visualize what an effective monitoring dashboard might look like:
Setting up proactive alerting is critical for identifying issues before they impact users:
| Alert Type | Threshold | Severity | Action |
|---|---|---|---|
| Consumer Lag | > 10,000 messages for 5 min | Warning | Investigate processing bottlenecks |
| Under-replicated Partitions | Any > 0 for 2 min | Critical | Check broker health and network |
| Disk Usage | > 85% | Warning | Plan capacity expansion |
| Error Rate | > 1% for 3 min | Critical | Check logs and recent changes |
Log aggregation and analysis are essential for troubleshooting issues in distributed systems:
                    flowchart LR
                        subgraph "Log Analysis Workflow"
                            L1[Application Logs] --> F[Log Forwarder]
                            L2[Kafka Logs] --> F
                            L3[System Logs] --> F
                            F --> A[Log Aggregator]
                            A --> I[Log Indexing]
                            I --> S[Search & Analysis]
                            S --> V[Visualization]
                            S --> C[Correlation]
                            C --> RCA[Root Cause Analysis]
                        end
Log analysis workflow for troubleshooting distributed systems
Health Check Dashboard
Implementing comprehensive monitoring and observability solutions is essential for maintaining reliable event-driven systems and quickly resolving issues when they arise.
Future Trends and Evolution
The world of event streaming and real-time processing continues to evolve. Let's visualize some of the emerging trends:
                    flowchart TD
                        subgraph "Future Trends"
                            AI[AI Integration]
                            S[Serverless Event Processing]
                            E[Edge Computing]
                            U[Unified Batch & Stream]
                            AI --> AIA[Real-time AI Model Training]
                            AI --> AIB[Intelligent Event Routing]
                            AI --> AIC[Anomaly Detection]
                            S --> SA[Event-driven Functions]
                            S --> SB[Auto-scaling]
                            E --> EA[IoT Event Processing]
                            E --> EB[Local Stream Processing]
                            U --> UA[Unified APIs]
                            U --> UB[Single Processing Framework]
                        end
Emerging trends in event streaming and real-time processing
Convergence of Event Streaming with AI and ML
The integration of AI and ML with event streaming platforms is creating powerful new capabilities:
AI-Enhanced Event Processing
- Real-time prediction: ML models deployed within the stream processing pipeline
- Intelligent routing: AI-based decisions on where events should be directed
- Anomaly detection: Identifying unusual patterns in real-time data streams
- Dynamic optimization: Automatically adjusting processing parameters based on current conditions
Evolution Toward Unified Streaming and Batch Processing
The distinction between batch and stream processing is increasingly blurring:
                    flowchart LR
                        subgraph "Traditional"
                            B[Batch Processing]
                            S[Stream Processing]
                            DB1[(Historical Data)] --> B
                            B --> DW1[(Data Warehouse)]
                            RT1[Real-time Data] --> S
                            S --> A1[Real-time Analytics]
                        end
                        subgraph "Unified Future"
                            UP[Unified Processing Framework]
                            DB2[(Historical Data)] --> UP
                            RT2[Real-time Data] --> UP
                            UP --> DW2[(Data Warehouse)]
                            UP --> A2[Real-time Analytics]
                        end
Evolution from separate batch and stream processing to unified frameworks
Future Roadmap for Event Processing

A forward-looking roadmap for the evolution of event processing technologies
As these technologies continue to evolve, the ability to effectively visualize and communicate complex event-driven architectures becomes increasingly important. Tools like PageOn.ai that help transform technical concepts into clear visual representations will be essential for teams working with these advanced systems.
Transform Your Visual Expressions with PageOn.ai
Ready to create stunning visualizations of your Kafka streaming architectures? PageOn.ai makes it easy to transform complex technical concepts into clear, engaging visual diagrams that anyone can understand.
Bringing It All Together
Throughout this guide, we've explored the intricate world of real-time event processing with Kafka and streaming architectures. From the fundamental concepts of event-driven design to advanced implementation patterns and future trends, we've seen how these technologies enable organizations to build responsive, scalable systems.
The key to success with these complex architectures lies in clear communication and understanding. By transforming technical concepts into intuitive visual representations, teams can better collaborate, troubleshoot issues, and design effective solutions.
PageOn.ai provides the tools you need to create these visual expressions, making it easier to communicate complex ideas and build shared understanding across your organization. Whether you're designing a new event-driven system, optimizing an existing one, or planning for future growth, effective visualization is essential for success.
Start creating your own visual representations today with PageOn.ai, and transform the way you communicate about Kafka and streaming architectures.
You Might Also Like
Mapping the Great Depression: Visualizing Economic Devastation and Recovery
Explore how data visualization transforms our understanding of the Great Depression, from unemployment heat maps to New Deal program impacts, bringing America's greatest economic crisis to life.
Unleashing the Power of Agentic Workflows: Visual Clarity for Complex AI Processes
Discover how to transform complex agentic workflows into clear visual representations. Learn to design, implement and optimize AI agent processes with PageOn's visualization tools.
Visualizing the AI Revolution: From AlphaGo to AGI Through Key Visual Milestones
Explore the visual journey of AI evolution from AlphaGo to AGI through compelling timelines, infographics and interactive visualizations that map key breakthroughs in artificial intelligence.
How AI Saves Marketing Teams 5+ Hours Weekly While Boosting Productivity 83% | Visual Content Revolution
Discover how AI transforms marketing workflows, saving 5+ hours weekly and boosting productivity by 83%. Learn visual content strategies that eliminate manual tasks and accelerate campaigns.