The Ultimate Guide to AI-Generated Diagrams
Types, Tools, and Practical Applications
I've spent years exploring how artificial intelligence transforms the way we visualize complex information. In this comprehensive guide, I'll walk you through the fascinating world of AI-generated diagrams—from understanding the core technology to exploring practical applications across industries. Let's discover how these powerful tools are revolutionizing visual communication.
Understanding AI-Generated Diagrams
In my experience working with visual communication tools, I've seen how AI-generated diagrams have transformed the way we express complex ideas. These intelligent systems use natural language processing (NLP) to convert text descriptions into structured visual representations, eliminating the need to manually arrange elements or master complex diagramming software.

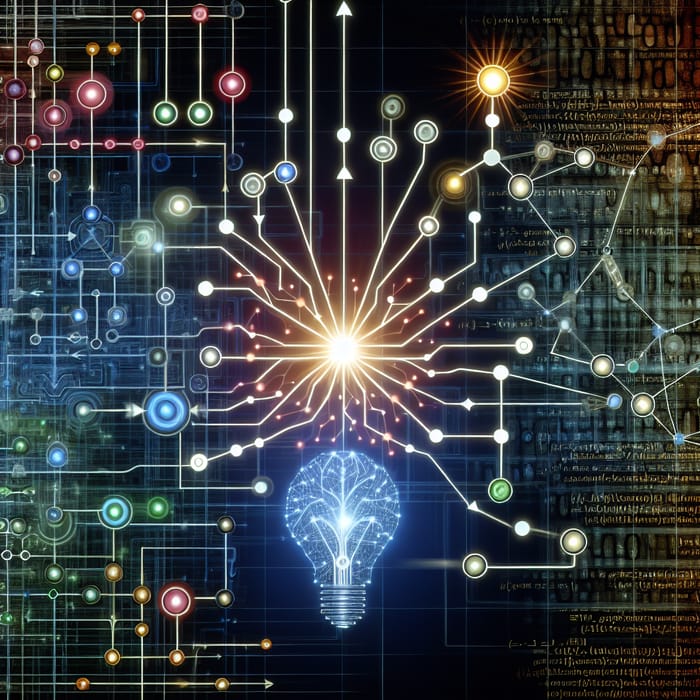
The evolution from manual diagramming to AI-assisted visual creation
What makes PageOn.ai's approach unique is how it transforms fuzzy concepts into structured visual diagrams through natural conversation. Rather than requiring precise technical instructions, I can simply describe what I want to visualize in everyday language, and the AI interprets my intent to create appropriate visual structures.
The AI Diagram Generation Process
Here's how the process typically works:
flowchart LR
    A[User Input] -->|Natural Language| B[NLP Processing]
    B --> C{Diagram Type Detection}
    C -->|Flowchart| D[Structure Analysis]
    C -->|Mind Map| E[Concept Extraction]
    C -->|Technical Diagram| F[Component Identification]
    D & E & F --> G[Visual Element Mapping]
    G --> H[Layout Generation]
    H --> I[Rendered Diagram]
    I -->|Feedback| A
The evolution from manual diagramming to AI-assisted visual creation represents a significant paradigm shift. Traditionally, creating diagrams required specialized skills and software knowledge. Now, with AI chart generators, the focus shifts from technical execution to conceptual thinking—allowing anyone to visualize their ideas without technical barriers.
Popular Types of AI-Generated Diagrams
In my work with various organizations, I've found that AI can generate an impressive range of diagram types. Let's explore some of the most useful categories and examples.
Flowcharts and Process Maps
Flowcharts are among the most commonly requested AI-generated diagrams. They excel at visualizing sequential steps, decision points, and workflow branches. When I need to document business processes or decision flows, AI-powered flowchart tools can interpret my description and generate the appropriate structure.
Example: Customer Onboarding Process
flowchart TD
    A[Customer Signs Up] --> B{Complete Profile?}
    B -->|Yes| C[Welcome Email]
    B -->|No| D[Send Reminder]
    C --> E[Product Tutorial]
    D --> F[Follow-up Call]
    E & F --> G[Account Setup]
    G --> H[First Project]
PageOn.ai's AI Blocks feature has been particularly valuable for me when creating flowcharts. I can describe the components verbally, and the system assembles them into a coherent structure, handling the proper placement of decision diamonds, process rectangles, and connecting arrows automatically.
Technical Diagrams
For technical documentation, I've found AI-generated diagrams to be incredibly time-saving. These include system architecture diagrams, network diagrams, and sequence diagrams that illustrate interactions between systems.
Example: Microservice Architecture
flowchart LR
    subgraph Client Layer
    A[Web Client] & B[Mobile App]
    end
    subgraph API Gateway
    C[API Gateway]
    end
    subgraph Services
    D[Auth Service]
    E[User Service]
    F[Content Service]
    G[Analytics Service]
    end
    subgraph Data Layer
    H[(User DB)]
    I[(Content DB)]
    J[(Analytics DB)]
    end
    A & B --> C
    C --> D & E & F & G
    D --> H
    E --> H
    F --> I
    G --> J
When working with technical diagrams, I often leverage PageOn.ai's Deep Search capability to incorporate relevant technical assets directly into my diagrams. This ensures accuracy and consistency with existing documentation while saving significant time.
Organizational and Hierarchical Visualizations
AI excels at creating structured hierarchical visualizations like org charts, mind maps, and other hierarchical structures. These diagrams help organize information in a way that clearly shows relationships and categories.
Example: Mind Map for Product Launch
Through natural conversation with PageOn.ai, I can describe organizational structures or conceptual relationships, and the system helps organize these ideas visually. This conversational approach feels much more intuitive than traditional diagramming methods where I'd need to manually position each element.
Planning and Project Management Diagrams
Project planning benefits tremendously from visual representations. AI can generate Gantt charts for timeline visualization, user journey maps for experience flows, and strategic planning matrices like SWOT analyses.
Example: Project Timeline Visualization
Using PageOn.ai's agentic capabilities, I can transform project requirements into visual plans simply by describing the key milestones, dependencies, and timelines. The system intelligently structures this information into appropriate visual formats that make project planning more intuitive and communicative.
Diagram Type Selection Guide
When deciding which diagram type to use, consider what relationships or processes you need to visualize:
| When You Need To Show | Best Diagram Type |
|---|---|
| Sequential steps or workflows | Flowchart |
| System components and connections | Architecture diagram |
| Related concepts or ideas | Mind map |
| Reporting structures | Org chart |
| Project schedules | Gantt chart |
| System interactions over time | Sequence diagram |
Understanding the diverse types of diagrams available through AI generation helps me choose the right visual format for each communication need.
The Technology Behind AI Diagram Generation
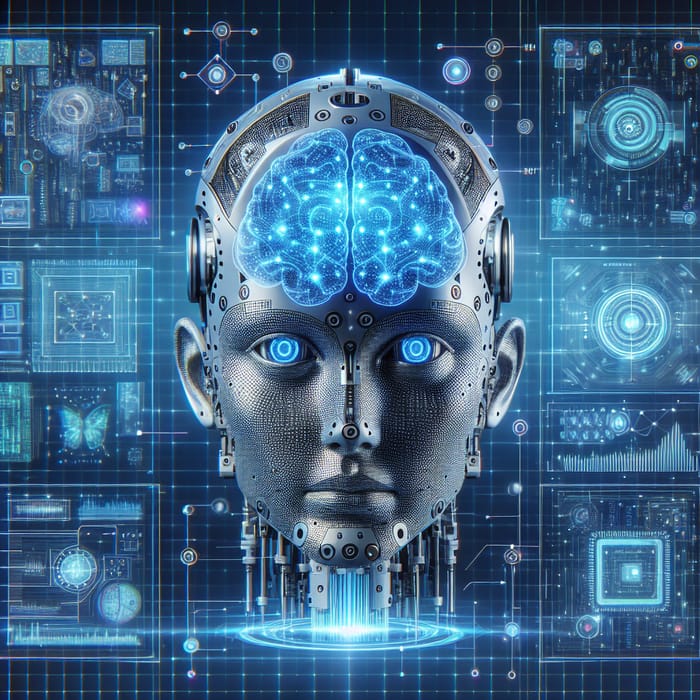
As I've delved deeper into AI-generated diagrams, I've become fascinated by the sophisticated technology that powers these systems. Understanding how they work helps me craft better prompts and get more precise results.
Visualization of how AI processes natural language to create diagram structures
Natural Language Processing Techniques
At the core of AI diagram generation is natural language processing (NLP). These systems analyze text instructions to identify key elements:
- Entity recognition to identify objects, actors, or components
- Relationship extraction to understand connections between entities
- Intent classification to determine the type of diagram needed
- Semantic analysis to understand the meaning and context of instructions
AI Diagram Generation Pipeline
sequenceDiagram
    participant User
    participant NLP as NLP Engine
    participant DT as Diagram Type Classifier
    participant ER as Entity Recognizer
    participant RM as Relationship Mapper
    participant VG as Visual Generator
    User->>NLP: "Create a flowchart for customer onboarding"
    NLP->>DT: Process text input
    DT->>NLP: Identify as flowchart request
    NLP->>ER: Extract entities
    ER->>NLP: Return entities (customer, signup, etc.)
    NLP->>RM: Map relationships between entities
    RM->>NLP: Return relationship structure
    NLP->>VG: Send structured data
    VG->>User: Generate visual diagram
Understanding Relationships Between Concepts
One of the most impressive aspects of advanced AI diagramming tools is how they understand relationships between concepts to create meaningful connections. The AI analyzes linguistic patterns like:
- Causal relationships ("X leads to Y" or "If X then Y")
- Hierarchical structures ("X consists of Y and Z")
- Sequential processes ("First X, then Y, finally Z")
- Conditional relationships ("When X occurs, Y happens unless Z")
Pattern Recognition in Diagram Generation
AI systems use pattern recognition to translate textual descriptions into appropriate visual elements. For instance, when I mention a "decision point" in a process description, the AI recognizes this pattern and knows to insert a diamond shape in a flowchart. Similarly, when describing hierarchical relationships, it automatically creates appropriate parent-child connections.
Common Diagram Elements Detected in Text
PageOn.ai's Conversational Approach
What sets PageOn.ai apart is its conversational approach to building diagrams. Rather than requiring a single, perfect prompt, the system engages in a dialogue to refine understanding. This iterative process feels more natural and results in more accurate visualizations.
For example, if I say "Create a diagram showing how our marketing team works with sales," PageOn.ai might ask clarifying questions about the specific relationship types, key handoff points, or whether I want to include other departments. This conversational refinement leads to more precise and useful visualizations than single-prompt systems.
Practical Applications Across Industries
In my work across different sectors, I've seen AI-generated diagrams solve visualization challenges in numerous fields. Let's explore some of the most impactful applications.
Software Development
For software development teams, AI-generated diagrams have become indispensable for quickly visualizing system architectures, code structures, and user flows.
Example: API Integration Flow
sequenceDiagram
    participant C as Client App
    participant AG as API Gateway
    participant AS as Auth Service
    participant DS as Data Service
    participant DB as Database
    C->>AG: Request data (with token)
    AG->>AS: Validate token
    AS-->>AG: Token valid
    AG->>DS: Forward request
    DS->>DB: Query data
    DB-->>DS: Return results
    DS-->>AG: Format response
    AG-->>C: Return JSON data
I've found that PageOn.ai streamlines technical documentation by allowing developers to quickly generate system architecture diagrams from requirements documents or user stories. This visual approach helps bridge the gap between technical and non-technical stakeholders, ensuring everyone shares the same understanding of system functionality.
Business Strategy and Planning
Strategic planning benefits tremendously from visual representations that can be quickly generated and iterated upon. AI-generated diagrams help convert abstract strategic initiatives into concrete visual roadmaps.
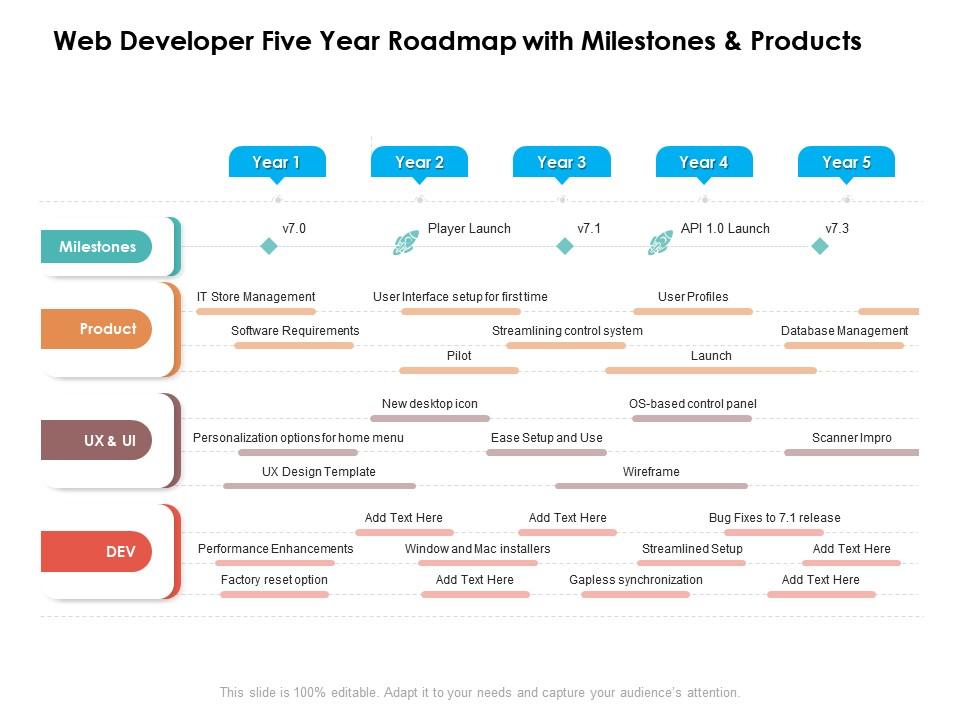
AI-generated strategic roadmap for a business expansion initiative
When working on business strategy, I use PageOn.ai to transform conceptual business ideas into shareable visual assets. For example, when developing competitive analyses, I can describe market positioning factors verbally, and PageOn.ai generates visual matrices that make strategic options much clearer for executive decision-making.
Education and Training
Educators and trainers can leverage AI-generated diagrams to create visual learning materials quickly. These visuals help students grasp complex concepts more effectively than text alone.
Learning Retention Comparison
In educational settings, I've seen how PageOn.ai helps create visual study guides from textual content. For example, a history teacher can describe a complex sequence of historical events, and PageOn.ai generates a timeline visualization that helps students understand cause-and-effect relationships more clearly than text descriptions alone.
Healthcare and Scientific Research
Healthcare professionals and researchers use AI-generated diagrams to visualize patient journeys, care protocols, and complex biological processes.
Example: Patient Care Pathway
flowchart TD
    A[Patient Intake] --> B{Initial Assessment}
    B -->|Urgent| C[Emergency Treatment]
    B -->|Non-urgent| D[Scheduled Consultation]
    C --> E{Stabilized?}
    E -->|Yes| F[Admission]
    E -->|No| G[Intensive Care]
    D --> H[Diagnosis]
    F --> H
    G --> F
    H --> I{Treatment Plan}
    I -->|Medication| J[Prescription]
    I -->|Surgery| K[Surgical Planning]
    I -->|Therapy| L[Therapy Sessions]
    J & K & L --> M[Follow-up Care]
    M --> N{Recovery Complete?}
    N -->|Yes| O[Discharge]
    N -->|No| P[Adjust Treatment]
    P --> M
In healthcare settings, PageOn.ai's Deep Search capability is particularly valuable for integrating relevant medical imagery and established protocols into new visualizations. This ensures that AI-generated diagrams align with established medical standards while making complex care pathways more accessible to patients and providers alike.
Across all these industries, ai graphic generators like PageOn.ai are transforming how professionals communicate complex information, making sophisticated visualization accessible without specialized design skills.
Benefits and Limitations of AI-Generated Diagrams
As with any technology, AI-generated diagrams come with both significant advantages and some current limitations. Understanding both helps set realistic expectations and identify the best use cases.
Key Advantages
Time Savings Comparison
In my experience, the time efficiency of AI-generated diagrams compared to manual creation is remarkable. What might take an hour or more to create manually can often be generated in minutes with AI assistance.
Another major advantage is accessibility for non-designers and technical teams. Not everyone has specialized design skills, but with AI diagram tools, anyone can produce professional-quality visualizations. This democratizes the creation of visual assets across organizations.
Consistency in visual representation across projects is another benefit I've noticed. When multiple team members use the same AI tool to generate diagrams, there's a natural standardization of visual style that helps maintain a cohesive look across documentation.
Current Limitations
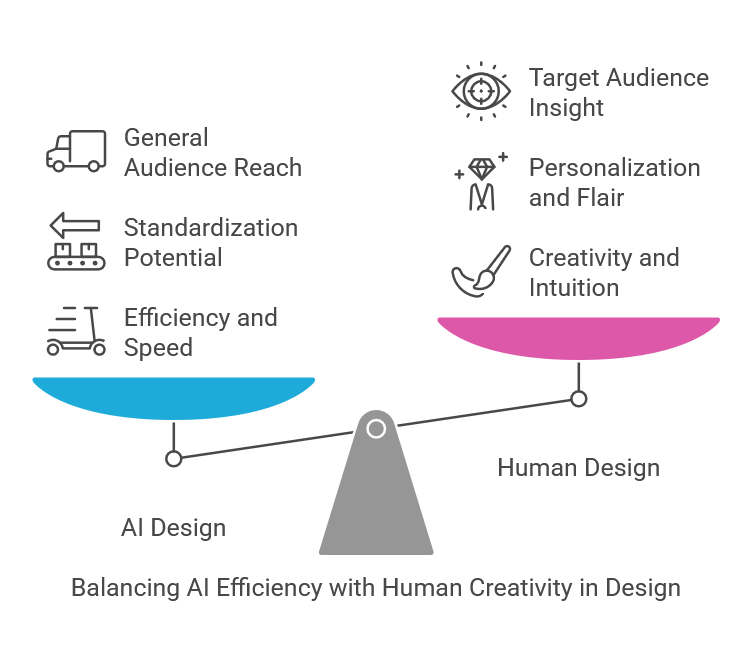
Comparison of AI-generated and human-designed specialized diagrams
While AI diagram generation has advanced significantly, I've found it still has some limitations when handling extremely specialized or novel diagram types. Domain-specific visualizations with unique conventions might require human refinement after initial AI generation.
Fine-tuning complex visual aesthetics can also be challenging. While basic diagram structure is handled well, achieving specific design styles or complex visual hierarchies might require additional manual adjustments.
Balancing automation with customization needs remains an ongoing challenge. Sometimes the efficiency of AI generation needs to be balanced with the need for customized visual representations that precisely match specific requirements.
How PageOn.ai Addresses Common Limitations
- Conversational refinement: Instead of one-shot generation, PageOn.ai's dialogue-based approach allows for iterative improvement
- Visual style options: Multiple style presets help match organizational branding and documentation standards
- Hybrid creation: AI-generated initial structures can be manually refined while maintaining the time savings
- Learning capability: The system improves with feedback, adapting to your specific visualization needs over time
Best Practices for Creating Effective AI-Generated Diagrams
Through my experience working with AI diagram tools, I've developed several strategies to get the most effective results. These best practices help bridge the gap between what you envision and what the AI creates.
Crafting Clear, Detailed Prompts
The quality of AI-generated diagrams depends significantly on the clarity of your instructions. I've found that following these guidelines produces the best results:
Prompt Structure Template
1. Specify diagram type: "Create a [type] diagram showing..."
2. Define key elements: "Include these components: [list]"
3. Explain relationships: "Component A connects to B and C"
4. Note hierarchy if applicable: "A contains sub-elements X and Y"
5. Mention style preferences: "Use [color scheme/style]"
6. Specify audience: "For [technical/non-technical] audience"
Being specific about diagram type, components, relationships, and desired style significantly improves results. For example, instead of saying "Create a diagram about our sales process," I might say "Create a flowchart showing our 5-step sales process from lead generation through follow-up, highlighting decision points where leads may exit the funnel, using our brand colors of blue and orange."
Strategies for Iterative Refinement
Getting the perfect diagram often requires iteration. I approach this as a conversation with the AI:
Iterative Refinement Process
flowchart TD
    A[Initial Prompt] --> B[First Generation]
    B --> C{Review Result}
    C -->|"Needs Changes"| D[Specific Feedback]
    C -->|"Looks Good"| E[Final Diagram]
    D --> F[Refined Prompt]
    F --> G[Regeneration]
    G --> C
When refining diagrams, I focus on specific aspects that need improvement rather than completely restarting. For example, "The overall structure looks good, but please add a decision point after the 'Customer Review' stage and reorganize the feedback loop to return to the 'Product Adjustment' stage."
Combining AI Generation with Human Customization
I've found that the most effective approach is often a hybrid one. AI excels at quickly creating the initial structure, while human refinement adds the nuance and domain-specific details that might be missing:
| Stage | AI Responsibility | Human Responsibility |
|---|---|---|
| Initial structure | Generate basic diagram layout | Provide clear instructions |
| Content accuracy | Place elements based on description | Verify factual correctness |
| Visual refinement | Apply consistent styling | Adjust for brand guidelines |
| Domain expertise | Follow standard conventions | Add specialized notations |
Using PageOn.ai's Conversational Approach
PageOn.ai's conversational interface offers unique advantages for refining diagrams. Rather than trying to perfect a single prompt, I can have a natural dialogue to iteratively improve the visualization:
Sample Conversation Flow
Me: "Create a flowchart showing our content approval process."
PageOn.ai: "I'll create that for you. Could you tell me the main stages in your content approval process?"
Me: "It starts with content creation, then goes to editor review, then legal approval if needed, and finally publishing."
PageOn.ai: "Got it. Are there any decision points where content might be sent back for revision?"
Me: "Yes, both the editor and legal can send it back to the creator for revisions."
PageOn.ai: [Generates initial diagram]
Me: "That looks good, but can you add a final approval from the department head after legal review?"
PageOn.ai: [Updates diagram with the new step]
This conversational approach feels much more natural than trying to craft the perfect prompt, and it leads to more accurate diagrams that truly reflect your intent. The ability to refine details through dialogue is particularly valuable for complex visualizations where all requirements might not be clear from the beginning.
The Future of AI-Generated Diagrams
As I look ahead to what's coming in the field of AI-generated diagrams, several exciting trends and developments are emerging that will further transform how we create and use visual representations.
Emerging Trends in Visual AI
The field of AI-generated diagrams is evolving rapidly, with several key trends emerging:
Conceptual visualization of future AI diagram technologies
- Multimodal inputs: Future systems will combine text instructions with sketches, voice commands, and even gestures to create more intuitive diagram generation
- Domain-specific expertise: AI systems are developing deeper knowledge of specialized fields, enabling more accurate technical diagrams without human refinement
- 3D and interactive visualizations: Moving beyond static 2D diagrams to interactive, explorable visual representations
- Adaptive styling: Automatic application of brand guidelines and visual styles without manual specification
Integration with Real-Time Data Sources
One of the most promising developments I'm seeing is the integration of AI-generated diagrams with live data sources. This creates dynamic visualizations that update automatically as underlying data changes.
Dynamic Data Integration Architecture
flowchart TD
    A[(Data Sources)] --> B[Data Processing API]
    B --> C[AI Diagram Generator]
    C --> D[Dynamic Visualization]
    E[User Input] --> C
    F[Update Triggers] --> B
    D --> G{Viewer Interaction}
    G --> H[Detail Expansion]
    G --> I[Filter Application]
    G --> J[Data Exploration]
Imagine a system architecture diagram that automatically updates when new microservices are deployed, or a project timeline visualization that reflects real-time progress updates. This integration of generate ai vector graphics with live data sources will make diagrams more valuable as living documents rather than static snapshots.
Collaborative AI Diagramming
The future of AI diagramming is increasingly collaborative, with systems that can facilitate team-based visual creation:
- Multi-user input processing: Combining instructions and feedback from multiple team members
- Role-based contributions: Allowing different team members to focus on their areas of expertise
- Version control and change tracking: Managing the evolution of diagrams over time
- Contextual awareness: Understanding organizational context and previous diagram history
These collaborative capabilities will transform diagrams from individual creations to team knowledge artifacts that evolve with collective input and expertise.
PageOn.ai: Pioneering the Next Generation
PageOn.ai is at the forefront of this evolution in visual content creation through AI. Its approach focuses on several key innovations:
PageOn.ai Innovation Focus Areas
By focusing on conversational creation, deep knowledge integration, and adaptive learning, PageOn.ai is creating a more natural and effective way to generate visual content. The system continuously improves based on user interactions, developing a deeper understanding of specific domains and individual preferences over time.
As these technologies continue to evolve, we'll see AI-generated diagrams become increasingly sophisticated, interactive, and integrated into our workflows—making visual communication more accessible and effective for everyone, regardless of design expertise.
Transform Your Visual Expressions with PageOn.ai
Ready to revolutionize how you create diagrams? PageOn.ai's conversational AI makes it effortless to transform complex concepts into clear, professional visualizations—no design skills required.
Start Creating with PageOn.ai TodayLooking Ahead: The Visual Communication Revolution
As we've explored throughout this guide, AI-generated diagrams represent a fundamental shift in how we approach visual communication. From flowcharts and technical diagrams to mind maps and strategic visualizations, these tools democratize the creation of powerful visual assets.
I've witnessed firsthand how PageOn.ai's conversational approach to diagram creation removes barriers and accelerates the process of transforming ideas into clear visual expressions. By combining natural language processing with visual intelligence, PageOn.ai makes it possible for anyone—regardless of design background—to create professional-quality diagrams that communicate complex concepts effectively.
As AI diagram technology continues to evolve, we can expect even more intuitive creation processes, deeper integration with data sources, and more specialized domain knowledge. The future of visual communication is one where our ideas can be expressed visually with the same ease and fluency as we express them verbally—and PageOn.ai is leading the way in making that future a reality.
You Might Also Like
Legal Interpretation Theory: From Textual Analysis to Visual Meaning-Making | PageOn.ai
Explore the evolution of legal interpretation theory from strict textualism to constructive meaning-making, and discover how visual tools transform complex legal reasoning into accessible frameworks.
Platform-Specific Infographic Formatting: Optimize for Social Media Success
Master platform-specific infographic formatting for Instagram, Pinterest, LinkedIn, Twitter & Facebook. Learn optimal dimensions, aspect ratios & design strategies for social media success.
Visualizing the CIA Triad: A Modern Framework for Cybersecurity Success
Discover how the CIA triad (Confidentiality, Integrity, Availability) forms the foundation of modern cybersecurity. Learn implementation strategies and visualization techniques for security success.
Transforming Industries with Language Models: From Summarization to Question Answering
Explore practical applications of language models from text summarization to question answering systems. Learn how LLMs are transforming healthcare, finance, e-commerce and more with PageOn.ai.