Elevating Team Productivity: Collaborative Features Reshaping Modern Spreadsheet Applications
The Evolution of Spreadsheet Collaboration
I've watched spreadsheets transform from static files passed around via email to dynamic collaboration hubs that serve as the backbone of modern teamwork. Today, I'll explore how these collaborative features are revolutionizing the way teams work with data, solve problems, and make decisions together.
The Evolution of Spreadsheet Collaboration
I've witnessed a remarkable transformation in how we work with spreadsheets over the past decade. What was once a solitary experience of downloading files, making changes, and emailing them back has evolved into a dynamic, collaborative process that happens in real-time.
The shift from email attachments to cloud-based simultaneous editing has fundamentally changed our relationship with spreadsheets. No longer are they static repositories of information—they've become living documents that serve as collaboration hubs for entire teams.
Modern spreadsheet applications have positioned themselves as central to team workflows, acting as the backbone for everything from project management to financial modeling. This evolution addresses several key pain points that plagued traditional spreadsheet collaboration:
- Version control nightmares (which file is the latest?)
- Conflicting edits requiring manual reconciliation
- Lack of visibility into who changed what and when
- Difficulty gathering feedback from multiple stakeholders
- Limited access when away from your primary device
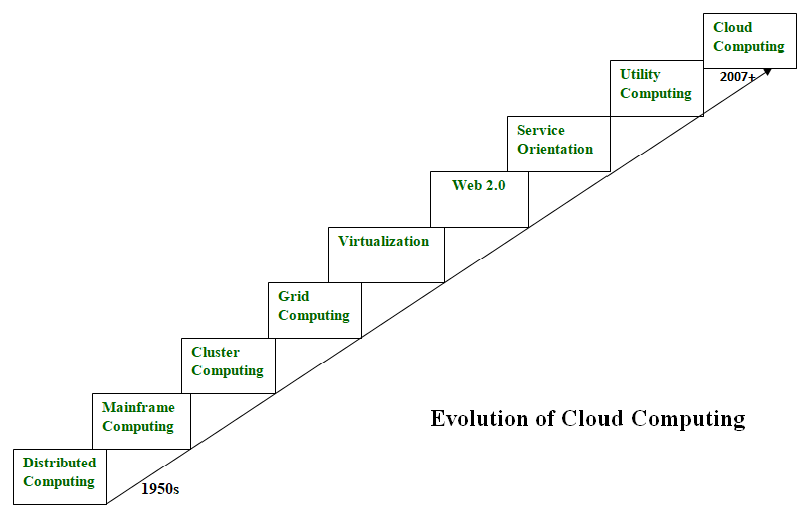
Spreadsheet Evolution Timeline
As we've moved into the cloud era, I've found that the most successful teams are those that embrace these collaborative features fully, establishing new workflows that leverage the real-time nature of modern spreadsheet applications. The result is faster decision-making, fewer errors, and more inclusive analysis processes where everyone's input can be captured efficiently.
Core Collaborative Features Transforming Spreadsheets
The foundation of modern spreadsheet collaboration rests on several key features that have fundamentally changed how teams interact with data. Let's explore the most impactful ones:
Real-time co-authoring capabilities
I've found that simultaneous editing without version conflicts has been perhaps the most transformative feature in modern spreadsheets. Multiple team members can now work on the same document concurrently, with changes appearing in near real-time. This eliminates the frustration of conflicting copies and dramatically speeds up collaborative work.

Presence awareness features show exactly who is viewing or editing the document at any given moment. User attribution through colored cursors and edit indicators helps teams coordinate their efforts and avoid stepping on each other's toes. These features create a sense of "virtual presence" that mimics the experience of collaborating around a physical table.
When working with complex spreadsheets, I've found that real-time visual collaboration tools like PageOn.ai's Vibe Creation enable natural conversation-based collaboration. This approach allows team members to discuss changes, share insights, and make decisions together in a more intuitive way than traditional spreadsheet interfaces allow.
Real-Time Collaboration Flow
flowchart TD
    A[User 1 Makes Change] -->|Real-time sync| B[Central Cloud Document]
    C[User 2 Makes Change] -->|Real-time sync| B
    D[User 3 Makes Change] -->|Real-time sync| B
    B -->|Updates visible to all| A
    B -->|Updates visible to all| C
    B -->|Updates visible to all| D
    B -->|Conflict resolution| E[Merged Changes]
    E -->|Version history| F[Recoverable States]
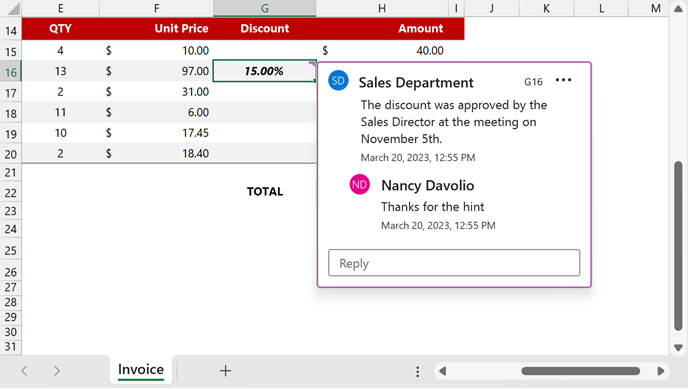
Comment and feedback systems
Modern comment systems have evolved far beyond simple notes in cells. I regularly use @mentions to direct questions or tasks to specific team members, turning spreadsheets into actionable workflow tools. These mentions typically trigger notifications, ensuring that nothing falls through the cracks.
Assigned action items take this a step further, creating trackable tasks within the context of the data itself. This integration of task management into spreadsheets eliminates the need to switch between multiple tools during data analysis and decision-making processes.
Thread-based discussions within cells and ranges allow for focused conversations about specific data points or calculations. I've found this particularly valuable when working with complex financial models or forecasts where context is crucial for understanding the numbers.
Version history and change tracking
The ability to view and restore previous versions of a spreadsheet provides a safety net that encourages experimentation and prevents data loss. I often use snapshot comparison features to understand what changed between versions, which is invaluable when troubleshooting formula errors or unexpected data shifts.
Edit attribution and audit trails create accountability and transparency in collaborative environments. When working with financial data or other sensitive information, these features help maintain governance and compliance by documenting who made specific changes and when.
For complex version comparisons, I've found that using PageOn.ai's AI Blocks to visually compare version differences makes it much easier to understand the evolution of a spreadsheet over time. These visual representations highlight patterns and significant changes that might be missed when looking at raw data alone.
Collaborative Feature Adoption
Advanced Sharing Controls for Enterprise Needs
As spreadsheets have evolved into mission-critical collaboration tools, the need for sophisticated sharing and access controls has grown exponentially. Enterprise environments in particular demand granular permissions and robust security features.
Permission management frameworks
I've found that granular access controls are essential for managing large-scale collaborative spreadsheets. The ability to assign specific permissions—view, comment, edit, or admin—allows teams to share data widely while protecting its integrity.
| Permission Level | Can View | Can Comment | Can Edit | Can Share | Can Manage Access |
|---|---|---|---|---|---|
| Viewer | ✓ | ✗ | ✗ | ✗ | ✗ |
| Commenter | ✓ | ✓ | ✗ | ✗ | ✗ |
| Editor | ✓ | ✓ | ✓ | ✓ | ✗ |
| Admin | ✓ | ✓ | ✓ | ✓ | ✓ |
Cell-level and sheet-level protection options provide even finer control, allowing certain parts of a spreadsheet to be locked while others remain editable. This is particularly valuable for templates or reports where some data should remain fixed while other sections are designed for input.
Dynamic permission groups and inheritance structures help manage access at scale. In large organizations, I've seen how these features simplify administration by allowing permissions to flow from parent folders to child documents or from team structures to individual files.
Permission Inheritance Structure
flowchart TD
    A[Organization Level] -->|Inherits| B[Department Level]
    A -->|Inherits| C[Project Level]
    B -->|Inherits| D[Team Level]
    B -->|Inherits| E[Individual Level]
    C -->|Inherits| F[Document Level]
    D -->|Inherits| F
    E -->|Inherits| F
    F -->|Granular Control| G[Sheet Level]
    F -->|Granular Control| H[Range Level]
    F -->|Granular Control| I[Cell Level]
External sharing protocols
Secure link generation with expiration dates has become a standard feature for sharing spreadsheets outside the organization. I always recommend using these time-limited links when sharing sensitive information to reduce the risk of unauthorized access in the future.
Embedding options for reports and dashboards allow teams to integrate live spreadsheet data into other platforms like internal websites, wikis, or presentation tools. This ensures that everyone is always looking at the most current information without needing to access the original spreadsheet.
For teams looking to standardize their sharing practices, PageOn.ai's Deep Search integration helps find relevant sharing templates that match the content and sensitivity of the data being shared. This promotes consistency in how information is presented and protected across the organization.
Compliance and governance considerations
Data residency and sovereignty controls have become increasingly important as regulatory requirements evolve. Modern spreadsheet platforms now offer options to specify where data is stored geographically, helping organizations comply with regional data protection laws.
Audit logging for sensitive information creates a transparent record of who accessed what data and when. These logs are invaluable for compliance reporting and for investigating any potential data breaches or unauthorized access.
Regulatory alignment features help organizations meet specific compliance requirements such as GDPR, HIPAA, or SOX. These may include data classification tools, retention policies, or enhanced encryption options for particularly sensitive spreadsheets.
Security Feature Implementation by Industry
Visual Collaboration Beyond Numbers
Modern spreadsheet applications have evolved far beyond simple grids of numbers. They now incorporate powerful visualization capabilities that transform raw data into compelling visual stories that teams can collaborate on directly.
Integrated data visualization tools
Real-time chart collaboration features allow multiple team members to create and refine visualizations simultaneously. I've found this particularly valuable during analysis sessions where the team needs to explore different ways of presenting data to uncover insights.
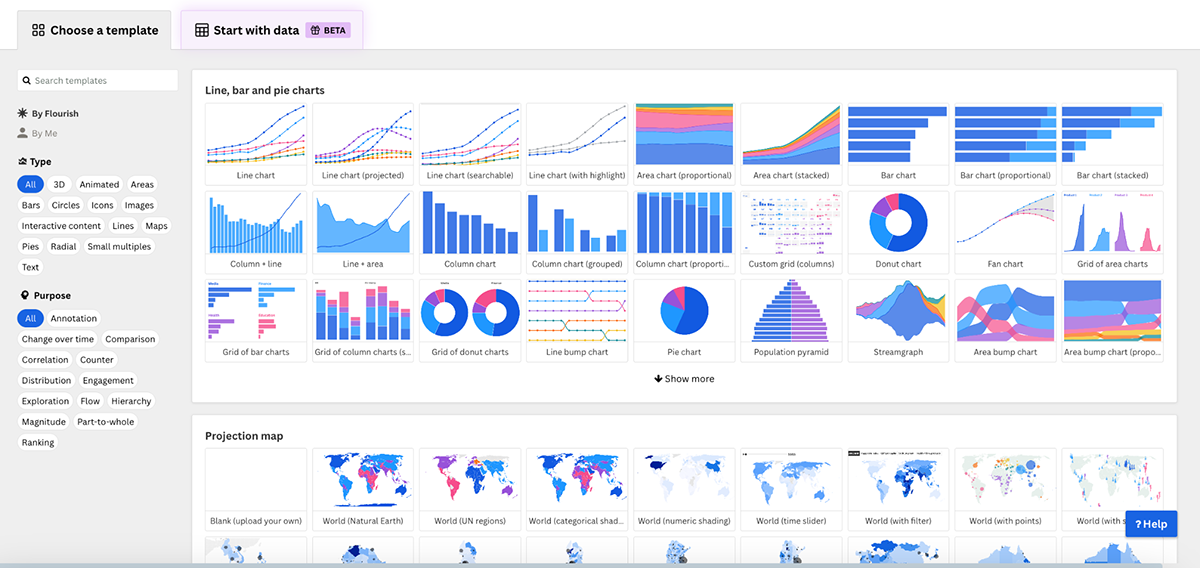
When working with complex data sets, I often use data visualization in Excel and similar tools to transform spreadsheet data into compelling visuals. These visualizations make patterns and trends immediately apparent, facilitating faster and more informed decision-making.
Annotation and markup capabilities for visual elements allow team members to highlight specific aspects of charts or graphs, adding context and insights directly to the visualization. This creates a richer, more nuanced understanding of what the data is telling us.
Visualization Type Effectiveness
Dashboard creation and sharing
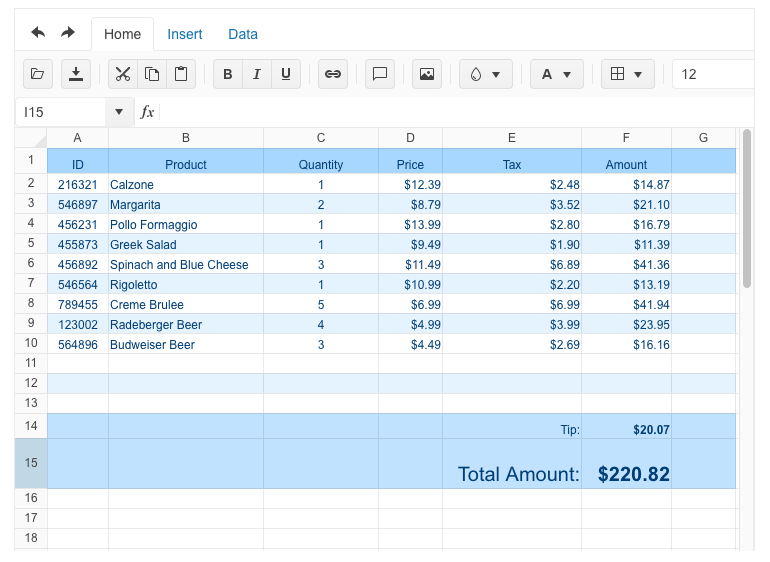
Cross-sheet data presentation solutions allow teams to create comprehensive dashboards that pull information from multiple sources into a single, coherent view. This provides executives and decision-makers with a holistic perspective without needing to navigate through multiple spreadsheets.
Interactive filtering for shared viewers transforms static reports into dynamic tools that recipients can customize to focus on the specific information they need. I've found this particularly valuable when creating dashboards for diverse stakeholders with different information priorities.
For teams looking to create more sophisticated visualizations, PageOn.ai's AI Blocks can transform static dashboards into dynamic visuals that adapt to changing data and user interactions. These intelligent components bring spreadsheet data to life in ways that traditional charts and graphs cannot match.
Presentation mode features
Converting spreadsheet insights into presentation slides has become seamless in modern applications. This integration between analysis and communication tools streamlines the process of sharing findings with broader audiences.
Live data linking for always-updated presentations ensures that when you present information from a spreadsheet, you're always showing the most current data. This eliminates the risk of presenting outdated information when the underlying data changes.
I've found that using ai tools for excel charts and PageOn.ai to create narrative-driven data stories from spreadsheets helps transform raw numbers into compelling narratives that drive action. These tools help bridge the gap between analysis and persuasion, making data more accessible and impactful for all audiences.
From Data to Decision Flow
flowchart LR
    A[Raw Data] -->|Collaborative Analysis| B[Processed Data]
    B -->|Visualization Tools| C[Interactive Charts]
    B -->|Dashboard Builder| D[Executive Dashboard]
    C -->|Annotation & Discussion| E[Team Insights]
    D -->|Filtering & Exploration| E
    E -->|Presentation Creation| F[Narrative Slides]
    E -->|Report Generation| G[Detailed Reports]
    F -->|Stakeholder Meeting| H[Decision Making]
    G -->|Distribution| H
Integration with Broader Collaboration Ecosystems
Modern spreadsheets don't exist in isolation—they're part of a broader ecosystem of collaboration tools. The most effective implementations seamlessly connect spreadsheets with other platforms to create unified workflows.
Chat platform integrations
Connections to Slack, Teams, and other messaging platforms allow spreadsheet activities to flow into the communication channels where teams already spend much of their day. I've found this integration particularly valuable for maintaining awareness of important spreadsheet updates without requiring constant checking.

Notification systems and alerts keep team members informed about important changes, comments, or @mentions. These can be configured at various levels of granularity to ensure people receive relevant updates without being overwhelmed by notifications.
For teams that communicate primarily through chat platforms, using PageOn.ai to create visual summaries for team channels helps translate complex spreadsheet data into easily digestible visual snippets that can be quickly understood in a chat context.
Project management tool connections
Task creation from spreadsheet data bridges the gap between analysis and action. When insights from data analysis reveal necessary tasks, these can be automatically or manually created in project management tools like Asana, Trello, or Monday.com.
Timeline visualization and Gantt chart features transform spreadsheet data into project plans with clear dependencies and milestones. This creates a natural flow from data analysis to project execution.
Bidirectional updates between systems ensure that changes made in either the spreadsheet or the project management tool are reflected in both places. This synchronization eliminates the need for manual updates and reduces the risk of working with outdated information.
Integration Ecosystem Usage
Document ecosystem integration
Connecting spreadsheets with related documents and presentations creates a cohesive information ecosystem. When I work on complex projects, I find it invaluable to be able to link directly from a spreadsheet cell to a relevant section of a document or slide in a presentation.
Cross-reference capabilities between collaboration tools help maintain context and connections between related pieces of information. This creates a web of interconnected knowledge rather than isolated documents.
PageOn.ai's Agentic features help maintain consistency across document types by automatically updating related content when changes are made in a spreadsheet. This ensures that presentations, reports, and other documents that reference spreadsheet data remain accurate and up-to-date.
Collaborative Ecosystem Connections
flowchart TD
    A[Spreadsheet Application] <-->|Data Exchange| B[Document Editor]
    A <-->|Task Creation| C[Project Management]
    A <-->|Notifications & Updates| D[Chat Platform]
    A <-->|Presentations| E[Slide Deck]
    A <-->|Data Storage| F[Cloud Storage]
    B <-->|Citations & References| E
    C <-->|Task Updates| D
    D <-->|File Sharing| F
    F <-->|Version Control| B
    F <-->|Asset Storage| E
Mobile and Cross-Platform Collaboration
As work becomes increasingly distributed and flexible, the ability to collaborate on spreadsheets across different devices and platforms has become essential. Modern solutions have risen to this challenge with thoughtful mobile experiences and cross-platform consistency.
Mobile-optimized spreadsheet experiences
Touch-friendly interfaces for collaboration on the go have transformed how we interact with spreadsheets away from our desks. I've found that well-designed mobile spreadsheet apps focus on the most common actions and simplify complex interactions to work well on smaller screens.
Offline editing with sync capabilities ensures that work can continue even without an internet connection. Changes made offline are automatically synchronized when connectivity is restored, creating a seamless experience across different working environments.
Notification management for collaborative activities helps maintain awareness of important updates without overwhelming mobile users. I appreciate how the best mobile spreadsheet apps provide granular control over which notifications appear on mobile devices.
Cross-platform consistency challenges
Feature parity across devices and operating systems remains a challenge for spreadsheet applications. While core editing and viewing capabilities are generally available everywhere, some advanced features may be limited to desktop environments.
Performance considerations for complex collaborative spreadsheets become particularly important on mobile devices with limited processing power and memory. The best applications intelligently adapt their functionality based on the capabilities of the device being used.
To address visual consistency challenges across platforms, I've found that using PageOn.ai helps maintain a cohesive look and feel regardless of where the spreadsheet is being viewed. This ensures that important visualizations and data presentations remain effective across all devices.
Feature Availability Across Platforms
Despite these challenges, I've observed significant progress in cross-platform spreadsheet experiences over the past few years. The gap between desktop and mobile capabilities continues to narrow, with each platform playing to its strengths while maintaining core functionality.
Emerging Trends in Spreadsheet Collaboration
The evolution of spreadsheet collaboration continues at a rapid pace, with several exciting trends reshaping how teams work together with data. These innovations promise to make collaboration even more intuitive, intelligent, and integrated.
AI-powered collaboration assistants
Formula suggestions and error detection powered by artificial intelligence are transforming how we create and maintain spreadsheets. These assistants can identify potential errors, suggest optimizations, and even generate complex formulas based on natural language descriptions.
Natural language querying of spreadsheet data allows team members to ask questions in plain English and receive answers derived from the data. This dramatically lowers the barrier to data analysis, making insights accessible to everyone regardless of their technical expertise.
I've found that PageOn.ai's Agentic capabilities significantly enhance spreadsheet intelligence by providing context-aware suggestions and automations. These features understand not just the data itself but the intent behind analyses, helping teams work more effectively.
Real-time data connections
Live data feeds from external sources are transforming spreadsheets from static repositories into dynamic dashboards that reflect the current state of business operations. These connections eliminate the need for manual data imports and ensure that analyses are always based on the most current information.
Collaborative data cleaning and transformation workflows allow teams to work together to prepare data for analysis. This shared responsibility ensures higher data quality and creates a common understanding of data definitions and transformations.
For teams working with diverse data sources, PageOn.ai's Deep Search capabilities help find and integrate relevant external data that can enrich analyses and provide additional context. This feature acts as a bridge between internal spreadsheet data and the broader information ecosystem.
Data Flow in Modern Spreadsheet Ecosystems
flowchart TD
    A[External Data Sources] -->|API Connections| B[Real-time Data Layer]
    C[Manual Data Entry] -->|User Input| B
    D[IoT Devices] -->|Streaming Data| B
    E[Database Systems] -->|Scheduled Sync| B
    B -->|Transformation Rules| F[Collaborative Cleaning]
    F -->|Verified Data| G[Analysis-Ready Data]
    G -->|Formula Processing| H[Insights Layer]
    G -->|AI Analysis| H
    G -->|Statistical Processing| H
    H -->|Visualization| I[Dashboard Layer]
    H -->|Reporting| J[Communication Layer]
    H -->|Alerts| K[Notification Layer]
No-code automation within collaborative workflows
Trigger-based notifications and updates allow spreadsheets to become active participants in business processes. For example, when certain thresholds are crossed or conditions are met, the spreadsheet can automatically notify relevant team members or initiate follow-up actions.
Approval workflows and sign-off processes embedded within spreadsheets streamline decision-making based on data analysis. These structured workflows ensure that the right people review and approve changes or actions before they're implemented.
For complex automation scenarios, I've found that generate excel reports with ai tools and visualizing automation flows with PageOn.ai helps teams understand and refine their automated processes. These visual representations make it easier to identify bottlenecks, redundancies, or opportunities for further automation.
AI Feature Adoption in Spreadsheet Collaboration
Implementing Effective Spreadsheet Collaboration Strategies
Successfully implementing collaborative spreadsheet practices requires thoughtful planning, clear communication, and ongoing optimization. Here are key strategies I've found effective when helping teams transition to more collaborative approaches.
Team training and adoption approaches
Overcoming resistance to shared editing environments is often the first challenge in implementing collaborative spreadsheets. I've found that starting with small, low-risk projects and gradually expanding to more critical workflows helps build confidence and demonstrate value.
Best practices for comment etiquette and collaboration protocols help establish norms that make shared work more productive. Clear guidelines about when to comment versus when to directly edit, how to resolve discussions, and how to handle disagreements prevent confusion and conflict.
For effective onboarding of new team members, I recommend using Google Sheets tips and PageOn.ai to create visual training materials. These visual guides help new users understand not just the mechanics of collaboration features but also the team's specific workflows and conventions.
Governance frameworks for collaborative spreadsheets
Naming conventions and organization structures provide the foundation for scalable spreadsheet collaboration. Consistent naming and folder hierarchies make it easier to find relevant files and understand their purpose at a glance.
Documentation requirements for shared assets ensure that critical information about data sources, calculation methodologies, and assumptions is captured and accessible to all users. This context is essential for appropriate use of the data and for troubleshooting when issues arise.
Quality control processes for collaborative outputs help maintain the integrity and reliability of spreadsheet-based analyses. Regular reviews, validation checks, and peer audits catch errors before they impact business decisions.
Spreadsheet Governance Framework
flowchart TD
    A[Governance Policy] --> B[Structure Standards]
    A --> C[Process Standards]
    A --> D[Quality Standards]
    B --> E[Naming Conventions]
    B --> F[Folder Organization]
    B --> G[Template Standards]
    C --> H[Change Management]
    C --> I[Version Control]
    C --> J[Access Reviews]
    D --> K[Validation Rules]
    D --> L[Peer Review Process]
    D --> M[Documentation Requirements]
    E & F & G --> N[Findability]
    H & I & J --> O[Accountability]
    K & L & M --> P[Reliability]
    N & O & P --> Q[Effective Collaboration]
Measuring collaboration effectiveness
Key metrics for spreadsheet collaboration success help teams track their progress and identify areas for improvement. These might include time saved through simultaneous editing, reduction in version control issues, or increased participation across team members.
Identifying bottlenecks in collaborative workflows allows for targeted improvements. Common bottlenecks include approval delays, knowledge silos where only certain team members understand critical formulas, or technical limitations that slow down work with large datasets.
To gain deeper insights into collaboration patterns, I use PageOn.ai's analytical tools to visualize how information flows through spreadsheets and between team members. These visualizations reveal natural work patterns and help optimize the distribution of responsibilities.
Collaboration Effectiveness Metrics
Transform Your Visual Expressions with PageOn.ai
Take your spreadsheet collaboration to the next level with intuitive visualization tools that make complex data instantly understandable.
Start Creating with PageOn.ai TodayThe Future of Collaborative Spreadsheets
As we look ahead, I see spreadsheet collaboration continuing to evolve in exciting ways. The integration of artificial intelligence will make these tools even more intuitive and powerful, while deeper connections with other business systems will cement spreadsheets as central hubs for organizational intelligence.
The most successful teams will be those that embrace both the technological capabilities and the cultural shifts required for effective collaboration. This means not just adopting new tools but also developing new workflows and communication practices that leverage these capabilities.
Throughout this evolution, visualization will remain a critical component of effective spreadsheet collaboration. The ability to transform complex data into clear, compelling visuals is what ultimately enables teams to develop shared understanding and make confident decisions. This is where tools like PageOn.ai provide exceptional value—by bridging the gap between raw data and meaningful insights through powerful, intuitive visualization capabilities.
By combining modern spreadsheet collaboration features with advanced visualization tools, teams can not only work more efficiently but also uncover deeper insights and communicate them more effectively across the organization. The result is faster, better-informed decision making that drives business success.
You Might Also Like
Mastering Content Rewriting: How Gemini's Smart Editing Transforms Your Workflow
Discover how to streamline content rewriting with Gemini's smart editing capabilities. Learn effective prompts, advanced techniques, and workflow optimization for maximum impact.
Building New Slides from Prompts in Seconds | AI-Powered Presentation Creation
Discover how to create professional presentations instantly using AI prompts. Learn techniques for crafting perfect prompts that generate stunning slides without design skills.
Transforming Presentations: Strategic Use of Color and Imagery for Maximum Visual Impact
Discover how to leverage colors and images in your slides to create visually stunning presentations that engage audiences and enhance information retention.
Transform Your Google Slides: Advanced Techniques for Polished Presentations
Master advanced Google Slides techniques for professional presentations. Learn design fundamentals, visual enhancements, Slide Master, and interactive elements to create stunning slides.