Mastering Draw.io: The Ultimate Guide for Creating Professional Diagrams
Transform your ideas into powerful visual representations for academic and business settings
I've spent years creating diagrams for various projects, and I'm excited to share my comprehensive guide to Draw.io - one of the most versatile diagramming tools available today. Whether you're an academic researcher, business professional, or technical specialist, this tutorial will help you create clear, professional diagrams that effectively communicate complex ideas.
Getting Started with Draw.io
When I first discovered Draw.io, I was immediately impressed by its intuitive interface and powerful capabilities. Let me walk you through the essentials of getting started with this versatile diagramming tool.
Understanding the Draw.io Interface

The Draw.io interface consists of several key components:
- Left sidebar: Contains shape libraries and search functionality
- Top toolbar: Features formatting options and diagram controls
- Main canvas: Your primary workspace for diagram creation
- Right sidebar: Properties panel for selected elements
- Bottom status bar: Displays zoom level and other helpful information
Setting Up Your First Diagram
When creating your first diagram, I recommend taking these initial steps:
flowchart TD
    A[Start New Diagram] --> B[Choose Template or Blank Canvas]
    B --> C[Configure Page Setup]
    C --> D[Select Shape Libraries]
    D --> E[Adjust Grid Settings]
    E --> F[Begin Creating Diagram]
    F --> G[Save Your Work]
I always ensure my workspace is configured with the right page size, grid settings, and shape libraries before diving into creation. This preparation saves significant time later in the process.
Draw.io vs. Other Diagramming Tools
In my experience, Draw.io stands out for its cost-effectiveness (it's free!) and excellent integration capabilities. While Lucidchart offers superior collaboration features and Visio has a more extensive feature set, Draw.io provides the best overall balance for most users.
Key Advantages for Academic and Professional Work
- Platform independence (works on any device with a browser)
- Integration with Google Drive, OneDrive, and other storage platforms
- Extensive shape libraries for various disciplines
- No account required for basic use
- Export to multiple formats (PNG, SVG, PDF, etc.)
When working on complex academic or business projects, I've found that ai diagrams can complement Draw.io's capabilities. PageOn.ai's AI-assisted diagram creation can help you quickly generate initial diagram structures that you can then refine in Draw.io, saving valuable time in the ideation phase.
Essential Draw.io Tools and Functions
Mastering the Shape Library
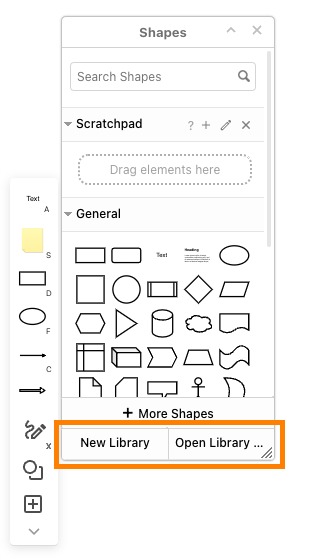
The shape library is Draw.io's powerhouse of visual elements. I regularly use these strategies to maximize its potential:
- Enable only the libraries you need to reduce clutter
- Create custom shape libraries for project-specific elements
- Use the search function to quickly find specific shapes
- Save frequently used shapes as "Scratchpad" items for quick access
For custom shapes, I recommend starting with a basic shape and using the Style panel to modify its appearance, or importing SVG files for completely custom elements.
Working with Connectors
flowchart LR
    A[Straight] --> B[Elbow]
    C[Curved] -.-> D[Entity Relation]
    E[Arrow] ==> F[Double Arrow]
Connectors are essential for showing relationships between elements. Here are my best practices:
- Use different connector styles to indicate different types of relationships
- Set appropriate routing options (auto vs. manual)
- Adjust waypoints for cleaner paths
- Use consistent arrow styles throughout your diagram
- Add labels to connectors to clarify relationships
Text Formatting and Annotation
Effective text formatting dramatically improves diagram clarity. I use these techniques:
- Consistent font families and sizes across the diagram
- Bold text for emphasis on key elements
- Text alignment appropriate to shape type
- Color coding to categorize information
- Text position adjustments to avoid overlap
Layer Management

For complex diagrams, I find layers indispensable. They allow you to:
- Separate different aspects of your diagram
- Show/hide elements as needed during presentations
- Lock background elements to prevent accidental movement
- Create alternative versions within the same file
- Manage complex overlapping elements more easily
Keyboard Shortcuts and Productivity Hacks
| Action | Windows/Linux | Mac |
|---|---|---|
| Copy | Ctrl+C | ⌘+C |
| Paste | Ctrl+V | ⌘+V |
| Group | Ctrl+G | ⌘+G |
| Ungroup | Ctrl+Shift+U | ⌘+Shift+U |
| Bring to Front | Ctrl+Shift+F | ⌘+Shift+F |
| Send to Back | Ctrl+Shift+B | ⌘+Shift+B |
Learning these shortcuts has significantly increased my diagramming efficiency. I also recommend exploring AI-powered flowchart tools to complement your Draw.io workflow for initial concept generation.
Creating Academic Diagrams with Draw.io
Research Methodology Flowcharts
flowchart TD
    A[Research Question] --> B[Literature Review]
    B --> C{Research Design}
    C -->|Quantitative| D[Data Collection: Surveys]
    C -->|Qualitative| E[Data Collection: Interviews]
    C -->|Mixed Methods| F[Multiple Data Sources]
    D --> G[Statistical Analysis]
    E --> H[Thematic Analysis]
    F --> G
    F --> H
    G --> I[Results & Discussion]
    H --> I
    I --> J[Conclusions]
When designing research methodology flowcharts, I focus on clearly illustrating the sequential steps and decision points in the research process. This helps readers understand the logical flow of the study and validates the methodological approach.
Literature Review Mind Maps

For literature reviews, I create mind maps to organize themes, theories, and connections between different sources. This helps me identify gaps in the literature and position my research within the existing body of knowledge.
Statistical and Data Visualization
Draw.io allows me to create framework diagrams for statistical analysis and integrate them with actual data visualizations. For complex statistical diagrams, I often create the structure in Draw.io and then import data visualizations created in specialized tools.
Timeline Diagrams
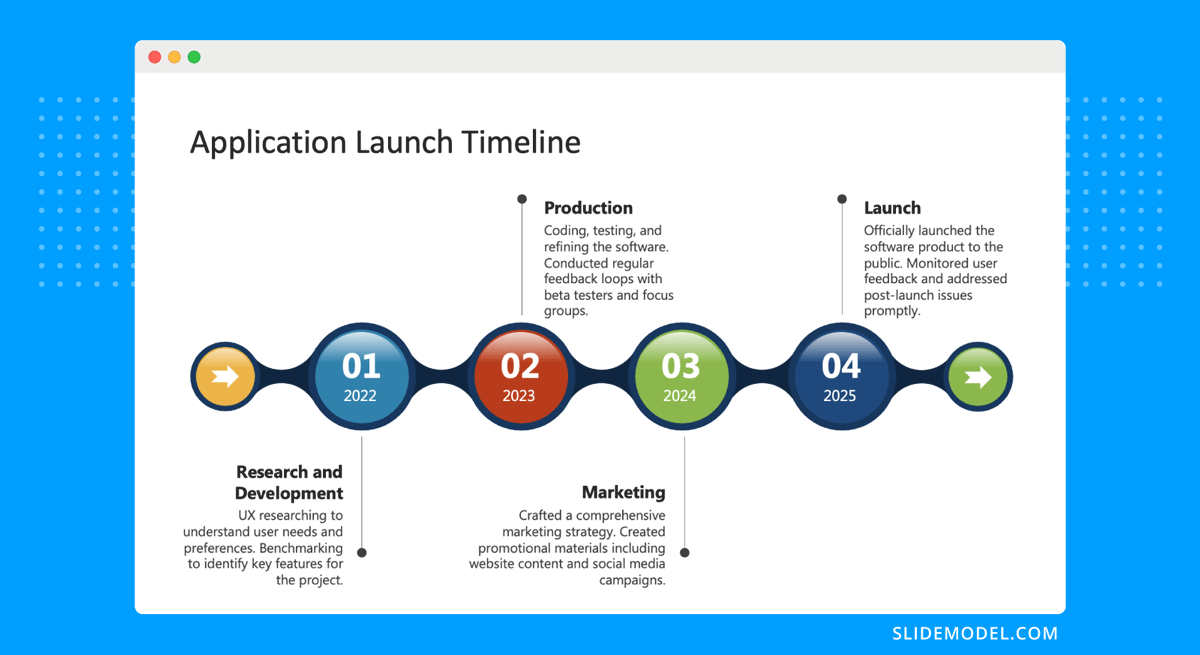
Timeline diagrams are essential for historical analyses and project planning. I create these using Draw.io's connector tools and custom shapes to represent significant events, periods, and milestones.
Tips for Academic Papers and Presentations
- Export diagrams at 300 DPI or higher for publication quality
- Use consistent styling across all diagrams in a paper
- Consider color-blindness accessibility when choosing colors
- Create both detailed and simplified versions of complex diagrams
- Use vector formats (SVG, PDF) when possible for scalability
For academic work requiring complex diagrams, I've found that using visual process guides can help structure the initial conceptualization. PageOn.ai's AI Blocks feature is particularly useful for quickly prototyping academic diagram structures before finalizing them in Draw.io.
Professional Business Diagrams
Organizational Charts
flowchart TD
    CEO[CEO] --> COO[Chief Operations Officer]
    CEO --> CTO[Chief Technology Officer]
    CEO --> CFO[Chief Financial Officer]
    COO --> PM[Production Manager]
    COO --> SM[Sales Manager]
    CTO --> DEV[Development Team]
    CTO --> IT[IT Support]
    CFO --> ACC[Accounting]
    CFO --> FIN[Finance]
    PM --> PROD[Production Staff]
    SM --> SALES[Sales Representatives]
When creating organizational charts, I focus on clarity and hierarchical relationships. Draw.io's automatic layout features are particularly helpful for maintaining consistent spacing and alignment in these diagrams.
Business Process Mapping

Business process maps are essential for documenting workflows and identifying improvement opportunities. I use swim lanes to clearly delineate responsibilities across departments and color coding to highlight decision points and bottlenecks.
Network Architecture Diagrams

For IT and network professionals, accurate architecture diagrams are critical. Draw.io offers specialized shape libraries for network components, making it easy to create professional diagrams that follow industry standards.
Strategic Planning Models
Strategic planning models and decision trees help visualize complex business decisions and their potential outcomes. I use Draw.io to create these diagrams with clear decision points and outcome branches.
SWOT Analysis and Business Canvas
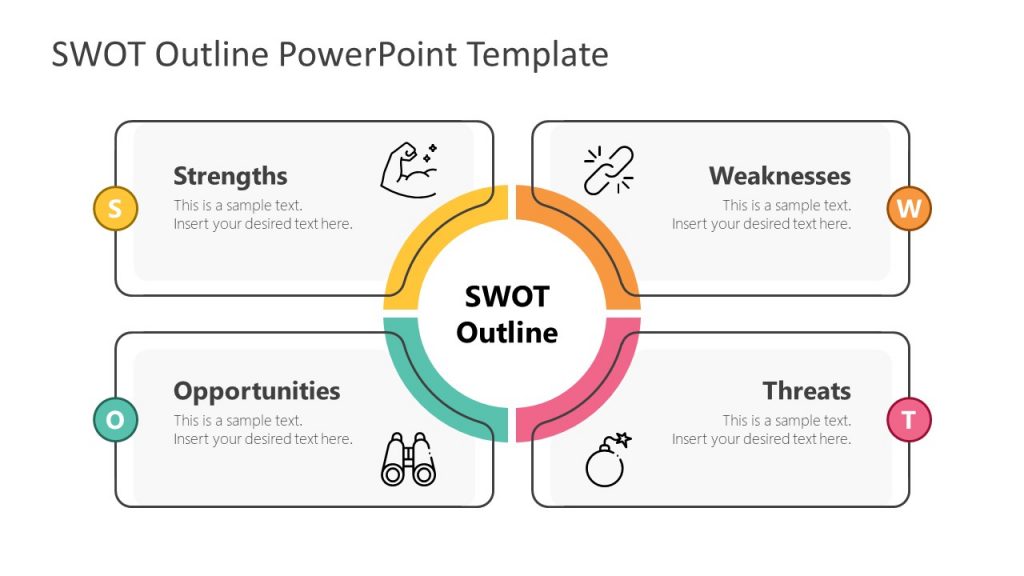
Draw.io offers templates for common business tools like SWOT analysis and business model canvas. These templates provide a professional foundation that I can customize with company-specific information and branding.
For business diagrams requiring data integration, types of diagrams that leverage PageOn.ai's Deep Search can help incorporate relevant market data points and statistics into your visual presentations.
Advanced Diagram Techniques
Custom Styles and Visual Consistency

For professional diagrams, I create custom style presets to maintain visual consistency across all elements. This includes:
- Consistent color palettes aligned with brand guidelines
- Standard shape styles for different element types
- Unified connector styles and arrow types
- Consistent text formatting and positioning
- Standardized shadow and border effects
Interactive Diagrams
Draw.io allows creation of interactive elements that enhance diagram usability:
- Clickable links to external resources or other diagrams
- Tooltip information for additional context
- Collapsible/expandable sections for complex diagrams
- Interactive layers that can be toggled on/off
- Embedded forms and interactive elements when published to the web
Using Containers and Groups
flowchart TB
    subgraph Frontend
        A[User Interface]
        B[Client Logic]
        C[API Integration]
    end
    subgraph Backend
        D[API Layer]
        E[Business Logic]
        F[Data Access]
    end
    subgraph Database
        G[SQL Database]
        H[Cache]
    end
    A --> B
    B --> C
    C --> D
    D --> E
    E --> F
    F --> G
    E --> H
For complex diagrams, I use containers and groups to organize related elements. This improves both the visual clarity and the logical structure of the diagram, making it easier for viewers to understand component relationships.
SVG Imports and Exports
SVG manipulation allows for advanced customization in Draw.io:
- Import custom SVG shapes from design tools
- Edit SVG code directly for precise control
- Create complex custom shapes not available in standard libraries
- Export to SVG for perfect scaling in documents and presentations
- Maintain vector quality for print and digital use
Advanced Connector Techniques
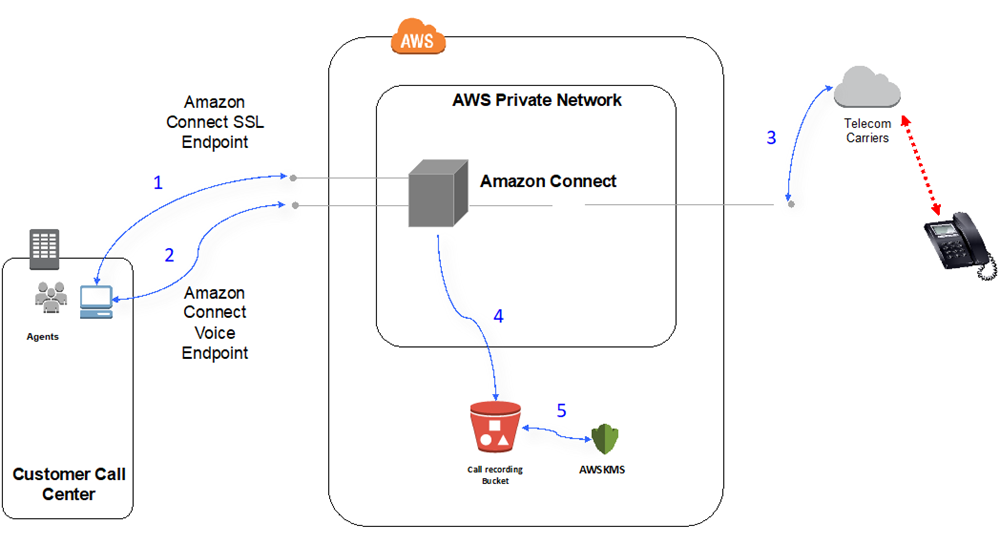
Mastering advanced connector techniques dramatically improves diagram clarity:
- Custom routing to avoid crossing lines
- Connection points optimization for cleaner layouts
- Connector styles to indicate different relationship types
- Waypoint manipulation for precise control
- Perpendicular, curved, and entity-relationship connectors for specific use cases
For particularly complex processes, I've found that ai art tools can help transform written descriptions into clear visual workflows that can then be refined in Draw.io.
Collaboration and Sharing in Draw.io
Real-time Collaboration Features

When working with teams, I leverage Draw.io's collaboration capabilities:
- Real-time editing when integrated with Google Drive or Office 365
- Comment functionality for feedback and discussions
- User presence indicators showing who's currently editing
- Change highlighting to track modifications
- Sharing with view-only or edit permissions
Version Control and Revision History
Tracking diagram evolution is crucial for complex projects. Draw.io offers version control through:
- Automatic revision history when using cloud storage
- Manual version saving with descriptive naming
- Comparison between versions to track changes
- Ability to restore previous versions
- Branching for exploring alternative design approaches
Cloud Storage Integration
Draw.io integrates seamlessly with popular cloud storage platforms:
- Google Drive for G Suite environments
- Microsoft OneDrive for Office 365 users
- Dropbox for cross-platform sharing
- GitHub for version-controlled technical diagrams
- Local storage with manual backup options
Export Options and Format Considerations
| Format | Best For | Limitations |
|---|---|---|
| PNG | Web, presentations, documents | Raster format, loses quality when scaled |
| SVG | Web, scalable graphics, print | Some applications have limited SVG support |
| Print, formal documents | Less editable after export | |
| XML | Draw.io native format, full editability | Only usable in Draw.io |
| HTML | Interactive web embedding | Requires web hosting |
I choose export formats based on the intended use of the diagram, considering factors like image quality, editability, file size, and compatibility with target platforms.
Specialized Diagram Types Tutorial
UML Diagrams
classDiagram
    class User {
        +String username
        +String email
        +String password
        +login()
        +logout()
        +updateProfile()
    }
    class Product {
        +String name
        +Float price
        +String description
        +getDetails()
        +updateInventory()
    }
    class Order {
        +Date orderDate
        +Float totalAmount
        +String status
        +processPayment()
        +shipOrder()
        +cancelOrder()
    }
    User "1" -- "many" Order : places
    Order "many" -- "many" Product : contains
UML diagrams are essential for software engineering and database design. I use Draw.io's UML shape libraries to create:
- Class diagrams: Showing object relationships, attributes, and methods
- Sequence diagrams: Illustrating message flows between system components
- Use case diagrams: Mapping user interactions with system functions
- Activity diagrams: Documenting process flows and decision logic
- State diagrams: Depicting object state transitions
Network Diagrams
Network diagrams require specialized shapes and conventions. Draw.io offers comprehensive libraries for:
- Network topology visualization with industry-standard symbols
- IT infrastructure documentation with accurate component representations
- Security architecture diagrams showing protection mechanisms
- Cloud architecture diagrams with provider-specific components
- Rack diagrams for physical infrastructure planning
Scientific Diagrams

For scientific illustrations, Draw.io provides specialized tools for:
- Laboratory setup documentation with accurate equipment representations
- Experimental process flowcharts with precise methodology steps
- Scientific concept visualizations with appropriate symbolism
- Biological pathway diagrams for research papers
- Chemical structure and reaction diagrams
Optimizing Diagrams for Different Audiences
Adapting Visual Complexity
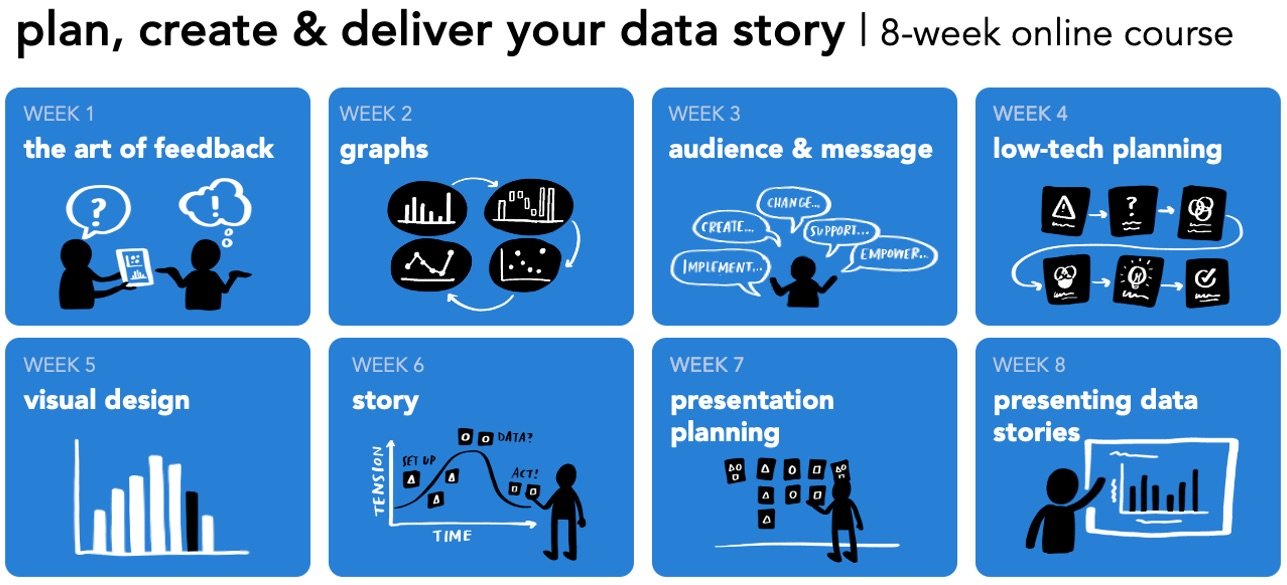
Executive Version

Technical Version
I create different versions of the same diagram based on audience needs:
- Executive level: Focused on high-level concepts and outcomes
- Management level: Balancing detail with strategic overview
- Technical team: Including comprehensive specifications and details
- Customer facing: Emphasizing benefits and user experience
- Academic audience: Including methodological rigor and references
Color Theory and Accessibility
Color choices significantly impact diagram effectiveness. I follow these principles:
- Use colorblind-friendly palettes (avoiding red-green combinations)
- Maintain sufficient contrast for readability
- Limit color palette to 4-6 colors for clarity
- Use color consistently to represent specific meanings
- Consider how colors will appear in different presentation mediums
Balancing Text and Visual Elements
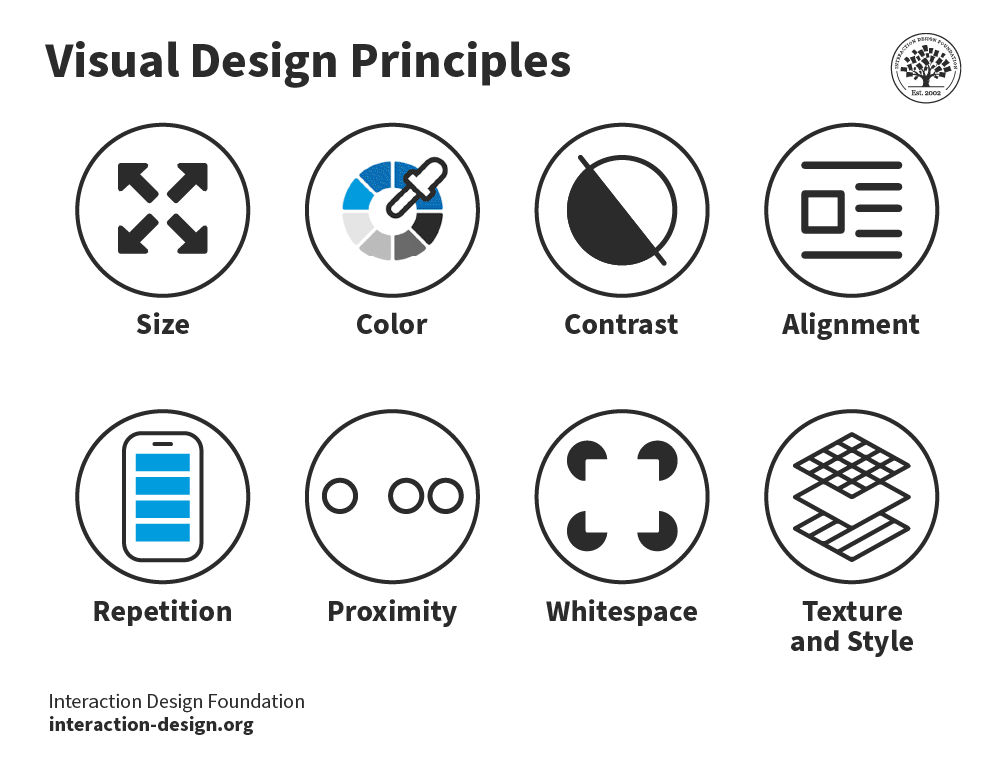
Finding the right balance between text and visuals is crucial:
- Use concise labels that convey essential information
- Implement a clear visual hierarchy to guide the viewer
- Add legends to explain symbols and color meanings
- Consider supplementary documentation for complex details
- Use tooltips for additional context in interactive diagrams
When adjusting diagrams for different audiences, PageOn.ai's Vibe Creation feature can help tailor the tone and complexity level appropriately, ensuring your message resonates with each specific group.
Troubleshooting and Problem-Solving
Common Draw.io Issues and Solutions
| Issue | Solution |
|---|---|
| Diagram loads slowly | Reduce complexity, use fewer custom images, break into multiple diagrams |
| Connectors not routing correctly | Adjust waypoints manually, change connector style, or use orthogonal routing |
| Elements misaligned | Use grid snapping, alignment tools, or distribute functions |
| Text formatting issues | Use HTML formatting options, adjust text position, or resize shape |
| Export quality problems | Increase export resolution, use vector formats like SVG or PDF |
Fixing Layout Problems
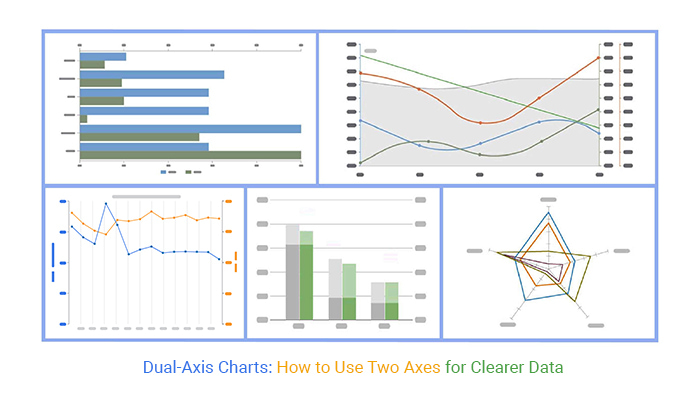
For layout issues, I use these techniques:
- Implement a clear grid system and enable snap-to-grid
- Use automatic layout features for initial positioning
- Apply consistent spacing between related elements
- Group related items to maintain their relative positions
- Use layers to separate and organize complex diagrams
Recovering Unsaved Work
To prevent data loss, I follow these practices:
- Enable autosave when using cloud storage integration
- Use browser's recovery function for local diagrams
- Create regular manual backups for important work
- Export to XML format periodically as a fallback
- Use version history features when available
Performance Optimization
For large and complex diagrams, these optimization techniques help:
- Limit the number of elements in a single diagram
- Use simpler shapes when possible
- Minimize custom images and external resources
- Split complex diagrams into linked sub-diagrams
- Disable unnecessary shape libraries
- Use the compressed XML format for storage
Taking Your Diagramming Skills to the Next Level
Integration with Other Tools

Draw.io can be integrated with various productivity ecosystems:
- Atlassian products (Confluence, Jira) for documentation
- Google Workspace for collaborative diagramming
- Microsoft Office 365 for business environments
- GitHub and GitLab for developer workflows
- WordPress and other CMS platforms for web publishing
Automating Diagram Creation
flowchart TD
    A[Data Source] --> B[Automation Script]
    B --> C[Template Selection]
    C --> D[Data Mapping]
    D --> E[Diagram Generation]
    E --> F[Export & Distribution]
For repetitive diagramming tasks, I use automation to save time:
- Draw.io's scripting capabilities for programmatic diagram creation
- Data-driven diagram generation from spreadsheets or databases
- API integration for automated updates based on system changes
- Batch processing for creating multiple related diagrams
- Template systems for consistent diagram production
Custom Templates
Creating custom templates elevates your diagramming efficiency:
- Design templates with company branding and style guidelines
- Create specialized templates for different diagram types
- Include pre-configured layers and styles
- Add placeholder text and instructional notes
- Share templates with your team for consistent output
Plugins and Extensions
Draw.io's functionality can be extended through various add-ons:
- PlantUML integration for code-based UML diagrams
- Mermaid support for markdown-based diagramming
- CSV import for data-driven diagrams
- Math typesetting for scientific diagrams
- Custom shape libraries for specialized industries
To take your diagramming to the next level, consider how PageOn.ai can transform complex textual descriptions into ready-to-use diagram structures. This AI-powered approach can significantly accelerate your initial diagram creation process, allowing you to focus more on refinement and optimization.
Transform Your Visual Expressions with PageOn.ai
While Draw.io offers powerful manual diagramming capabilities, PageOn.ai can revolutionize your workflow by instantly generating professional diagram structures from simple text descriptions. Save hours of initial setup time and focus on refining the details that matter most.
Start Creating with PageOn.ai TodayConclusion: Mastering the Art of Diagramming
Throughout this comprehensive guide, I've shared my experience with Draw.io for creating professional diagrams across academic and business contexts. From basic interface navigation to advanced techniques like custom styling and automation, mastering these skills will dramatically enhance your ability to communicate complex ideas visually.
Remember that effective diagramming is both an art and a science. While technical precision is important, the ultimate goal is clear communication that resonates with your audience. Take time to understand your viewers' needs and adapt your diagrams accordingly.
As you continue developing your diagramming skills, consider exploring how AI-powered tools like PageOn.ai can complement your workflow. The ability to quickly generate diagram structures from text descriptions can significantly accelerate your process, allowing you to focus more on refinement and less on initial setup. This hybrid approach—combining AI assistance with your expertise and creativity—represents the future of professional diagram creation.
You Might Also Like
Mastering Visual Harmony: The Art and Science of Cohesive Slide Layouts
Discover how to create visually harmonious slide layouts through color theory, typography, and spatial design. Learn professional techniques to elevate your presentations with PageOn.ai.
Mastering Visual Flow: How Morph Transitions Transform Presentations | PageOn.ai
Discover how Morph transitions create dynamic, seamless visual connections between slides, enhancing audience engagement and transforming ordinary presentations into memorable experiences.
Stock Photos in Presentations: Bringing Vibrancy and Depth to Visual Storytelling
Discover how to transform your presentations with strategic stock photography. Learn selection techniques, design integration, and visual consistency to create compelling visual narratives.
Transforming Presentations: Strategic Use of Color and Imagery for Maximum Visual Impact
Discover how to leverage colors and images in your slides to create visually stunning presentations that engage audiences and enhance information retention.
